ib economics chapter 4
0.0(0)
0.0(0)
Card Sorting
1/23
Earn XP
Study Analytics
Name | Mastery | Learn | Test | Matching | Spaced | Call with Kai |
|---|
No study sessions yet.
24 Terms
1
New cards
Indirect Taxes
Indirect taxes: a tax collected by an intermediary from the person who bears the ultimate economic burden of tax
-Excise tax: tax on specific goods and services
-Other indirect tax: sales tax and value added taxes
-Excise tax: tax on specific goods and services
-Other indirect tax: sales tax and value added taxes
2
New cards
Reasons for Indirect Taxes
1. Source of Government Revenue- helps to finance government projects, provisions of public goods and welfare benefits
2. Correct Marked Failure caused by Demerit Goods- taxes reduce consumption of cigarettes, alcohol and gambling
3. Redistribution of Income- taxes are imposed on luxury goods that can only be afforded by high income earners
4. Improve Allocation of Resources- demerit goods are overconsumed so too many resources are devoted to its production thus taxes reduce consumption and reduces resources used
3
New cards
2 Types of Indirect Taxes
1. specific tax
2. Ad valorem tax
2. Ad valorem tax
4
New cards
Specific Tax
a fixed amount of tax per unit of the good or service sold (e.g. $5 a unit)
5
New cards
Ad Valorem Tax
a fixed percentage of price of the good or service (e.g. GST of 5%)
6
New cards
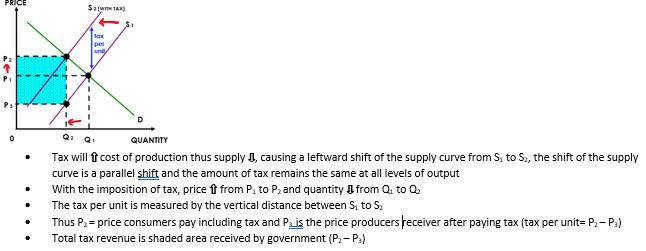
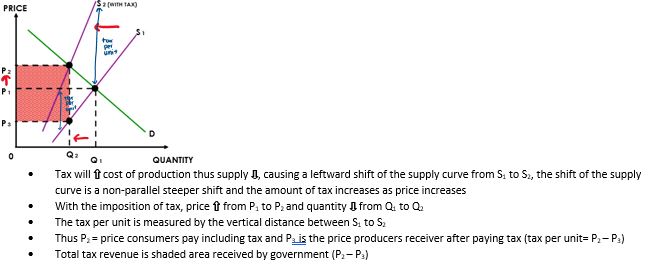
Consequences of Indirect Tax
1. Consumers- pay higher price than previously, and buy less quantity ☹ worse off
2. Producers- receive lower price and sell lesser quantity and fall in revenue ☹ worse off
3. Government- receives tax revenue 😊 better off
4. Workers- lesser quantity produced and made redundant ☹ worse off
5. Society- lesser quantity produced causes under allocation of resources ☹ worse off
2. Producers- receive lower price and sell lesser quantity and fall in revenue ☹ worse off
3. Government- receives tax revenue 😊 better off
4. Workers- lesser quantity produced and made redundant ☹ worse off
5. Society- lesser quantity produced causes under allocation of resources ☹ worse off
7
New cards
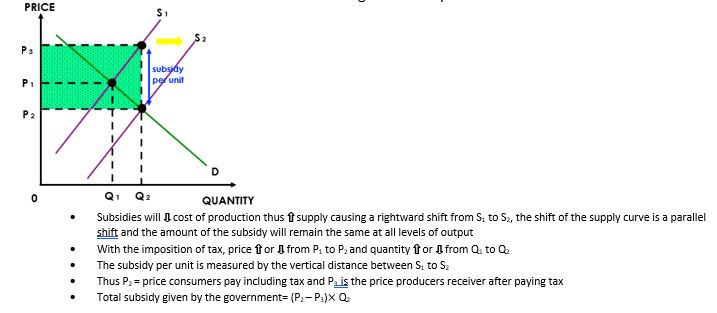
Subsidy
an amount of money given directly to firms by the government to encourage production and consumption
8
New cards
Objectives of Subsidies
1. Increases revenue & incomes of producers- usually given to agricultural producers as primary products are subjected to price volatility due to their PES and PED
2. Increase affordability for low income households- subsidies help to lower the cost of production which lowers the price of the good
3. Encourage the production and consumption of merit goods- merit goods=goods desired by the government (e.g. education and healthcare)
4. Support of the growth of certain industries- e.g. bio fuels, fuel from biological raw materials
5. Support the exporting industries- will reduce the cost of production, thus ⇩ prices of exports and ⇧ price competitiveness on the international market
9
New cards
Unit Subsidy
a specific sum per unit produced which is given to the producer
10
New cards
Consequences of Unit Subsidies
1. Consumers- pay lower prices than previously 😊 better off
2. Producers- receive a higher price and produce more quantity 😊 better off
3. The Government- have to pay subsidies to producers (green shaded bit) ☹ worse off
4. Workers- increase in employment means firms have to hire more to increase quantity, those looking to find new jobs 😊 better off
5. Society- increased quantity leads to over allocation of resources ☹ worse off
6. Foreign Producers- subsidies lower price of exports which benefits domestic producers, but foreign producers may not be able to compete with lower prices and demand falls ☹ worse off
11
New cards
Price Controls
government mandated legal minimum or maximum prices set for specific goods, usually implemented as a means of direct economic intervention to manage the affordability of certain goods.
Price ceiling or Price floor
Price ceiling or Price floor
12
New cards
Effects of Price Controls
1. Persistent market disequilibrium and distortion of market forces
2. Demand and supply forces do not determine the price and quantity
3. There will either be excess demand or supply
2. Demand and supply forces do not determine the price and quantity
3. There will either be excess demand or supply
13
New cards
Price Ceiling
A maximum price set by the government for any particular good, meaning that the price that can be legally charged by sellers of the good cannot be higher than the legal minimum price.
Example: maximum legal price imposed on housing rent, price determined by market, government makes more affordable
Example: maximum legal price imposed on housing rent, price determined by market, government makes more affordable
14
New cards
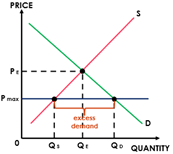
Price Ceiling Graph
• Equilibrium price and quantity are shown and maximum price set by the government is indicated by Pmax
• The price ceiling must be set below the market equilibrium to be effective
• At Pmax, quantity demand is greater than quantity supplied creating a market disequilibrium
• Thus there is excess demand = (QD – Qs)
• The price ceiling must be set below the market equilibrium to be effective
• At Pmax, quantity demand is greater than quantity supplied creating a market disequilibrium
• Thus there is excess demand = (QD – Qs)
15
New cards
Consequences of Price Ceilings
1. Limited quality- not all consumers will benefit from the lower prices due to excess demand and results in non-price rationing which include queuing and using coupons
2. Existence of underground and black markets- consumers who are unable to purchase goods legally on the market may resort to paying higher princes on black markets, as black markets work against the objective of price ceilings
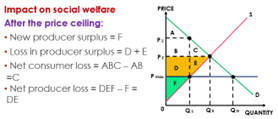
3. Allocation of resource and efficiency- the misallocation of resources as producers are not willing to supply more due to the lower price because too little resources are devoted to the production of the good. Consumers’ preferences are not represented properly, thus resulting in allocative inefficiency
4. Social welfare- before price ceilings, price and quantity are determined by demand and supply (blue=consumer surplus, yellow= producer surplus). After imposed ceiling, there is a loss in consumer surplus (red shaded area) and loss in consumer surplus (shaded dark blue)
2. Existence of underground and black markets- consumers who are unable to purchase goods legally on the market may resort to paying higher princes on black markets, as black markets work against the objective of price ceilings
3. Allocation of resource and efficiency- the misallocation of resources as producers are not willing to supply more due to the lower price because too little resources are devoted to the production of the good. Consumers’ preferences are not represented properly, thus resulting in allocative inefficiency
4. Social welfare- before price ceilings, price and quantity are determined by demand and supply (blue=consumer surplus, yellow= producer surplus). After imposed ceiling, there is a loss in consumer surplus (red shaded area) and loss in consumer surplus (shaded dark blue)
16
New cards
Effects of Price Ceilings
5. Consumers- 😊+☹ better + worse, gain increase from surplus or unable to buy from limited supply
6. Producers- receive a lower price and produce less quantity, thus less revenue ☹ worse off
7. Workers- lesser quantity produced, firms may not need as many workers ☹ worse off for unemployed
8. Government- no financial gain or loss, government may gain popularity 😊 better off
6. Producers- receive a lower price and produce less quantity, thus less revenue ☹ worse off
7. Workers- lesser quantity produced, firms may not need as many workers ☹ worse off for unemployed
8. Government- no financial gain or loss, government may gain popularity 😊 better off
17
New cards
Price Floor
A minimum price set by the government for any particular good, meaning that the price that can be legally charged by sellers of the goof cannot be lower than the legal minimum price.
18
New cards
Reasons for Price Floors
1. Helps protects incomes and revenues of producers in certain industries (agriculture)
2. Helps to alleviate the problem of poverty and to protect workers by imposing minimum wage
2. Helps to alleviate the problem of poverty and to protect workers by imposing minimum wage
19
New cards
Price Floor Graph
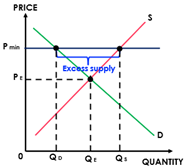
• Equilibrium price and quantity are shown and minimum price set by the government is indicated by Pmin
• The price ceiling must be set above the market equilibrium to be effective
• At Pmin, quantity supply is greater than quantity demand creating a market disequilibrium
• Thus there is excess demand = (QS – QD)
• The price ceiling must be set above the market equilibrium to be effective
• At Pmin, quantity supply is greater than quantity demand creating a market disequilibrium
• Thus there is excess demand = (QS – QD)
20
New cards
Price floor example (agriculture)
Price floors for agricultural products:
• Because PED and PES is inelastic for agricultural products, there is price volatility
• Income and revenue of farmers are unstable so government will impose minimum prices on certain goods
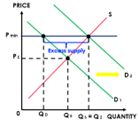
• At Pmin the market cannot clear or reach a new equilibrium
• To eliminate the excess supply, the government will buy up
excess supply
• This causes a rightward shift of demand from D1 to D2
• Price is maintained at Pmin and quantity traded will be at Qs=Q2
Thus creates excess supply, if the government buts it up, they will need to be able to store it for long periods of time (take into account perishable products)
• Because PED and PES is inelastic for agricultural products, there is price volatility
• Income and revenue of farmers are unstable so government will impose minimum prices on certain goods
• At Pmin the market cannot clear or reach a new equilibrium
• To eliminate the excess supply, the government will buy up
excess supply
• This causes a rightward shift of demand from D1 to D2
• Price is maintained at Pmin and quantity traded will be at Qs=Q2
Thus creates excess supply, if the government buts it up, they will need to be able to store it for long periods of time (take into account perishable products)
21
New cards
Minimum wage (falls under price floor)
a minimum price of labour set by the governments in the labour market, in order to ensure that low skilled workers can earn a wage high enough to secure them with access to basic goods and services
22
New cards
Minimum wage graph
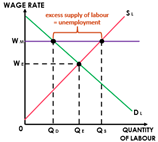
• Market forces of demand and • • • supply of labour determine the market wage rate WE, minimum wage= WM
• But sometimes, the market wage rate may be too low thus there is a need for implementation of minimum wage
• Minimum wage creates a situation of excess supply of labour since QS > QD leading to unemployment
• Since demand no longer equals supply, the market does not clear thus minimum wage causes distortion of market forces
23
New cards
Consequences of minimum wage
1. Unemployment- higher wage rates makes work more attractive thus it is a movement along the supply curve, firms hiring workers are more expensive thus quantity demanded will fall
2. Illegal workers- some workers may be willing to work at lower wages
3. Misallocation of labour resources- market wage rate acts as a signal and incentive for workers and firms to determine optimum allocation of resources
4. Misallocation in product markets- raises the cost of production for firms as hiring workers will be more expensive, higher costs of production will shift the supply curve of the production to the left leading to the misallocation as less is being produced
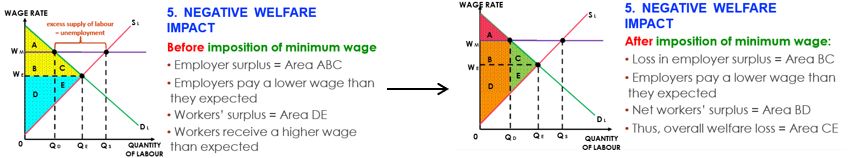
5. Negative welfare impact (see picture)
2. Illegal workers- some workers may be willing to work at lower wages
3. Misallocation of labour resources- market wage rate acts as a signal and incentive for workers and firms to determine optimum allocation of resources
4. Misallocation in product markets- raises the cost of production for firms as hiring workers will be more expensive, higher costs of production will shift the supply curve of the production to the left leading to the misallocation as less is being produced
5. Negative welfare impact (see picture)
24
New cards
Effects of Minimum Wage
6. Firms- have to pay higher wages which increases cost of production ☹ worse off
7. Consumers- increase cost of production means decrease in supply leading to the increase of price of products ☹ worse off
8. Workers- higher wages leads to unemployment 😊+☹ win lose dependent on situation
7. Consumers- increase cost of production means decrease in supply leading to the increase of price of products ☹ worse off
8. Workers- higher wages leads to unemployment 😊+☹ win lose dependent on situation