
Looks like no one added any tags here yet for you.
Water molecules are described as dipolar. Define (2 marks)
Oxygen atom has a slightly negative charge Hydrogen atoms have slightly positive charges
Figure 1 shows an micrograph image of palisade cells from a leaf after being placed in a salt solution. (plasmolysised pic)
i)Describe and explain the appearance of the cells in Figure 1. [3 marks]
ii)Explain why the condition of the cells in Figure 1 is a problem for plants. [1 mark]
iii)Suggest how the cells in Figure 1 can return to their normal appearance. [2 marks] (6)
i) -In the cells in Figure 1, the cell membranes are detached from the walls/ plasmolysised. - This is because the salt solution (the cells were placed in) has a lower water potential than the cell - which causes water to leave the cells via osmosis
(ii) The condition of the cells in Figure 1 is a problem for plants because the leaves will begin to wilt, which disrupts photosynthesis./ Turgidity in plant cells: - Provides strength and support to leaves so they are able to photosynthesise efficiently
iii)The palisade cells can return to their normal appearance by decreasing their water potentials, (1) which is achieved by actively transporting ions into the cells. (1)
Explain why donated human organs are placed in an isotonic soloution during transport (3 marks)
-so theres no net movement of water in or out of the cells via osmosis
-so that cells dont gain water (lyse)/burst due to osmosis
-so in contrast cells dont lose water/ shrivel (crenate) via osmosis also
Fluorescence recovery after photobleaching (FRAP) is a laboratory technique for measuring membrane fluidity.
Proteins tagged with a fluorescent dye are inserted into a membrane. A selected area of the membrane is ‘bleached’ with a laser, which permanently deactivates the dye molecules in that area and produces a dark patch. The time taken for the dark patch to become fluorescent again is called the recovery time and is a measure of membrane fluidity.
A scientist conducts FRAP on membranes from three types of animal cells. They plot the recovery times against the concentration of cholesterol in the membranes in Figure 1.
i) Describe what is meant by membrane fluidity. [1 mark]
ii) Explain why the bleached area of the membrane becomes fluorescent again after a period of time. [1 mark]
iii) Describe and explain the relationship between recovery time, membrane fluidity and cholesterol concentration in Figure 1. [3 marks]
iv) Suggest why cholesterol content is higher in the membranes of red blood cells than gut epithelial cells. [2 marks]
v) State one variable that should be kept constant during the experiment and explain your answer. [2 marks]
i) ability of lipids or proteins to diffuse in the plane of the membrane
ii) proteins move in membranes through diffusion, active fluorescent proteins will eventually diffuse into the bleached area, turning it fluorescent again ( active fluorescent proteins diffuse from other parts of the membrane into the bleached/dark area).
iii) According to the information, the shorter the recovery time, the higher the membrane fluidity, as in Figure 1. As cholesterol concentration increases, recovery time increases. This is becuase the cholesterol can fit between fatty acid tails of phospholipids, restricting the movement of membrace components
Water has one of the highest known latent heat of vaporisation values of any substance. Define this term (2 marks)
the thermal energy absorbed by the water to evaporate/change state from liquid to gas
without causing an increase in temperature
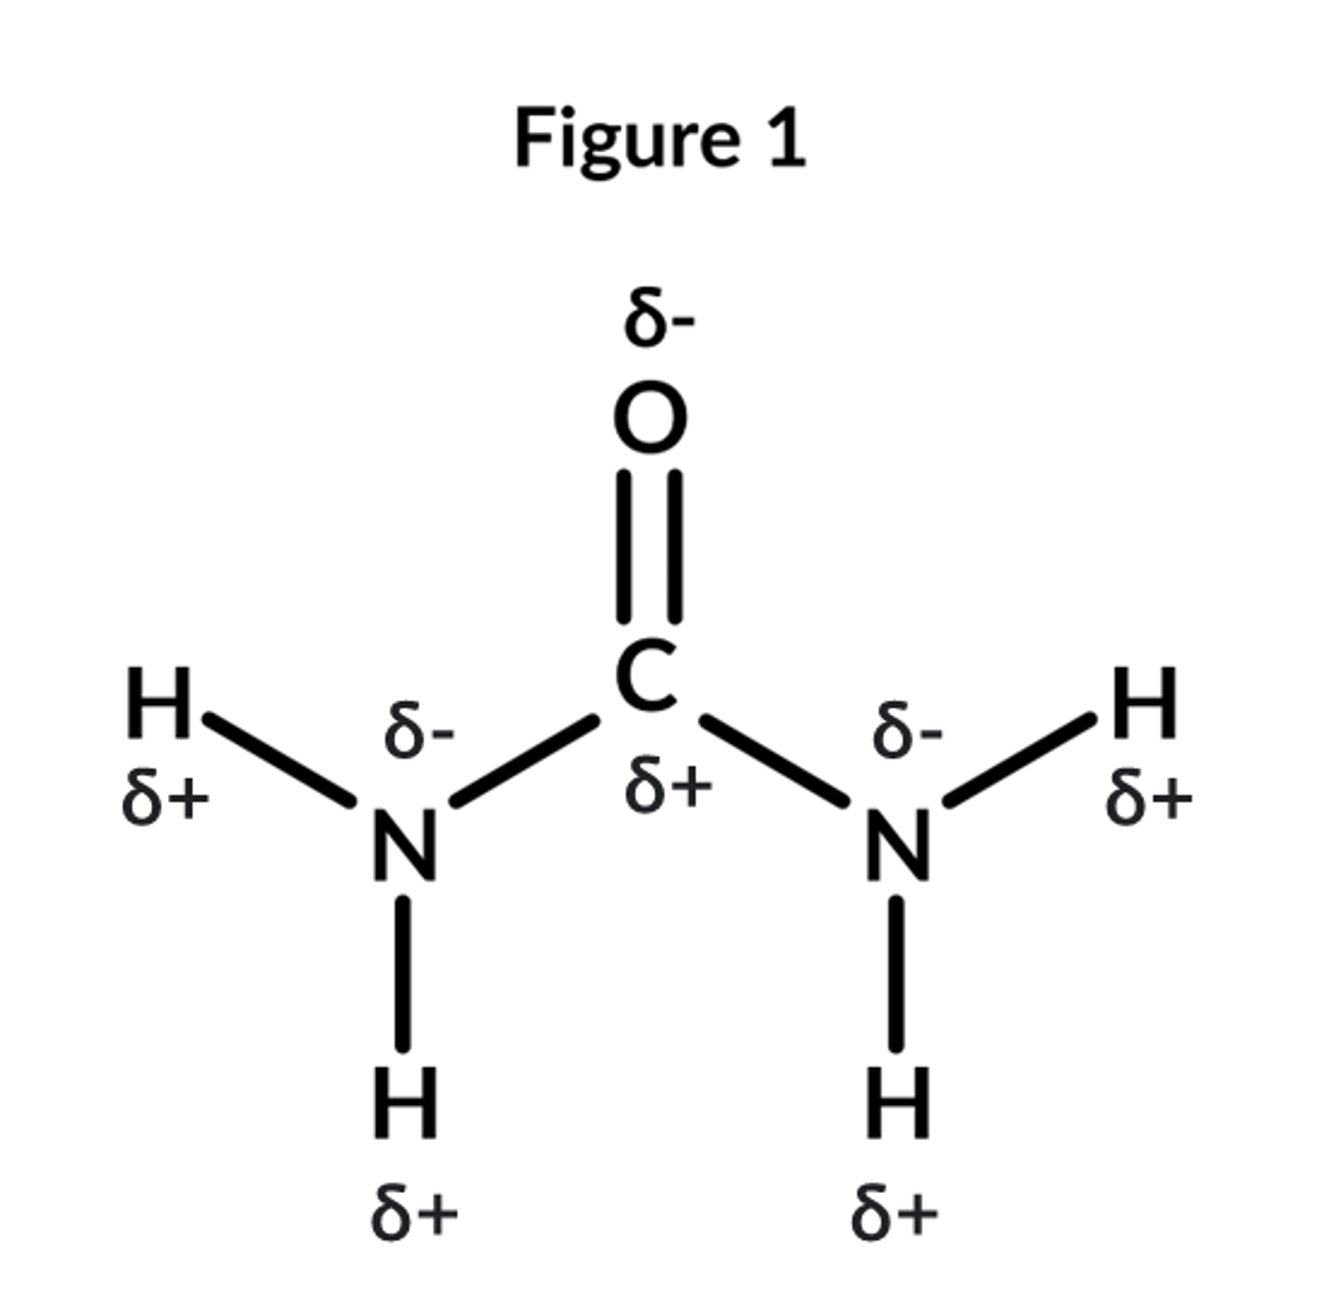
Figure 1 shows the structure of urea. Describe and explain the properties of urea that allows it to enter cells by facillitated diffusion (4 marks)
urea is hydrophilic/polar
meaning it can only pass through channels in the membrane as it is lipid-insoluble
urea has complementary shape to channel proteins
meaning it can attach to channel proteins
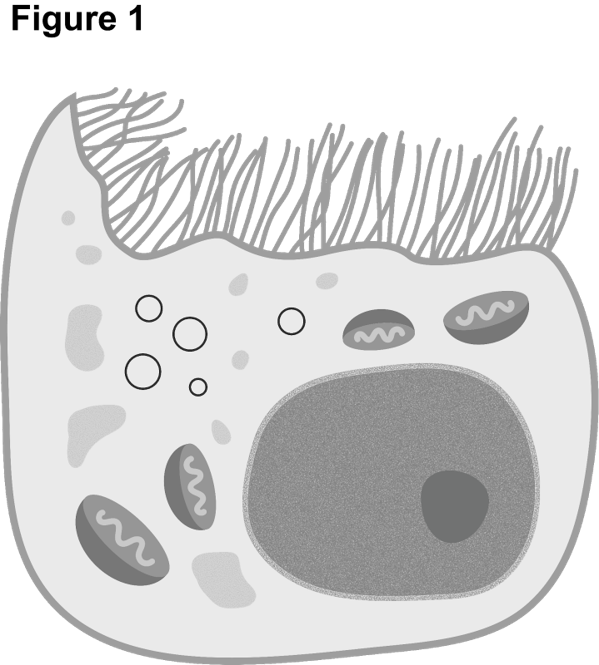
Figure 1 shows an electron micrograph of a cell from the kidney. Suggest and explain how this cell is adapted for rapid transportation across its cell membrane (4 marks)
many microvilli/folds in the cell membrane
which creates a large surface area
many transports proteins: channel/ carrier
for facillitated diffusion/ active transport/ co transport
many mitochondira
to produce atp for active transport
many vesicles
to transport the carrer proteins to the cell surface membrane
A student wanted to investigate the rate of diffusion in different cubes of agar. She placed Cubes A to A into 10 ml of water, with 2 ml of food colouring, and timed how long it took for the blocks to go pink. Her results are summarised in Figure 1.
i) Calculate the surface area of Cube C [2 marks]
ii) Explain which cube would have the fastest rate of diffusion. [2 marks]
iii) Surface area : volume is one factor that affects diffusion. Suggest one other feature of an organism that allows for rapid diffusion. [1 mark]
iv)Explain one way in which the student could improve her method. [1 mark]
i)
length x no squares on cube → 6×6=36
surface area of cube C= surface area of square x number of squares on cube → 36 × 6 = 216
ii)
cube A has the fastest rate of diffusion
larger surface to volume ratio
iii)
short diffusion pathway/ large maintained conc grad/ p.p membrane
iv)
tale averages/ carry out repeats for teh time taken
Describe how ATP is broken down and used to make other compounds more reactive (4 marks)
ATP broken down through hydrolysis reaction
ATP→ ADP + Pi
catalysed by ATP bydrolase
during ATP hydrolysis, energy is released
PI can bind to or phosphorelate other compunds in the cell
Adenosine triphosphate (ATP) causes the muscle tissue to shorten in length. A scientist conducted a study to see how ATP solution affects a small sample of muscle tissue. Increasing concentrations of ATP solution were added to samples of muscle tissue of the same starting length. After 15 minutes, the final length was recorded.
i) Explain the results shown in Figure 9. [2 marks]
ii) The scientist kept the initial length of all muscle tissue samples the same. State two other variables that should be controlled in this experiment. [2 marks]
iii) The experiment was repeated with increasing concentrations of glucose. The muscle tissue samples were left within each solution for 15 minutes. Compared to ATP, an increasing glucose concentration shortened the length of each muscle tissue sample less. Suggest why. [1 mark]
i)
as the concentration of ATP increases, more energy is released
the more energy that is available, the more muscle contraction can take place, resulting in the length of the muscle to shorten
ii)
the volume of the ATP soloution must be kept the same (could affect the conc of muscle
temperatire of ATP soloution must stay the same ( could affect atphydrolyse which breaks down atp)
area the muscle tissue sample is taken from must be the same (others could contain different concs of enzyme hydrolase or muscle fibres)
iii)
it takes longer for the muscl to break down glucose into ATP which provdies energy for muscle contractions (resp relases atp slower than hydrolysis of atp)
Compaer and contrast facillitated diffusion and active transport (4 marks)
both use carrier proteins
both transport substances across membranes
fac: paasive wheras active: requires energy release from ATP
fac: occours down the conc grad wheras active: occours against conc grad
fac: channel and carier proteins wheras active: carrier proteins
A scientist investigated the rate of uptake of a solute into bacterial cells by simple diffusion and active transport. Their results are shown in Figures 1 and 2.
i) Identify which mode of transport each line in Figure 1 corresponds to. [1 mark]
ii) Explain why line Y in Figure 1 plateaus at point A. [2 marks]
iii) Figure 2 shows the change in the internal concentration of the solute over time. Explain why the line, which represents simple diffusion, plateaus at point B. [2 marks]
i)
active transport uses carrier proteins to transport molecule
once all carrier proteins are in use, the rate of uptake cannot increase
ii)
the concentration of solute inside the cell exceeds the concentration of solute outside the cell, meaning solutes no longer mainly diffuse into the cell
this causes the rate of diffusion to fail
becuase rate of simple diffusin is proportional on a conc grad
Figure 1 shows the results of an investigation into the rate of glucose absorption in the ileum.
i) Describe and explain the shape of the graph in Figure 1, using the labels to structure your answer. [4 marks]
ii) Explain how the uptake of glucose would be affected by a respiratory inhibitor. [4 marks]
i)
rate of glucose uptake is proportional to sodium concentration
steeper concentration gradient between illelum lumen and illeum epithelial cells
sodium-glucose co transportation (of )
ii)
atthe beginning of experiment (A) thegreater the glucose uptake into the illeum of teh cells the greater the sodium concentration inside the ileum cells
A student investigates the water potential of leaf tissue from 5 plant species across the world.
i) Describe and explain a method that could be used to determine the water potential of plant tissue. [5 marks]
ii) Suggest why it might be advantageous for plants in hot, dry climates to have a lower water potential in their leaves. [2 marks]
iii) The student plots the water potential of each plant against the distance from the equator where the sample of leaf tissue was obtained from. He calculates a correlation coefficient of 0.4 and concludes that plants further from the equator have higher water potential in their leaves. Evaluate his conclusion. [3 marks]
i)
first place the samples of the plant tissue in soloutions with different concs of solutes
then after a period of time, record the change in the mass of tissuses
using these cells, plot a calibration currve, record the solute concentratuin where there is no change in mass of teh plant tissue
the solute concentration has the same water potential as teh plant tissue
ii)
at lower water potential in the leaves means leave have a smaller water potential gradient with the surrounding air
this emans that less water is lost in transpiration which is advantageous to plants in hot dry climates
iii)
the stidents concluson could have been correct becuase he calculated corr.coef at 0. which indicates a weak positive correlation between the water potential of a plant and teh distance from the equator where the sample was collected
howver teh student only used 5 plants which si a very small sample size
futhermore they only smapled one individual of each plant species which may not represnt teh global distribution of plants
![<p>Figure 1 shows an micrograph image of palisade cells from a leaf after being placed in a salt solution. (plasmolysised pic)</p><p></p><p>i)Describe and explain the appearance of the cells in Figure 1. [3 marks] </p><p>ii)Explain why the condition of the cells in Figure 1 is a problem for plants. [1 mark] </p><p>iii)Suggest how the cells in Figure 1 can return to their normal appearance. [2 marks] (6)</p>](https://knowt-user-attachments.s3.amazonaws.com/420074c0-7f25-479e-b645-f1e3d8be1ee9.png)
![<p>Fluorescence recovery after photobleaching (FRAP) is a laboratory technique for measuring membrane fluidity. </p><p>Proteins tagged with a fluorescent dye are inserted into a membrane. A selected area of the membrane is ‘bleached’ with a laser, which permanently deactivates the dye molecules in that area and produces a dark patch. The time taken for the dark patch to become fluorescent again is called the recovery time and is a measure of membrane fluidity. </p><p>A scientist conducts FRAP on membranes from three types of animal cells. They plot the recovery times against the concentration of cholesterol in the membranes in Figure 1.</p><p>i) Describe what is meant by membrane fluidity. [1 mark]</p><p> ii) Explain why the bleached area of the membrane becomes fluorescent again after a period of time. [1 mark] </p><p>iii) Describe and explain the relationship between recovery time, membrane fluidity and cholesterol concentration in Figure 1. [3 marks]</p><p> iv) Suggest why cholesterol content is higher in the membranes of red blood cells than gut epithelial cells. [2 marks] </p><p>v) State one variable that should be kept constant during the experiment and explain your answer. [2 marks]</p><p></p>](https://knowt-user-attachments.s3.amazonaws.com/09c37804-355e-4159-884c-74d542c3c26b.png)
![<p>A student wanted to investigate the rate of diffusion in different cubes of agar. She placed Cubes A to A into 10 ml of water, with 2 ml of food colouring, and timed how long it took for the blocks to go pink. Her results are summarised in Figure 1. </p><p>i) Calculate the surface area of Cube C [2 marks] </p><p>ii) Explain which cube would have the fastest rate of diffusion. [2 marks] </p><p>iii) Surface area : volume is one factor that affects diffusion. Suggest one other feature of an organism that allows for rapid diffusion. [1 mark] </p><p>iv)Explain one way in which the student could improve her method. [1 mark]</p>](https://knowt-user-attachments.s3.amazonaws.com/f5b23f18-6b24-467d-a6d5-d4a512c67edc.png)
![<p>Adenosine triphosphate (ATP) causes the muscle tissue to shorten in length. A scientist conducted a study to see how ATP solution affects a small sample of muscle tissue. Increasing concentrations of ATP solution were added to samples of muscle tissue of the same starting length. After 15 minutes, the final length was recorded. </p><p>i) Explain the results shown in Figure 9. [2 marks] </p><p>ii) The scientist kept the initial length of all muscle tissue samples the same. State two other variables that should be controlled in this experiment. [2 marks] </p><p>iii) The experiment was repeated with increasing concentrations of glucose. The muscle tissue samples were left within each solution for 15 minutes. Compared to ATP, an increasing glucose concentration shortened the length of each muscle tissue sample less. Suggest why. [1 mark]</p>](https://knowt-user-attachments.s3.amazonaws.com/68bed8eb-4b56-41ea-9590-9f3e4c80b565.png)
![<p>A scientist investigated the rate of uptake of a solute into bacterial cells by simple diffusion and active transport. Their results are shown in Figures 1 and 2. </p><p>i) Identify which mode of transport each line in Figure 1 corresponds to. [1 mark] </p><p>ii) Explain why line Y in Figure 1 plateaus at point A. [2 marks] </p><p>iii) Figure 2 shows the change in the internal concentration of the solute over time. Explain why the line, which represents simple diffusion, plateaus at point B. [2 marks]</p>](https://knowt-user-attachments.s3.amazonaws.com/f2ac871a-01ed-466a-8b6e-6b2b09b903be.png)
![<p>Figure 1 shows the results of an investigation into the rate of glucose absorption in the ileum. </p><p>i) Describe and explain the shape of the graph in Figure 1, using the labels to structure your answer. [4 marks] </p><p>ii) Explain how the uptake of glucose would be affected by a respiratory inhibitor. [4 marks]</p>](https://knowt-user-attachments.s3.amazonaws.com/066307ad-f120-4c6c-852e-70fdfde0b4f5.png)