Population dynamics (copy)
1/45
Earn XP
Description and Tags
Name | Mastery | Learn | Test | Matching | Spaced | Call with Kai |
|---|
No study sessions yet.
46 Terms

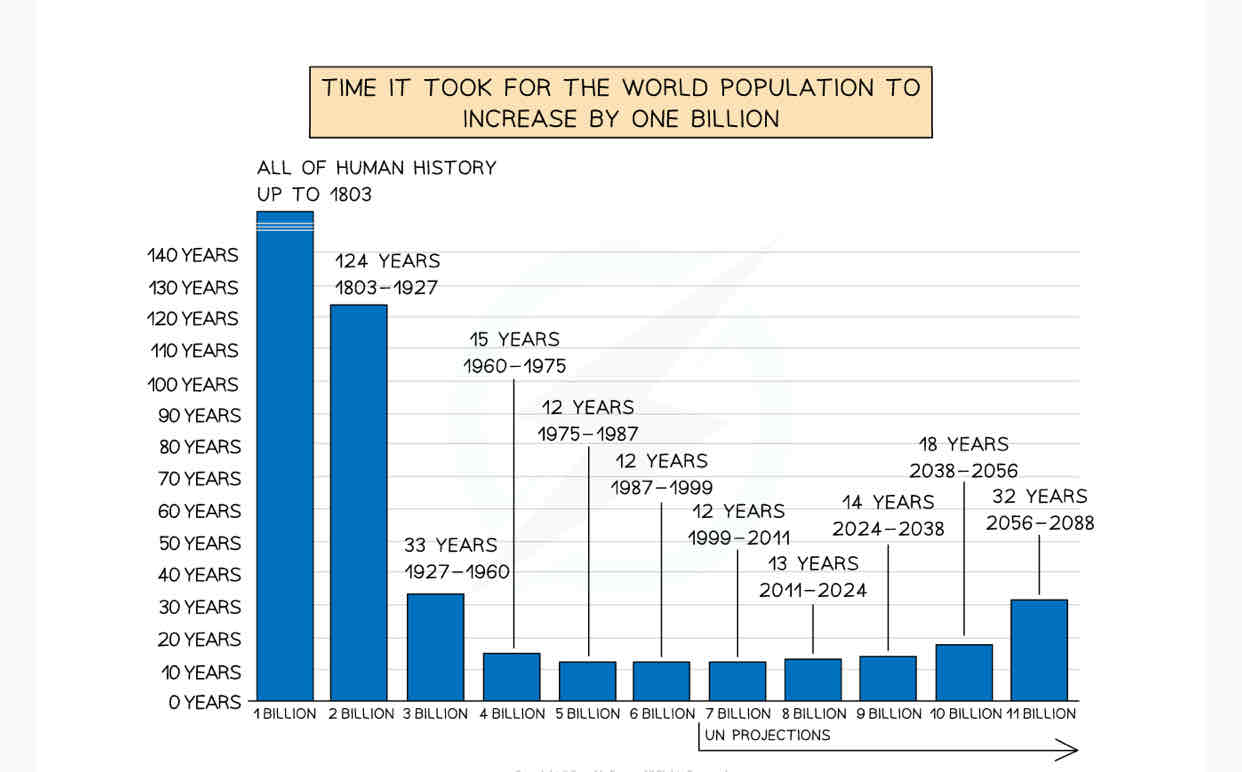
Describe the population increase in the world.
The world’s population is increasing by about 80 million ppl a year.
In 1804, the worlds population was 1 billion as the population growth was steady and low
It took over 100 yrs for the population to get to 2 billion.
How do you describe population change on a graph? What do you need to consider when writing your exam?
What is the main trend? Is it increasing, decreasing or staying the same.
Has the change been rapid or slow?
Have the changes been around specific times.
Are there any anomalies(was it expected)?
Don’t forget to use figures from a graph
What is population growth rate?
the average annual change in population size over a set period of time, usually a year.
What is the difference between population increase and population growth rate?
Population increase can increase at different rates, but the rate in which it’s increasing at is the growth rate.
What is a carrying capacity and what could this lead to?
This is the number of ppl that can help an area.
Overpopulation: when there are more ppl than resources in an area
Underpopulation: when there are more resources than ppl available than population.
What can overpopulation cause increased?
Levels of pollution
Crime Rates
Unemployment
Levels of food shortage
Pressure on services
What are some consequences of underpopulation?
Fewer ppl pay taxes leads to high taxes
Underused resources leads to waste
A shortage of workers
Lower levels of exports which affects the wealth of a country
Fewer customers buy goods and services
Case study: Nigeria. Give an overview about Nigeria.
Nigeria's population is over 217 million and is forecast to reach 400 million by 2050 and 1 billion by 2100
Lagos is predicted to become the world's largest city by 2100
30% of the population live in poverty earning less than $515 a year
The urban population has increased from 18% in 1960 to almost 53% in 2021
Nigeria is experiencing rapid population growth at 2.5%
Nigeria's population density is 226 people per km2
In Lagos, the population density reaches 6871 people per km2
What are some of Nigeria’s resources?
Nigeria has many resources including oil, gas, iron ore, coal, zinc and arable land
The resources do not provide wealth to the whole population due to:
Poor management
Ownership by foreign companies
Corruption
The top 5 richest Nigerians own and control more resources than the remaining 95% combined
Combined with rapid population growth, it means that currently, resources are not supporting the population
What are Nigeria’s causes of overpopulation?
The high birth and fertility rates are the main cause of the rapidly increasing population
The age of marriage in some areas can be as low as 13 and 45% of women are married before they reach 18
This increases the number of children each woman has; due to being married and of childbearing age for longer
The fertility rate is 5.32 births per woman (2019)
Larger families are traditionally associated with higher social status
In the past infant mortality rates have been high 125 per 1000 (1990) this decreased to 72 per 1000
High infant mortality rates are associated with high fertility rates as women have more children to ensure that some survive to adulthood. It takes time for this to adjust to lower infant mortality rates
Religious beliefs lead to larger family size
Lack of education about family planning and contraception
The decreasing death rate also contributes to the rising population
Life expectancy is increasing
The death rate has fallen from 19 per 1000 (1990) to 11 per 1000 (2020)
What are the impacts of overpopulation?
Lack of fresh water which leads to the spread of disease
29% of children in Nigeria do not have enough water to meet their daily needs
Increased levels of water, air and land pollution
Lagos has one of the highest levels of air pollution of any city in the world
Increased cultivation of land for food which leads to soil erosion and desertification
40 million people in northern Nigeria are at risk of losing their livelihoods due to desertification
19.5 million faces acute food insecurity
Increased pressure on already poor services such as health and education
Higher crime rates
High youth unemployment has led to increased gang activity and militant groups
Development of informal settlements around cities particularly Lagos
An estimated 70% of the population of Lagos lives in informal settlements
66% live on less than US$1 a day
Case study: Canada. Give an overview about Canada’s population.
Canada is the second-largest country in the world
Population of 38.5 million
Population density of 4 people per km2
The rate of natural increase for Canada is 2.42 per 1000
Most of the net population increase is the result of immigration
What are some resources in Canada?
Fishing - it has the longest coastline in the world
Largest producer of zinc and uranium
Timber
Gas, coal and oil
Gold, nickel, lead and aluminium
Major exporter of wheat
What are some causes of under-population in Canada?
The main cause of under-population in Canada is the low birth and fertility rates
Low birth rate of 9 births per 1000
Fertility rate is 1.47 children per woman which is below the fertility replacement rate of 2.1
The reasons for these low rates include:
The average age for a woman to have her first child is 31 years, which means that her childbearing years are reduced
Increased levels of family planning and access to contraceptives
Higher levels of education mean that women have careers and delay having children
It has many areas which are remote and difficult to access, building infrastructure for settlements and industry would be costly
What are some impacts of under-pollution?
Shortages of workers in a number of areas including:
Construction
Engineering
Food services
Health care
Low rates of unemployment
An ageing population means more people of retirement age
Fewer workers to pay taxes
Healthcare and other social costs increase as the population ages
Resources are not exploited fully reducing potential
Lack of services due to low demand particularly in rural areas
Describe the impacts of over-population on a country.
Lack of housing
Pressure on healthcare
Pressure on educational facilities
Lack of employment
Lack of food
What is net migration?
the difference between the number of ppl moving into a country (immigration) and the number of ppl leaving a country (emigration)
What factors have caused the rapid population in improvements?
Agriculture during agricultural revolution led to higher yields.
Medical care reduces the death rate
Technology and transport lead to a wealthier population.
Why is the birth rate high in LEDCs?
Cannot afford contraception
Lack of education about contraception
Children needed for farming
Early marriages
Traditional views on large families
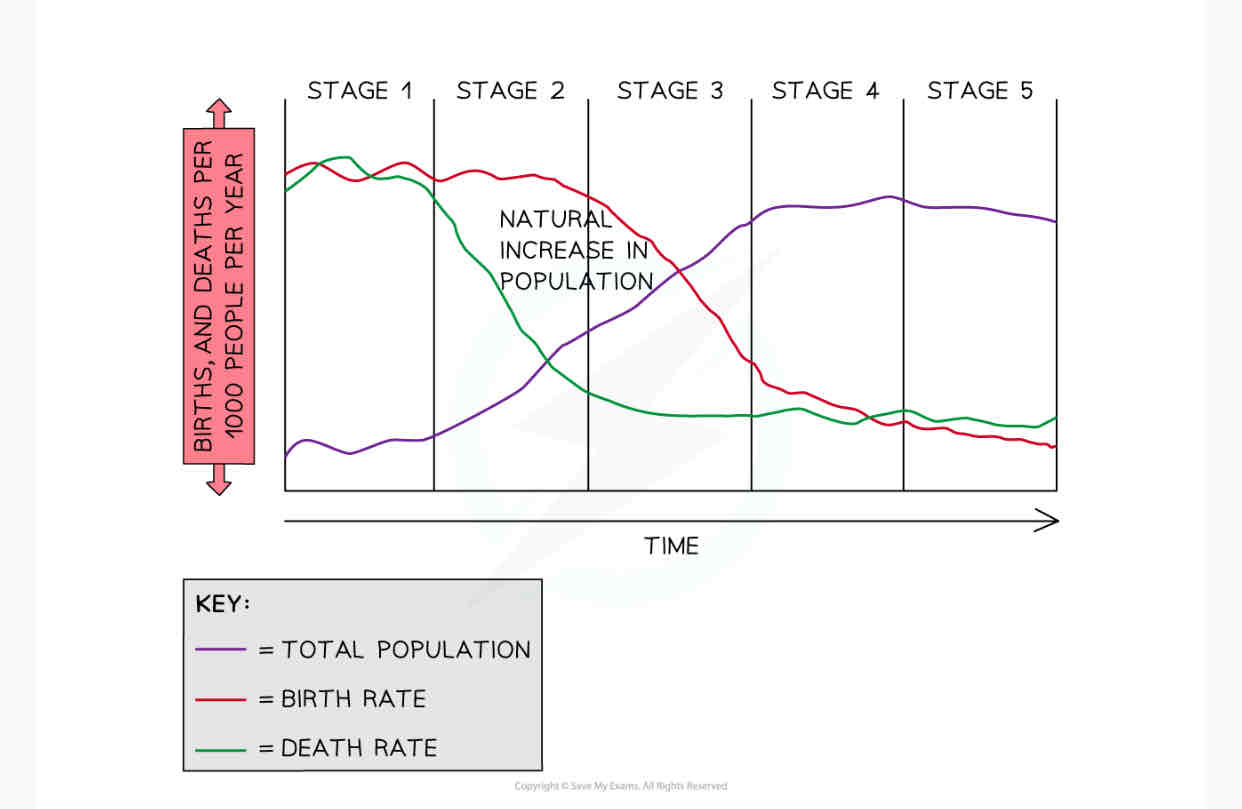
How is natural change in population calculated?
death rate-birth rate
How does a natural increase and natural decrease occur?
a decreasing death rate and high birth rate will lead to a natural increase
a low birth rate and an increasing death rate will lead to a natural decrease

What is the demographic transition model and what is it used for?
shows the 5 generalised stages of population change in a country as they develop
shows how birth/death rate changes over time and how it affects the country.

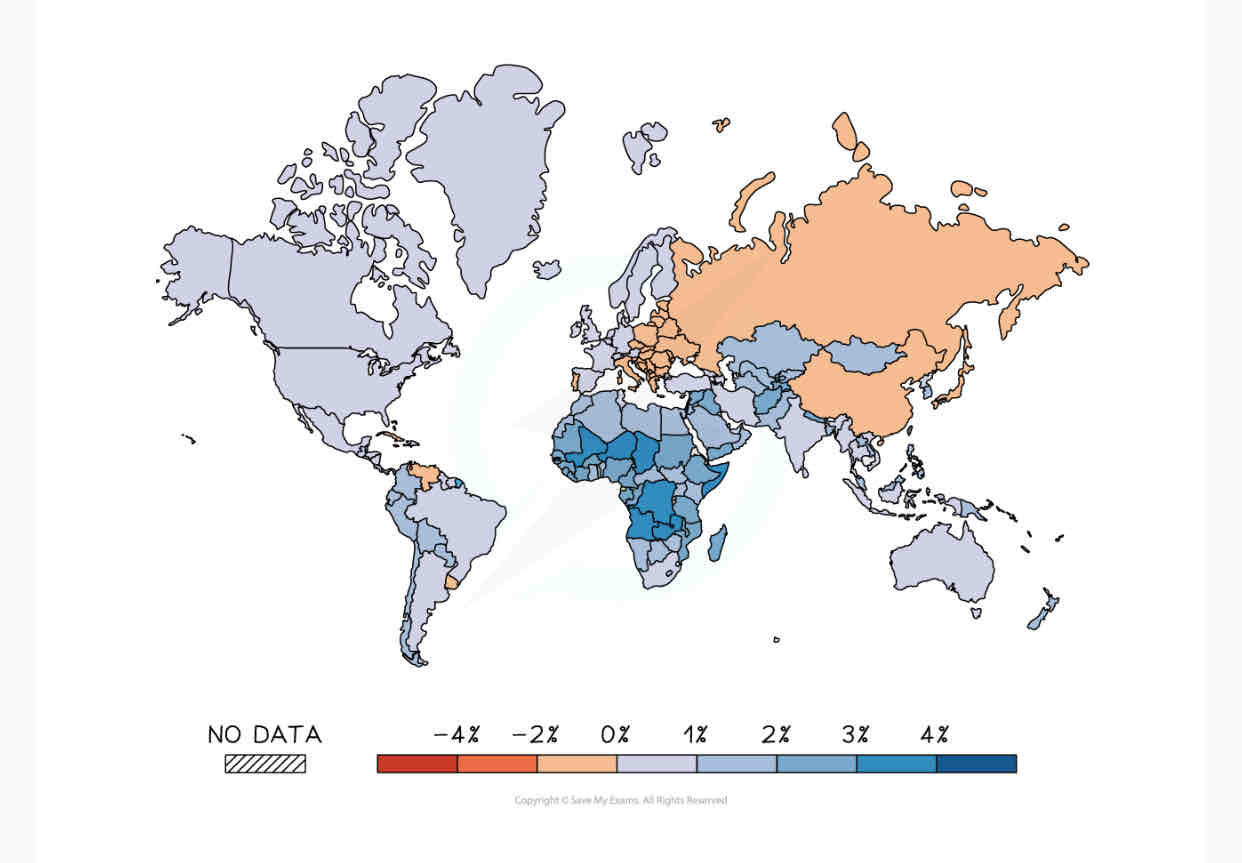
Describe the population changes in the world.
All countries have different rates of population change.
Population growth are highest in LEDCs like Niger, Mali and Zambia
Population growth in MEDCs such as Japan and Italy are decreasing as the number of deaths are higher than births.
What factors cause a change in the world’s population growth rates?
Fertility - average number of children a woman would have in her lifetime.
Mortality(death rate)
Migration
What factors are affecting the fertility rate for social reasons?
The infant mortality rate- women have more children to ensure some survive until adulthood.
Education- woman are in formal employment w high levels of education
Religion- can influence how many children a woman has
Healthcare- availability of contraceptives.
What factors are affecting the fertility rate for economic reasons?
Cost of having children- reduce the amount of children a woman has.
Lack of pensions- children need to care for elderly as there’s no pension
Contribution to family income- more children needed to work.
What factors are affecting the fertility rate for political reasons?
Pronatalist policies encourage women to hv children
Anti-natalist policies encourage women to hv less children
How is the death rate affected?
Quality of healthcare
Natural disasters
Diseases
War
Why does the death rate vary from country to country?
healthcare
food supply
diseases
vaccinations
education abt healthcare
Case study: Niger. Give an overview about it.
In 1960 the population of Niger was 3.3 million
By 2021 the population had reached nearly 25 million
A population growth rate of 3.8%
This is the combination of a high birth rate and a rapidly decreasing death rate
What are the reasons for the high birth rate in Niger?
The average age of marriage is 15.7 years meaning that women have more childbearing years
Low levels of education for women only 4 out of 10 girls finish primary school
High value is placed on large families
Only 12% of women use modern contraception
Why is the death rate in Niger decreasing?
The death rate in Niger is decreasing falling from 29 per 1000 (1960) to 8 per 1000 (2020)
The decreasing death rate has been the result of:
Increased urbanisation - which improves access to services such as healthcare and food
Better food and clean water supply
Improved access to healthcare
Government policies to improve farming practices which have increased food supplies
Free healthcare to pregnant women improving mother and baby survival rates
What are the impacts of Niger’s high natural population?
A highly dependent population of young people below the age of 15
Increased pressure on schools and health services
A younger population should increase economic growth but job and wealth distribution is uneven
Increased rural-urban migration to seek work
Development of illegal settlementson the edges of cities
Food shortages - an estimated 2.5 million people are suffering from food insecurity
How can the population growth be reduced in Niger?
In 2014 Niger adopted a framework to promote fertility reduction by:
Abolishing child marriage (marriage under the age of 18)
Improving access to education
Improved access to health services, contraception and family planning advice
Girls and women no longer need permission from parents/husbands to access contraception
Married and/or pregnant girls can still go to school to ensure they continue to receive an education
Case study: Japan. Give an overview about it.
In 2010 Japan's population reached 128.1 million people
In 2020 the population had decreased to 125.8 million people
Japan has a population change rate of -0.3%
This is a combination of a low birth rate and an ageing population
Why is Japan’s birth rate low?
Increasing numbers of women focussing on careers and delaying having children
Inability to afford buying/renting own home (70% of unmarried people live with their parents)
Declining marriage rate and increase in average age people get married (women 29.5 years, men 31 years)
Economic insecurity - jobs are not as secure
The expense of children is high due to childcare costs
How is Japan’s ageing population like?
The death rate has increased in Japan from a low of 6 per 1000 in 1982 to 11 per 1000 in 2020
In that time life expectancy has increased from an average of 77 years to 84.36 years
This means the increased death rate is not due to poorer healthcare, diet or standard of living but because the population is ageing
One-third of the population is over 60 years old and over 12% are over 75
Older people are more likely to become unwell and die
The more elderly the population, the higher the proportion of people who will die
What are some impacts of Japan’s low natural population?
Shortage of workers
Increasing numbers of the population being retired there are not enough workers to replace them
Fewer innovations
Closure of some services
Higher taxes
An ageing population puts more pressure on health service and pension payments
There is predicted to be a shortage of 380,000 workers for elderly care by 2025
Taxes have to be increased to pay for healthcare and pensions
School closures
Fewer children mean that schools and childcare facilities may close with the loss of jobs
An average of 450 schools close each year due to falling numbers
Economic stagnation
The economy does not grow due to a lack of workers and the closure of businesses and industry
The standard of living does not improve or falls
What are some solutions to do these impacts in Japan?
Development of robots to help with elderly care such as in the Shin-tomi nursing home in Tokyo
Immigration laws were revised in 2018 to attract foreign workers and help with the worker shortage
The aim is to attract 340,000 new workers
The Angel Plan was a five year plan in 1994 to increase the birth rate, followed by the New Angel Plan in 1999 and Plus One Policy in 2009 these all aimed to encourage people to have children by;
Improving the work environment to fit with family responsibilities
Better childcare services
Improved maternity and child health services
Better housing for families
Improved education facilities
Plus One Proposal is the most recent policy and aims to increase 'parent-friendly' working and the construction of 50,000 new daycare facilities
What is the aim of the Anti-natalist policies?
reduce pressure on resources
improve quality of life
reduce birth rate
What are the methods the Anti-natalist policy uses to reduce the birth rate
fines for having more than 1 child
Increased access to contraceptives
Better employment opportunities for ppl with only 1 child
promoting late marriage
abortion was legalised
What are the impacts of the Anti-Natalist policy?
Affecting the male/female ratio due to the preference of male children
over 30 million more men under 20 than women
decrease in population growth rate
What are the aims of the pro-natalist policies?
an ageing population increases healthcare costs.
a workforce shortage
reduced tax payments due to less ppl
What are some of the pro-natalist policies in the past?
Discount on public transport for family
Increased pay of maternity leave
Better mortgage deals
Tax allowance
Free childcare
What are some measures that have encouraged people to have larger families?
Increased maternity leave
Increased child benefits
Tax allowance
Baby bonus