Lec #5: Population Growth Part 2
 Call Kai
 Learn
Learn Practice Test
 Spaced Repetition
 Match
Match Flashcards
 Knowt Play
1/20

There's no tags or description
Looks like no tags are added yet.
Name | Mastery | Learn | Test | Matching | Spaced | Call with Kai | Chat |
|---|
No analytics yet
Send a link to your students to track their progress
21 Terms
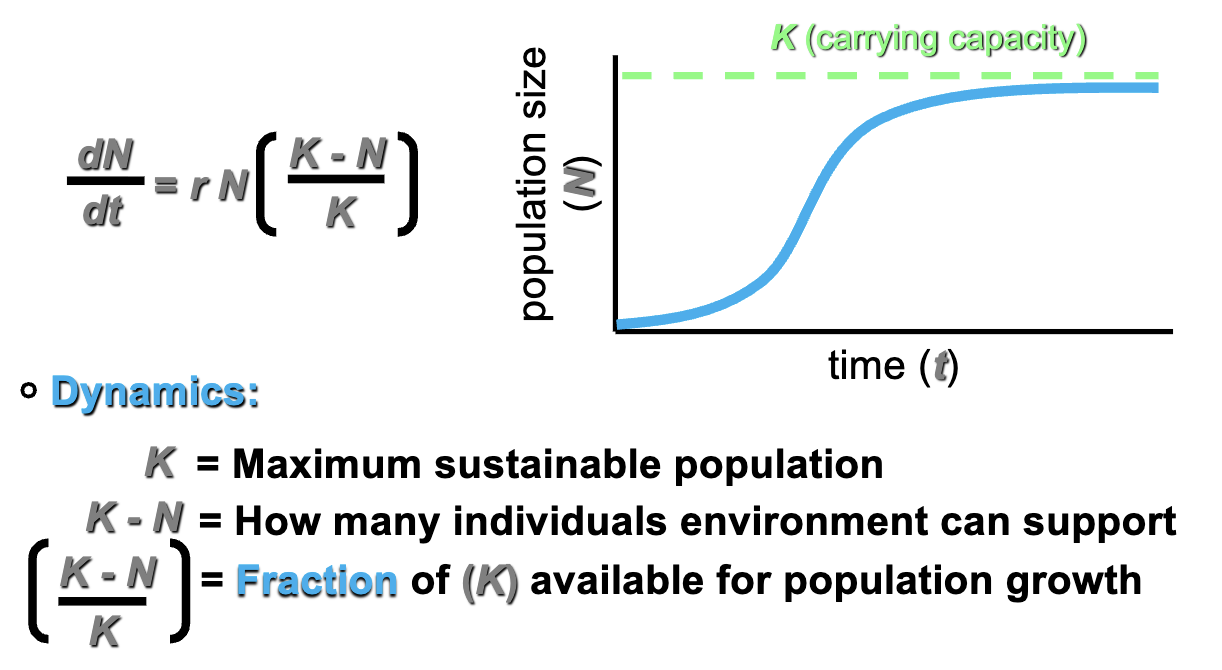
Logistic Growth
No natural populations can maintain exponential growth indefinitely
Population density typically fluctuates around a constant number of individuals (it is constant when extrapolated)
As population size increases resources become limiting for growth and reproduction
Modify the exponential growth model to incorporate changes in (r) as the population size grows toward (K)
When there is limited resources, the predictions are correct (environment is constant, no predators, no competition from other species)
K changes by birth and death, not migration
rN = when there is no competition; unlimited resources
At large values of (N), the value of (K-N / N) becomes small and the population growth is small
When population size is below (K) pop growth increases (available resources; biomass and reproductive output is high)
When population size is near (K) pop growth decreases
To check/validate this model, test in the natural environ
How well does the logistic model fit the growth of natural populations?
- Populations of very small organisms fit fairly well
- Many populations do not stabilize at (K) and deviate from sigmoid curves
So why does the logistic curve not fit well for most natural population growth patterns? (3 Assumptions)
Each individual added to the population has the same negative effect on population growth
Population approaches (K) smoothly
Populations are large, and density is important in regulation (boom and burst)
For the assumption that each individual added to the population has the same negative effect on population growth, what are some examples of exceptions?
- Chance events
- Isolated plants (savannah trees): has shade below (less evaporation and more water moisture in the soil/tree) and has a reproductive partner next to them
- Flamingos: won’t reproduce in captivity unless there are many of them (safety), so mirrors are used (easily fooled)
They cluster because they need water
Reproductive output is high, and they grow fast the more you add (intense density independence)
Algae blooms in lake, which is exponential in nature (unlimited resources)
Predators cant eat all the flamingos because there are too many (escape in numbers)
For the assumption that population approaches (K) smoothly, what are some examples of exceptions?
- Time lag (takes long) between the negative effect of population size increase and when they are realized
- Time lags cause population size to overshoot and undershoot (K)
- Populations may oscillate about (K), but is smooth when extrapolated (model prediction) (math predicts instantaneous change)
For the assumption that populations are large, and density is important in regulation (boom and burst), what are some examples of exceptions?
Insects, Microorganisms
- sensitive to environmental fluctuations
Carrying Capacity (K)
Def: The maximum population size that an environment can support
- (K) varies over space and time
- Crowding and resource limitation effects the population growth rate (r)
- Population growth slows as its density approaches (K)
Limiting factors
Any essential resource that is in short supply can limit population growth
Ex: space, light, nutrients, etc.
Density - Dependent Control
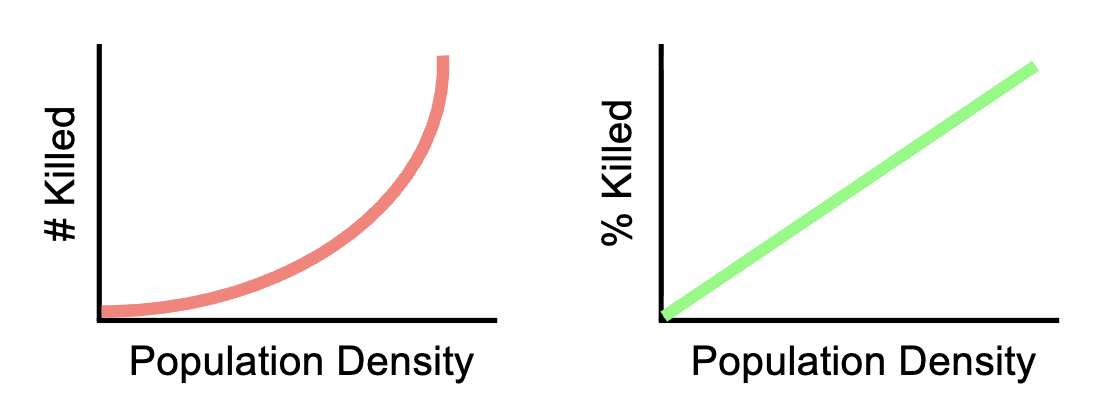
Factors that alter per capita birth or death rates in a population are dependent on population density (can stabilize population density)
More dense, more death
Ex: Predation, parasitism, competition, herbivory, and disease can be density-dependent
Graphing the % killed shows that for every 100, 1 dies
Density - Dependent Control Example: Bubonic Plague
- Blood pathogen, exists in rats, rabbits and other small mammals and transmitted by flea bites (fleas are pests with altered digestive tracts and never get full; their bites transfer the pathogen)
- 25 million deaths in European cities (25% of Europe)
- 1994 Indian Bubonic plague outbreak
- The greater the density of rats, fleas, and humans the higher the infection rate (passage of disease) and the higher the mortality
Density - Independent Control
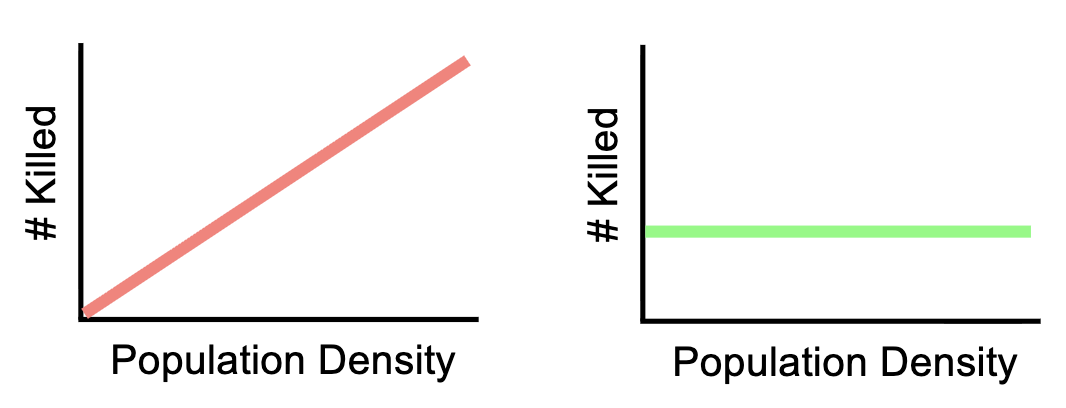
Factors that alter per capita birth or death rates in a population are independent of population density (do not stabilize population density)
Ex: Physical/chemical factors: weather, drought, freezes, flood and fire, etc.
% killed is constant because the death rate is independent of density
Density - Independent Control Example: Monarch Butterfly
- Migrate from Canada to Mexico
- Illegal logging removed temperature buffer for storms
- 2002 freezing storm killed over 200 million Monarchs (>80 % population mortality)
- The density of Monarchs had no impact on mortality rates; just had physiological lower limit temperature tolerance (no vegetation)
Natural Population Control and Regulation
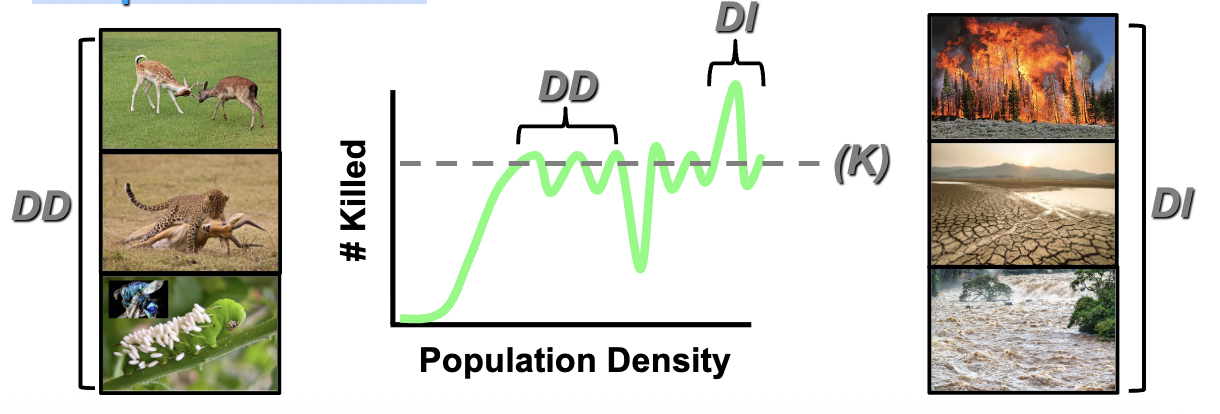
- A mix of density - dependent and density - independent factors
- Over long time scales many populations remain stable and close to (K) (Density - Dependent Control)
- Short term fluctuations in populations due to density - independent factors
Oscillating logistic curves
Stable and Unstable Populations
At equilibrium the population does not change unless disturbed
- Due to moderate rates of biotic interactions (natural forces): competition, predation, or herbivory
Stable Equilibrium (birth = death)
- If perturbed population will return to initial density
- Stabilizing forces dampen population fluctuations and return to line
- Density dependent control
- Over time, there will be a stable equilibrium
Ex: like a cone
Unstable Equilibrium
- If perturbed, population may not return to initial density
Unstable equilibriums can stabilize but at a different density
- Destabilizing forces enhance population fluctuations (not dampen)
- Inverse density dependence: the bigger the population, the smaller the impact of regulating force/effect, like flamingoes
- D-D with long time lags: elephants have a 2 year baby development, so the resources are different
Assumptions about birth/death rate models are that they are instantaneous (they eat and pop out a baby), but there is always a lag
Metapopulation:
Def: Population is divided into discrete sub-populations connected by immigration & emigration (Levins 1969)
Dynamics: Growth and reproduction within patches
- Migration between patches or colonization of empty patches
Big populations have more resistance to birth and decay
Little populations have a fast/high frequency and little resistance to change
Increasing Rates of Migration for Metapopulations
Differences between local pop fluctuations are dampened, there is synchrony, higher probability of extinction during the down part (disease) (no species persistence)
Shrinks differences between sub-populations and oscillate together
Decreasing Rates of Migration for Metapopulations
Differences between local pop fluctuations are enhanced, there is asynchrony, higher probability of extinction for the small population since there are more down parts (disease) (big populations can go extinct too)
If they don’t recolonize any open habitat
Intermediate Rates of Migration for Metapopulations
Shifting mosaic of occupied & unoccupied patches (species persistence), there is partial synchrony (sometimes together and apart) and repopulation
Populations slightly speed up and slow down
No extinction globally because they recolonize (maybe some extinction in the short term)
Metapopulation dynamics model
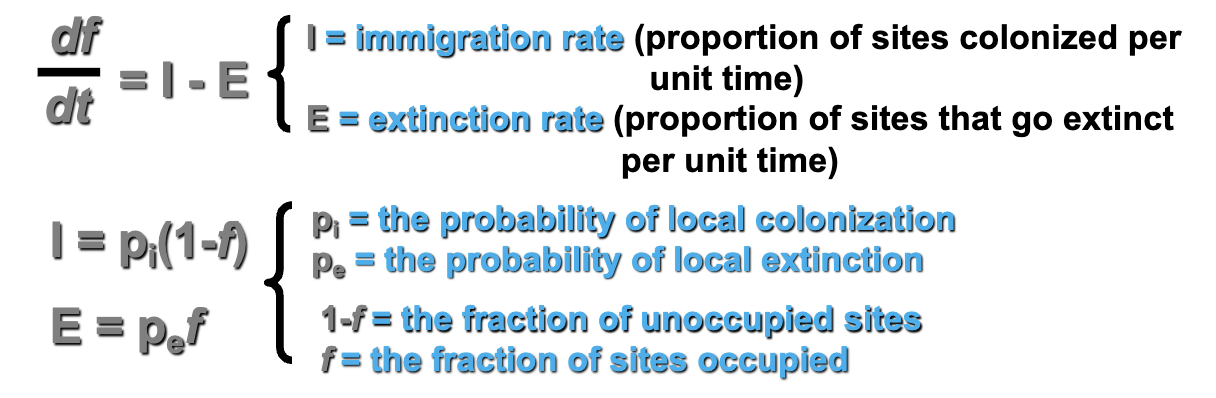
How does the fraction of occupied sites ( f ) change with time?
If f = 1 then all sites are occupied by populations
If f = 0 then sites are unoccupied, and populations are extinct
E is not emigration
If the immigration rate is high & the extinction rate is low the fraction of occupied sites will increase with time (I > E then f )
2. If the immigration rate is low & the extinction rate is high the fraction of occupied sites will decrease with time (I < E then f )
Can predict the increase and decrease pattern based on colonization and extinction
Metapopulation Example: Bay checker spot butterfly
- Larvae (caterpillar) feeds on specialized plants which grow on patches of serpentine soils (Metapopulation) (serpentine soil is what goldfield flowers grow on; sandstone soil surrounds it)
- Drought years most of the host plants die killing larvae (3 sub-populations became extinct)
- Largest sub-population (Morgan Hill) serves as source of new colonists
- Butterfly has recolonized formerly extinct patches of habitat
Species persistence over time with intermediate migration (small population went extinct first); E<I
If the species did no migrate during a drought, there would be extinction as the little population goes extinct first and there is no recolonization