Random Variables
1/20
There's no tags or description
Looks like no tags are added yet.
Name | Mastery | Learn | Test | Matching | Spaced |
|---|
No study sessions yet.
21 Terms
Random Variable
A variable whose numerical value is based on the outcome of a random event; denoted with a capital letter w/ a lowercase letter for the corresponding values
A random variable is “discrete” when..
we can list all of the outcomes, ifi we can’t then it’s “continuous”
Probability Model of a Random Variable
The collection of all possible values and probabilities that they occur
Expected Value (E(X)/𝝁)
The value calculated based on a probability model and LLN; the mean of a random variable
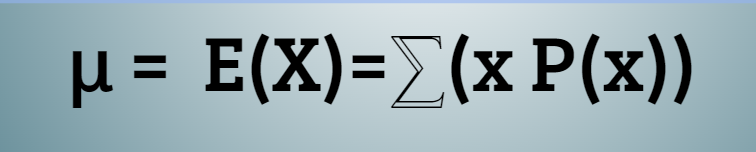
Expected Value Formula
𝝁= E(X) = ⅀(X(P(X))
Variance
expected value of squared deviations of the values, found by multiplying each by the appropriate probability and sum those products
Standard Deviation
Square root of the variance
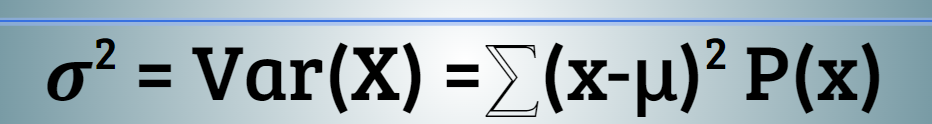
Variance Formula
𝝈2 = Var(X) =⅀(x-μ)2 P(x)
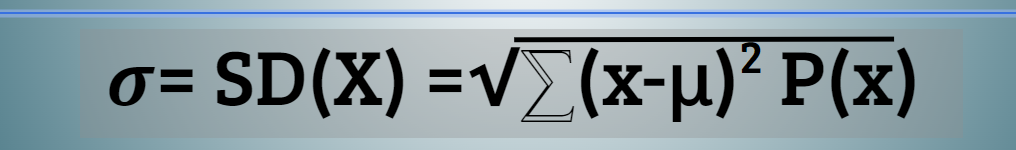
Standard Deviation Formula
𝝈= SD(X) =√⅀(x-μ)2 P(x)
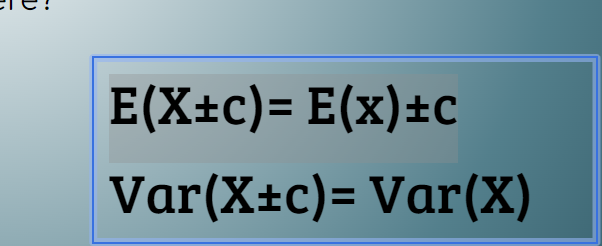
Formulas for adding a constant to the Mean and Variance
E(X±c)= E(x)±c
Variance: Var(X±c)= Var(X)
Adding a Constant..
Shifts the mean up by that constant but doesn’t change the spread
Rescaling (multiplying by a constant)..
Multiplies both the mean and spread by that constant
Formulas of Mean and Variance for Rescaling
Mean: E(aX)=aE(x)
Var(aX)=a2 Var(X) [b/c SD is square root of variance]
![<p>Mean: <span>E(aX)=aE(x)</span></p><p><span>Var(aX)=a<sup>2</sup> Var(X) [b/c SD is square root of variance]</span></p>](https://knowt-user-attachments.s3.amazonaws.com/6b9203fb-4edc-437e-889e-591a0a0ec4e5.png)
The mean of the sum/ difference of 2 random variables is the sum/difference of the means formula
E(X±Y)= E(X)±E(Y)
Pythagorean Theorem of Statistics
We always add variances because the variability in the differences increases just as much as the variability in the sums (If the random variables are independent, the variance of their sum OR difference is always the sum of the variances)
Pythagorean CTheorem of Statistics Formula
Var(X±Y)= Var(X)+Var(Y)

Continuous Random Variable
can take on any value, but not every value will have a probability; everything that applies to discrete random variables is also applicable for them too
For a normal random variable..
The probability that it falls within an interval is just the area under the normal curve over that interval
Regardless of shape (Normal, skewed, uniform, or bimodal) all continuous random variables have..
means (expected values) and variances
When 2 INDEPENDENT continuous random variables have Normal models.
So does their sum or differences (allows us to apply Normal Model probabilities to random variables)
What can go wrong?
Make sure that probability models and using normal distribution is reasonable
Watch out for variables that arent independent
Always add variances even when looking for differences
Write random variables separately