Looks like no one added any tags here yet for you.
Discrete random variables must be…
Random: outcome of chance operation
Mutually exclusive: one outcome per run
Independent
Three different ways to visualize discrete probabilities
Probability function: only if all probabilities are equal (mathematical relationship) NOT ALWAYS POSSIBLE
Probability histogram: graph with values on x-axis and their respective probabilities on y-axis
Probability distribution: table with each value (x) and its respective probability p(x)
Sum of all probabilities must equal
one
Equation for the mean of a discrete random variable
∑ x * P(x)
Equation for the standard deviation of a discrete random variable
σ² = ∑ [ (x-μ)²* P(x) ]
What is the mean?
It is our best guess of what the outcome of a single experiment would be (explains the name of expected value)!
All binomial variables are discrete BUT…
not all discrete variables are bionomial
Binomial probability is based on…
a series of repeated trials (success vs. failure)
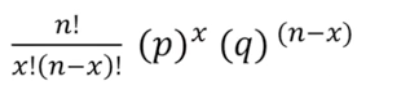
Binomial probability equation
# of sorts * probability it happens once
n = number of trials
x = number of success
n-x = number of failures
p = probability of success
q = probability fo failure
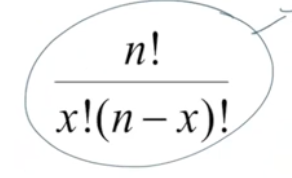
What is the binomial coefficient?
Calculates the number of unique sorts/ways
How to calculate the probability of x or more?
P(x of total) + P(x+1 of total) …. + P(total of total)
Binomial shortcut for mean and standard deviation?
μ = np
σ = sqrt(npq)
You just need to know n and p!
What are rare events?
Any event with a probability that is less than 5%.
If p = 0.5 (and q=0.5), the shape of the graph will always be roughly (regardless of n)….
symmetric, unimodal
If p is close to 0 or 1, the shape of the graph….
goes from J-shaped → skewed → eventually unimodal and symmetric as n increases