Market Equilibrium & Price Discovery
1/21
There's no tags or description
Looks like no tags are added yet.
Name | Mastery | Learn | Test | Matching | Spaced | Call with Kai |
|---|
No analytics yet
Send a link to your students to track their progress
22 Terms
Demand Schedule
At any price how much a consumer is willing to spend. The lower the price the higher the demand.
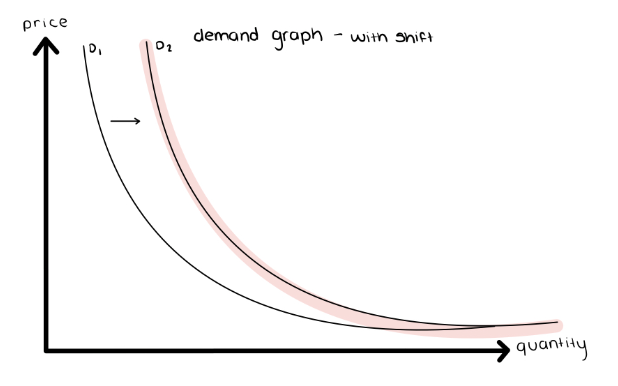
Shift in the Demand Curve - Definition
A change in the quantity demanded at every given price, denoted by a new demand curve.
Leftward Shift - Decrease in Demand
Rightward Shift - Increase in Demand
Causes of a Shift in the Demand Curve
Always external factors:
Substitutes: Coke and Pepsi. The price of Coke is decreasing, increasing its demand, therefore the demand for Pepsi decreases.
Complements: Coffee and Sugar. The price of Coffee is decreasing, increasing its demand, therefore the demand for Sugar increases.
Changes in Income:
Normal Goods: As Income increases so does the demand for normal goods.
Inferior Goods: As Income increases the demand for inferior goods decreases.
Margarine (IG) is replaced by Butter (NG)
Changes in Taste
Changes in Demographics
Changes in Expectations
Movement along the Demand Curve - Definition
Change in the quantity demanded of good as a result of a change in that good’s price.
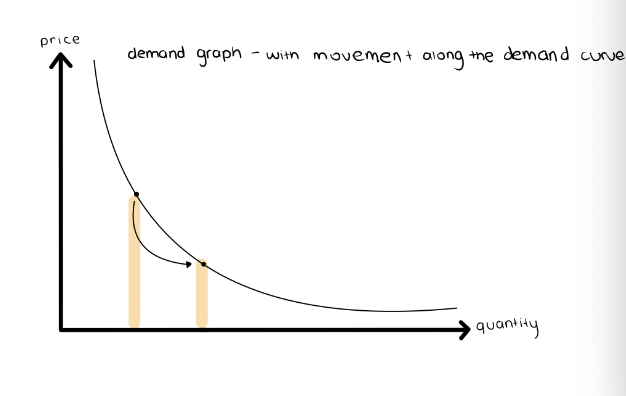
Movement along the Demand Curve - Cause
Always internal decisions
Change in Price
Supply Schedule
How much of a good or service would be supplied at different prices. As the price rises, the quantity supplied rises.
Shift in the Supply Curve - Definition
A change in the quantity supplied at any given price, represented by a new supply curve.
Leftward Shift - Decrease in Supply
Rightward Shift - Increase in Supply
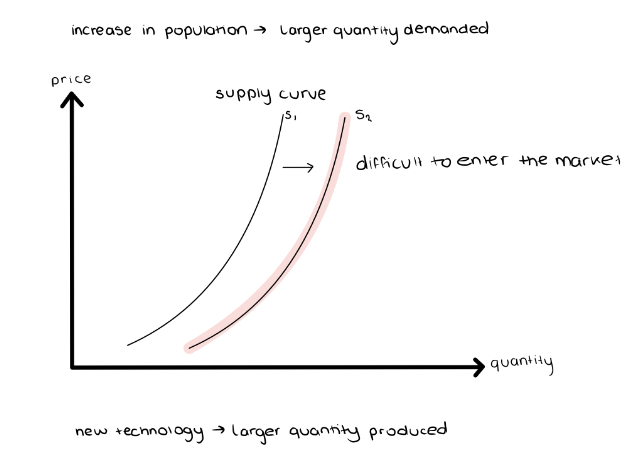
Shift in the Supply Curve - Causes
Always External
Changes in Input Price
Changes in the Price of related Goods and services in co-production
Changes in technology
Changes in expectations
Changes in the quantity of producers
Natural Disasters
Movement along the Supply Curve
Is a change in the quantity supplied of that good as a result of a change in that good’s price.
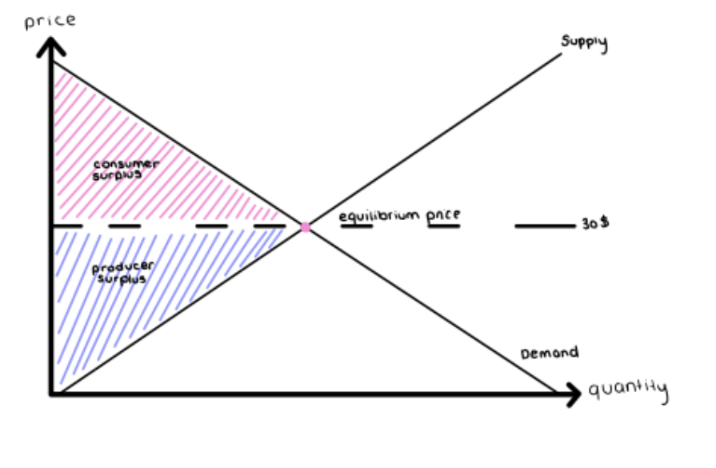
Equilibrium Definition
Equilibrium in a competitive market is when the quantity demanded of a good equals the quantity supplied of that good.
Equilibrium Price
Price at which quantity demanded equals quantity supplied
Every buyer finds a seller and vice versa
Quantity bought and sold at that price is the equilibrium quantity
Surplus
Supply > Demand
Prices above the equilibrium
Shortage
Demand > Supply
Prices below the equilibrium
Consumer Surplus Definition
A consumer’s willingness to pay for a good or service is the maximum price at which they would purchase.
Individual Consumer Surplus
Net gain to an individual buyer from the purchase of that good or service.
ICS = Willingness to Pay - Price Paid
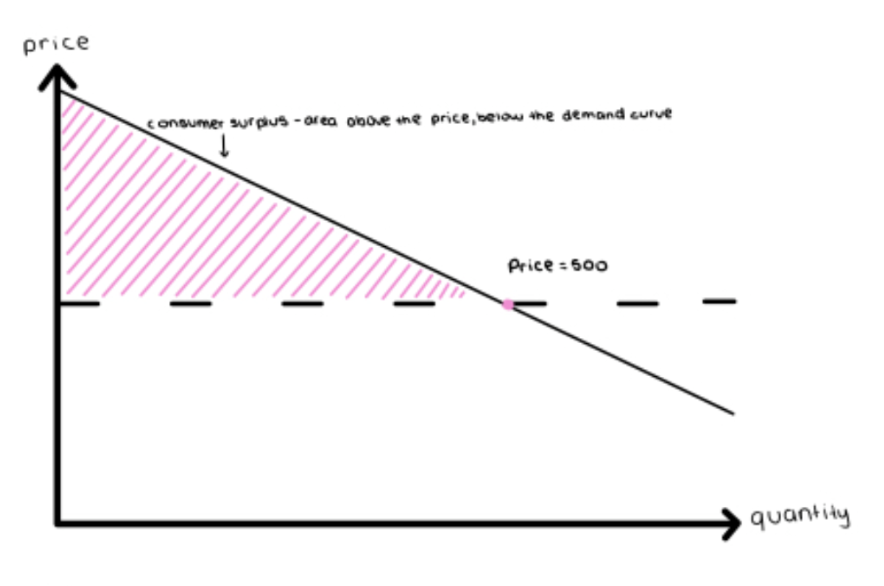
Total Consumer Surplus
Sum of all the individual consumer surpluses for a particular good. A fall in the price of a good increases consumer surplus:
A gain to consumers who would have purchased at the original price
A gain to consumers who are persuaded to buy by the lower price.

Potential Seller’s Cost
Lowest cost at which sellers are willing to sell
Individual producer surplus
Net gain to a seller from selling a good.
IPS = Price received - Sellers Cost

Total Surplus
Total surplus generated in a market is the total net gain to consumers and producers from trading in the market. Sum of the consumer and producer surplus.
Price Ceiling
Maximum price sellers are allowed to charge for a good or service. Imposed during crisis like Covid 19.
Causes deadweight loss —> limiting market efficiency
Price Floor
Minimum price buyers are required to pay for a good or service. Pushes market prices up instead of down.
Causes deadweight loss —> limiting market efficiency
How are Price Floors and Ceilings Binding
Price Floor - binding if set above equilibrium price
Price ceiling - binding if set below equilibrium price