Kines 501 Exam 1
1/82
There's no tags or description
Looks like no tags are added yet.
Name | Mastery | Learn | Test | Matching | Spaced |
|---|
No study sessions yet.
83 Terms
Ecological perspective
the interaction between, and interdependence of, factors within and across all levels of a health problem. It highlights people's interactions with their physical and sociocultural environments. The relationship between living things and their environment
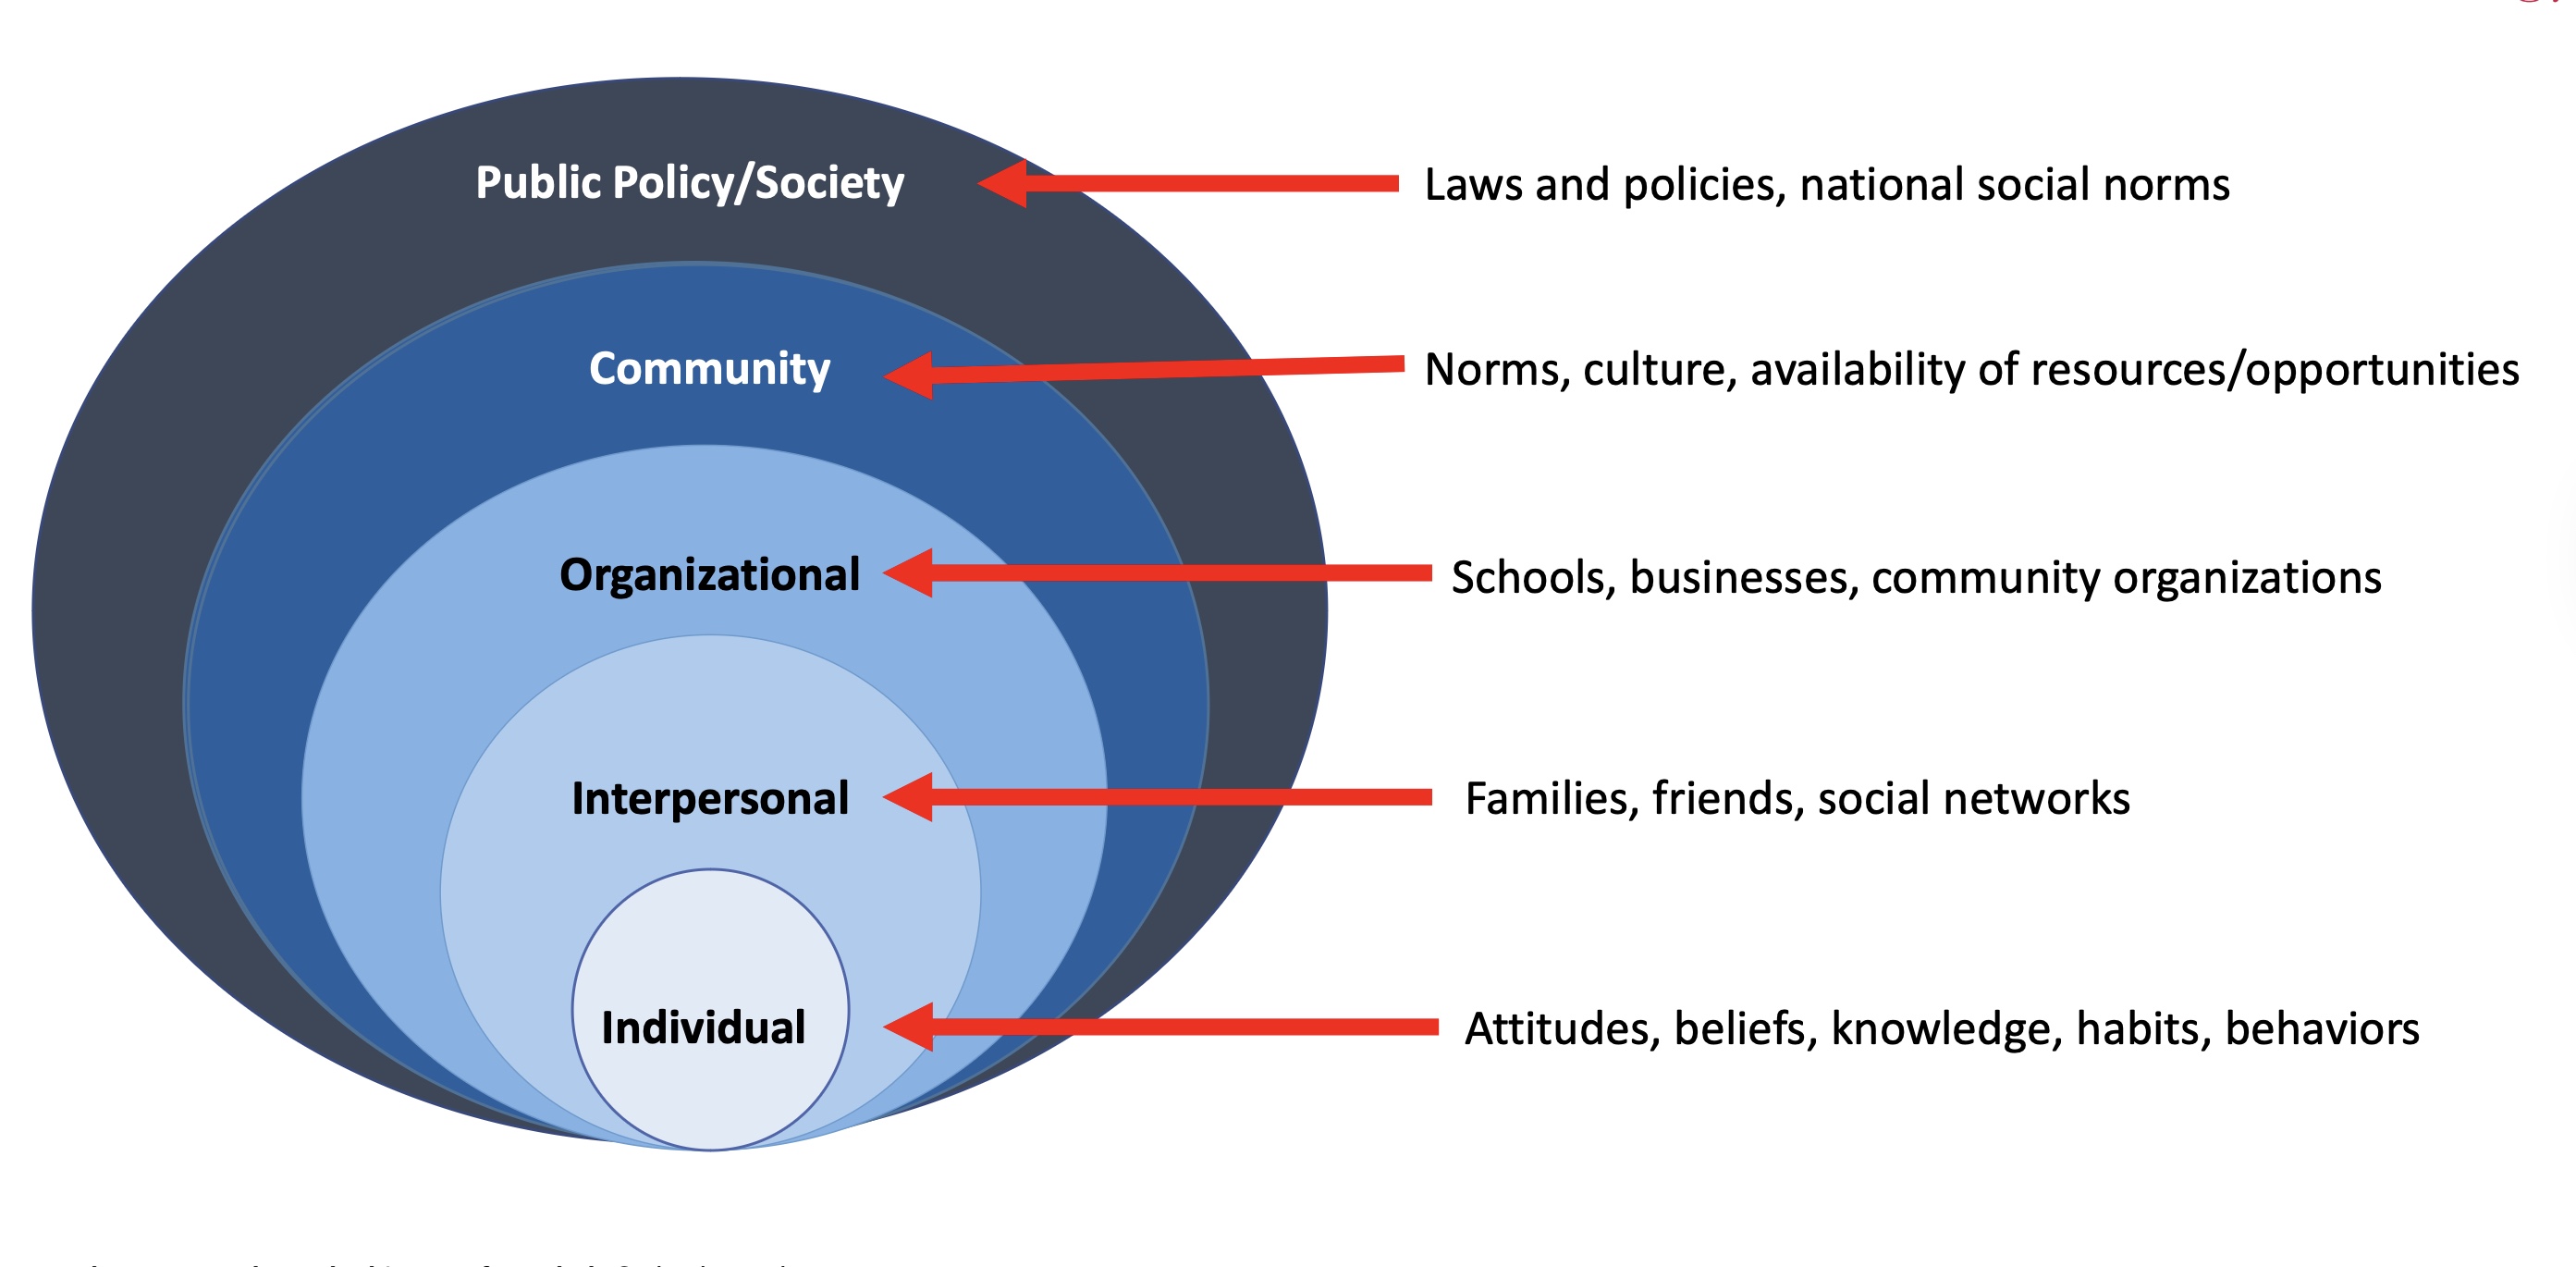
Social ecological model update
health promotion should focus not only on intrapersonal behavioral factors but also on the multiple-level factors that influence the specific behavior in question. (individual, interpersonal, organizational, community, public policy)
Health equity
The state in which everyone has the opportunity to attain full health potential and no one is disadvantaged from achieving this potential because of social position or any other socially defined circumstance
Attainment of the highest level of health for all people
Health disparities
A particular type of health difference that is closely linked with social, economic, and/or environmental disadvantage.
Example: racial or ethnic group, religion, SES, gender, age, mental health, etc
Health inequities
are differences in health outcomes of a population or group that are systemic, avoidable, unfair or unjust. (not just the difference in health outcome, its based on the systemic difference)
Social determinants of health
The conditions in which people are born, grow, live, work, and age, are shaped by the distribution of money, power, and resources at global, national, and local levels
Examples: Healthcare access and quality• Education access and quality• Social and community context• Economic stability• Neighborhood and built environment
Healthy People 2030
US program that sets health goals and measures changes in health
Goals: eliminate health disparities, attain healthy lives
Priorities: SDoH, mental health, health inequities,
Epidemiology
Definition: the study of distribution and determinants of health-related states among specified populations and the application of that study to the control of health problems
Purpose: study past or current trends in health status or level of disease• Identify causes of death• Define risk factors and determinants of disease• Determine need for health services• Identify feasible disease-prevention and health promotion strategies• Predict future disease outbreaks
Prevalence
number of new and old cases in a given period of time, divided by the total number in that population
•Useful in the study of chronic disease - diseases that usually last three months or longer
Incidence
number of new health-related events or cases of a disease, divided by population at risk
•Important in the study of acute diseases - diseases in which the peak severity of symptoms occurs and subsides within days or weeks
Mortality
the state of being subject to death
Morbidity
illness or disease
Life expectancy
average number of years a person is expected to live based on current mortality rates
Cross-Sectional Study (prevalence study)
A one-time data collection effort that often uses a self-report format. Using this type of study, you can find a correlation between two statistics; however, you cannot assume causation.
Time is fixed; assessments made at single time point
Longitudinal study design (Cohort study)
A cohort of healthy people is followed through time to see if they develop a specific disease of interest.
Assess cohort over time, assessment made at multiple points
Primary Data Source
The active process of collecting specific information through research. Primary data provides accurate, community-specific data about the problem and potential solutions.
Examples: Observational study designs• Cross-sectional studies• Cohort studies• Case-control studies• Experimental designs
Secondary Data Source
Using information that has already been collected by national, state, orlocal sources.• Secondary data helps you determine how your community compares to other communities who face similar issues.
Examples: • Disease registries• Population surveys• Census• Vital statistics
Food desert
geographic areas where residents' access to affordable, healthy food options (especially fresh fruits and vegetables) is restricted or nonexistent due to the absence of grocery stores within convenient traveling distance.
Food insecurity
when people don't have enough to eat and don't know where their next meal will come from
4 key steps to achieve health equity
1. Identify important health disparities
2. Change and implement policies, laws, systems, environments, and practices to reduce inequities in the opportunities and resources needed to be as healthy as possible
3. Evaluate and monitor efforts using short- and long-term measures
4. Reassess strategies in light of process and outcomes and plan next steps
Predisposing factors
the conditions and activities that can lead to the development of disease within a living organism
Ex: genetics, life events, or temperament
Reinforcing factors
the positive or negative influences or feedback from others that encourage or discourage health-related behaviour change
Ex: social influences from family, peers, teachers or employers.
Enabling factors
forces that facilitate or impede individual, collective, or environmental change based on their level of availability
Ex: income, insurance coverage, access to services, and community characteristics such as availability of resources and region of the country
Womb to tomb
prebirth to death relating to health outcomes and risk factors
Key principles of the Belmont Report
Respect for Persons, Beneficence, and Justice—and their specific applications (Informed Consent, Assessment of Risks and Benefits, and Selection of Subjects)
Community capacity
the interaction of human, organizational, and social capital existing within a given community that can be leveraged to solve collective problems and improve or maintain the well-being of a given community.
Social capital
the networks of relationships among people who live and work in a particular society, enabling that society to function effectively
Cultural Competence
the ability to interact effectively with people of different cultures
i.e:the ability of an individual to understand and respect values, attitudes, beliefs, and mores that differ across cultures, and to consider and respond appropriately to these differences in planning, implementing, and evaluating health education and promotion programs and interventions
Cultural Humility
involves an ongoing process of self-exploration and self-critique combined with a willingness to learn from others. It means entering a relationship with another person with the intention of honoring their beliefs, customs, and values.
Theory
Evidence based explanation that explains why or how something works
Tells us
Who: is impacted by this issue
What: you need to know before developing an intervention and how to measure it
Why: people arent folllwing this intervention
How: can we get people to follow a health intervention
Health
Lots of definitions, multidimensional, dynamic
1) absence of disease
2) able to cope with daily life
Health promotion
Health education + environmental actions to support healthy living (laws, support, organizations)
Determinants of health
Conditions where people can be healthy
1) Biology/genes
2) SES factors
3) Environment
4) Health behaviors
5) Health care
Socioecological Model + example for each level
Shift from infectious diseases to chronic diseases (1900-1960)
Growth of healthcare facilities and healthcare
Social security
Hill Burton Act 1946
Penicillin
Reform phase
Shift from infectious diseases to chronic diseases (1960-1973) Social Engineering period
Medicare and Medicaid established
Federal government has increased role in healthcare
Shift from infectious diseases to chronic diseases (1974-Present)
Prevention methods
Healthy people project
Healthism - you are in charge of your own health
Linking premature death to lifestyle and health behaviors
Health disparities
Systemic differences in health outcomes between demographics
Stem from inequalities in the social determinants of health
Persist over time
Perventable
5 principles of ecological model
Multiple levels
interaction across levels
Environment determines behavior
Behavior-specific
Multi-level intervention most effective
Ecological model definition
An approach to study design/interventions
Ecological model strengths and weaknesses
Strengths: affects large number of people, effective, combine with other theories
Weaknesses: expensive, not applicable across health behaviors, lack of specificity, difficult to make, some SDoH can’t be changed
Etiology
Cause of disease
Epidemiologists
Study the determine the determinants of health in a population
Apply it to prevention, control, and treatment
Risk factor
Something that increases the likelihood of disease, illness, health problem
Protective factor
Something that reduces the risk of disease, illness, health condition, OR REDUCES THEIR SEVERITY
Outbreak
Unusually high amount of cases
common cause
in a specific area
Health indicators
Measurement of health (DALYs, HALE, prevalence, incidence, etc.)
Crude rate vs Adjusted rate
Crude rate= total number of cases in a population
Adjusted rate= number of cases in a population per capita (essentially they adjust for confounding factors)
YPLL
Years of potential life lost: the number of years lost when death occurs before one’s life expectancy
DALYs
Disability-adjusted life years: measure of disease burden,
calculated as sum of years of life lost (YPLL) and years lived with disability
HALE
Health-adjusted life expectancy - average number of years of
healthy life can expect in a specific population or region
Life expectancy
The average age a person in a given area can expect to live (at a given timeperiod)
Infant/maternal mortality
# infants/mothers in a population who die in specified timeframe per 1000 live births
Analytic study
Experimental, observational, other type of survey that seeks to establish a cause and effect
trying to find something new
Descriptive study
Characterize a health issue: severity, distribution, where, who, etc.
Exploring a current health issue
What is needed for causality
Strong
Temporality
Plausibility
Replicable
Specific
Primary data
You are creating new data (experiments, interviews, surveys, etc.)
Secondary data
Data that has already been obtained (institution, census, publications, etc.)
Criteria used to judge importance of disease to community health
# of people who will die from a disease
# of years of potential life lost (YPLL)
Economic costs spent at various levels ol and other drugs
Primary level of prevention
Occurs before exposure to illness
Active: Individual behavioral changes Ex: exercise, seatbelts, handwashing
Passive: Doesn’t require a behavior change Ex: water fluoridation, public smoking bans, sanitation
Secondary level of prevention
Individual: slow disease progression Ex: appointments, treatment, testing
Community: limit the spread and reduce harm Ex: surveilance, treatment, quarantining, disinfection
Tertiary level of prevention
Individuals – rehabilitation from an established condition or disease
Ex: alcohol/drug rehab, physical/occupational therapy, dentures, cardiac rehab
Communities – emergency preparedness
Ex: medical personnel availability, training, services, systems
Structural inequities
Mechanisms that organize the distribution of power and resources
Race vs ethnicity
Race- social construct, based on physical appearance
Ethnicity- self identity, historical group that shares common traditions, language, heritage, etc.
Why do we use theories?
Theories help explain why people do what they do and suggest ways to change what they do (e.g., to improve health)
Simple: theories help us understand human behavior
What is the role of knowledge in behavioral change
Knowledge is a pre-req for behavioral change
But, knowledge alone is NOT enough to change behavior
What are the 3 vital components of a theory
Concepts
Constructs
Variables
What is a construct in a theory
Is how we apply the concept
Theory vs Conceptual model
A theory is more general, where a conceptual model is a lot more specific
What are the 5 steps in choosing a theory
1. Identify the health issue and the intervention population.
2. Gather information about the health issue.
3. Identify possible causes for the health issue.
4. Identify the level of interaction for the possible causes of the issue.
5. Identify the theory that best matches the level and causes.
Antecedent variable
background factors that
precede expected relationships
Mediating variable
variables that come between predictor and outcome variables
Modifying variable
the relationship between
the predictor and outcome is influenced
by a third variable
Social networks (structure)
• How and to what extent people are connected to others
• Social support is provided through these structures
Social support (function)
• Functions provided or perceived to be available by social relationships
• Measures: actual and perceived support, aid, resources
Major components of social networks (3)
Degree of integration in social networks
• Structural
Social interactions that are intended to be supportive
• Functional
Beliefs and perceptions of support availability held by individuals
• Functional
3 Pathways linking Social Support to Health
1. Stress prevention pathway
• Social support prevents stress
2. Stress buffering pathway
• Social support diminishes the negative health effects of stress
3. Direct effect pathway
• Health-enhancing influence of social support
Stress prevention
Part of the social support and social network theory
Social support may decrease exposure to negative life events and certain
stressors; may decrease the association between stress and health outcomes
Stress buffering
Part of the social support and social network theory
• Social support “buffers” an individual from the negative effects of stressful
experiences
• Proposes that social support decreases the association between stressful
events or perceived stress and health behaviors or physical health
outcomes
Direct effect of social support
Social support is effective regardless of stress levels
Perceived support is directly related to beneficial influences on biological health
• Relational regulation theory: accounts for direct effects of social support on
mental health outcomes
• Everyday interactions between individuals provide positive outcomes
• Higher likelihood of health promoting behaviors
Effect of social support on mortality
• Low social integration predicts higher age-adjusted mortality risk
• Individuals with greater social connections have 50% greater likelihood of survival
compared to those in low social connections (Holt-Lunstad, Smith, & Layton, 2010 )
• Perceived support appears to be a more important predictor of lower
mortality than received support
Homophily
principle of the social support and social networks theory
we tend to associate with people similar to us
Networks with high levels of homophily tend to be more resistant to change
Structural or network properties
Transitivity
• Friends of friends become friends
• Dense pockets of interconnectedness accelerates behavior
change within clusters and slows it between clusters
Centralization
• Extent that ties are focused around one or a few nodes
• Central hubs can coordinate activities for the network; may be
less sustainable than less-centralized hubs
Density
• Number of links in the network
• Too much density can hinder network performance