Statistics: Histograms, Stemplots, Outliers, and Percentiles
1/40
There's no tags or description
Looks like no tags are added yet.
Name | Mastery | Learn | Test | Matching | Spaced | Call with Kai |
|---|
No analytics yet
Send a link to your students to track their progress
41 Terms
What is the purpose of 'bins' in a histogram?
even intervals that capture data for visualization.
How do you calculate the bin width for a histogram?
calculated as the highest value minus the lowest value divided by the number of bins.
What is a stemplot?
a method of illustrating data where the stem represents the first digits and the leaf represents the last digit of the data points.
Why is it important to add a key to a stemplot?
is necessary to clarify how to interpret the stems and leaves in the plot.
What is cumulative relative frequency?
is the total of relative frequencies up to a certain point, often used to display percentiles.
What is an outlier in a data set?
an individual piece of data that falls outside the overall pattern of the distribution.
What are two common methods for identifying outliers?
Method A uses the 1.5 × IQR rule, while Method B uses the standard deviation rule (mean ± 2SD).
What is the formula for calculating the mean of a sample?
The mean is calculated as X = Σx / n, where Σx is the sum of all observations and n is the number of observations.
What distinguishes categorical variables from quantitative variables?
Categorical variables represent specific groups, while quantitative variables are numerical and can be measured.
What are the two types of quantitative variables?
can be discrete (e.g., number of siblings) or continuous (e.g., height, weight).
What is the purpose of a boxplot?
visually summarizes the distribution of a data set, highlighting the median, quartiles, and potential outliers.
How do you describe the center of a distribution?
can be described using the mean or median, depending on the distribution's skewness and presence of outliers.
What does a percentile indicate?
indicates the value below which a certain percentage of observations fall.
What is the 50th percentile in a normal distribution?
is the median, meaning 50% of the data is above it and 50% is below it.
What is the significance of a 'sideways histogram'?
a variation of a stemplot that displays data in a horizontal format.
What is the role of the median in skewed distributions?
the median is preferred for measuring center because it is less affected by extreme values.
What is the difference between relative frequency and frequency?
Frequency counts how often a value occurs, while relative frequency is the count divided by the total number of observations.
How should you summarize findings after creating a graph?
describing the shape, center, and spread of the distribution.
What is the impact of extreme values on the mean?
can skew the mean, making it an unreliable measure of center in such cases.
What is the two standard deviation rule for identifying outliers?
identifies outliers as any data points that fall outside the range of mean ± 2SD.
What is a back-to-back stemplot?
displays two sets of data side by side, allowing for easy comparison between categories.
What does it mean for a distribution to be symmetric?
has a balanced shape, where the left and right sides are mirror images.
How do you determine if a variable is discrete or continuous?
It depends on how the data is used; for example, age is often treated as discrete even though it can be continuous.
What is the importance of labeling boundaries in a histogram?
helps clarify the intervals represented by each bin in the histogram.
What is the purpose of a lifeline in a histogram?
indicates the minimum x-value before the first bin, providing a reference point for the data.
What is the standard deviation equation?
sx= √[Σ(x - x̄)² / (n - 1)].
How do you compare distributions?
Use phrases like “is higher than” or “is less than”
1/5 * IQR rule
LB= Q1-1.5(IQR)
UB=Q3 + 1.5(IQR)
Anything below LB, or anything above UB is considered an outlier
two standard deviation rule
LB= mean - 2(SD)
UB= mean + 2(SD)
The next whole number below LB, or above UB, is an outlier
bin width formula
range - sqrt of data values = bin width
ex: 20 / 5 = 4
nonresistant
strongly influenced by extreme values
resistant
if there are extreme values in a data set, the measure of center will not be as affected by it.
Skewed distribution center/spread
use mean for center and IQR for variability (spread)
Symmetric distribution center/spread
use median for center and SD for spread
What is a percentile?
indicates the value below which a given percentage of observations in a group of observations falls.
What does the 70th percentile mean?
A test score in the 70th percentile would mean that 70% of the scores in the data set were below that score.
How to describe a distribution’s shape
skewed, symmetric, bimodal, unimodal
how to describe center
mean/median
how to describe spread
range, sd, iqr
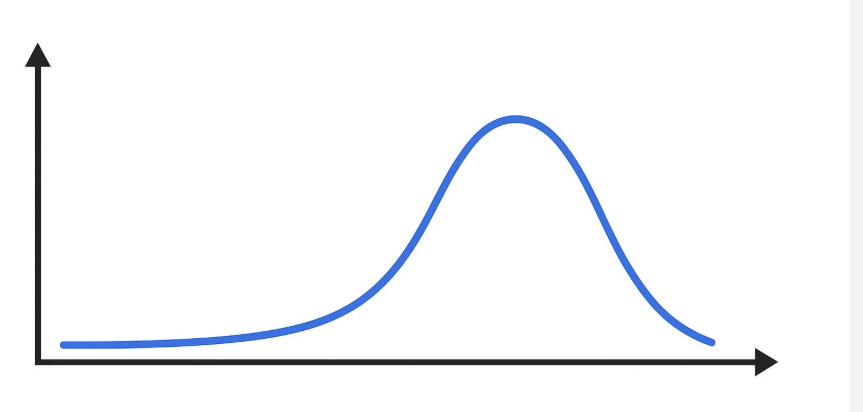
left skewed distribution
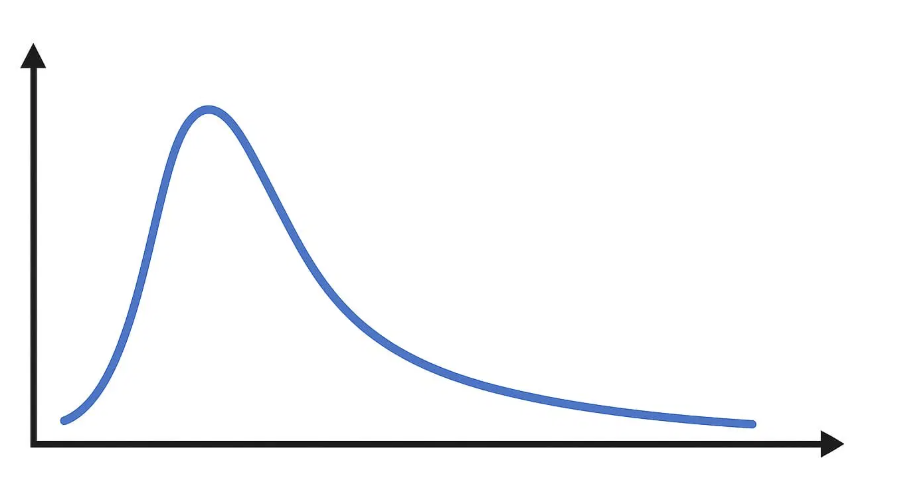
right skewed distribution