The Firm (Costs of production) (2.3)
1/44
There's no tags or description
Looks like no tags are added yet.
Name | Mastery | Learn | Test | Matching | Spaced |
|---|
No study sessions yet.
45 Terms
Total Revenue:
Selling Price multiplied by quantity sold. (PxQ)
Profit
Occurs when Revenue > Costs of production (Revenue - costs)
Subnormal Profit
Profit earned below the normal profit level. E.x: a business making less than what is needed to cover basic costs.
Normal Profit
The minimum profit needed for a business to stay in operation, covering all costs including opportunity costs.
Economic Profit
Profit earned above the normal profit level, where average revenue exceeds average costs.
The Short Run
A period of time during which at least one factor of production is fixed in supply
The Long Run
A period of time in which all the factors of production can be varied in quantity.
A firm has the following costs of production for 50 desks: Labour 1,000, Raw Materials 2,500, Normal Profit 1,000, Rent 2,000. What is the minimum price this firm should charge per desk in the short run?
70 Euro
The Law of Diminishing Marginal Returns
If increasing quantities of a variable factor of production are added to a given quantity of a fixed factor of production, eventually a point will be reached where the addition to the total output begins to decline.
Assumptions underlying the Law of Diminishing Marginal Returns
Technology Remains Constant: The LDMR assumes that there are no advancements in technology during the production process. If a technological breakthrough does occur, the law begins again from the start.
Constant Quality: The law assumes that the quality of the variable factors that are being added to the set sized fixed factor are the exact same as the ones that were previously added.
One fixed Factor: This law assumes that at least one factor is fixed. It only applies in the short run and varies from business to business and from industry to industry.
Fixed Costs (FC)
Costs that do not change as output changes.
Variable Costs (VC)
Costs that vary as output changes.
(Raw materials, wages)
Total costs(TC)
Both fixed and variable costs added together.
(TC = TFC + TVC)
Average Fixed Cost(AFC)
FC/Q
Shape of curve slopes down as fixed costs are spread among a greater level of output and then levels out.
Average Cost(AC)
The total of average variable costs and average fixed costs
Marginal Cost(MC)
The additional cost to produce one extra unit of a good
Explicit Cost
The monetary costs a firm pays for inputs (recorded by accountants). They require a cash outlay by the firm.
Implicit Cost
Often non-monetary costs and are often difficult to quantify.
E.g. the owners time and investment into the firm.
marginal output
The changed in output arising from the use of one more unit of a factor of production.
Average Output
Total product divided by the number of workers employed; a simple measure of productivity.
Profit Maximisation
The assumed objective of the firm; the difference between total revenue and total cost is at a maximum (MR=MC)
Total Revenue
The revenue per unit sold (Price x Quantity)
Marginal Revenue
The Extra revenue generated from selling an extra unit of output (change in TR/ change in Quantity)
Average Revenue
The revenue per unit sold (Total revenue/Quantity)
Advantages of Specialisation of Labour to Individuals and Firms.
Workers need less training as they only have to master a small number of tasks,
It is faster and more productive to use one particular tool and do one job. No time is wasted with a worker changing tools or moving around the factory.
Workers can gain loyalty and a sense of achievement from their branch of production and in turn, become more efficient.
Disadvantages of the Specialisation of Labour for individuals and firms.
If workers are highly specialised then the job can become very boring and repetitive. This can lead to low labour morale.
If workers lose the motivation to concentrate and do a good job, mistakes may creep in as they get bored.
Highly specialised workers may find it difficult to find alternative work.
Why does the AC curve slope downwards? (SRAC)
Fixed Costs spread over a larger output: As the number of units produced increases, the unit cost falls and average fixed costs drop.
Specialisation: Specialists may be employed, or existing workers become more efficient resulting in lower unit costs.
As production expands AC fall as factors are combined more efficiently. The most efficient point of production is called the Optimum point.
Why does the AC curve slope upwards?
The Law of Diminishing Marginal Returns: After the optimum point AC tends to rise as the law of diminishing returns begins to operate on Average Variable Costs.
The Relationship between Marginal Cost curve and Average Cost curve.
When MC < AC then AC is falling
When MC > AC then AC is rising
When MC = AC then AC is at it’s minimum point.
Relationship between Short Run Average Curve and Long Run Average Curve
Firms always operate in the short run, therefore the long run is just a series of short run average cost curves.
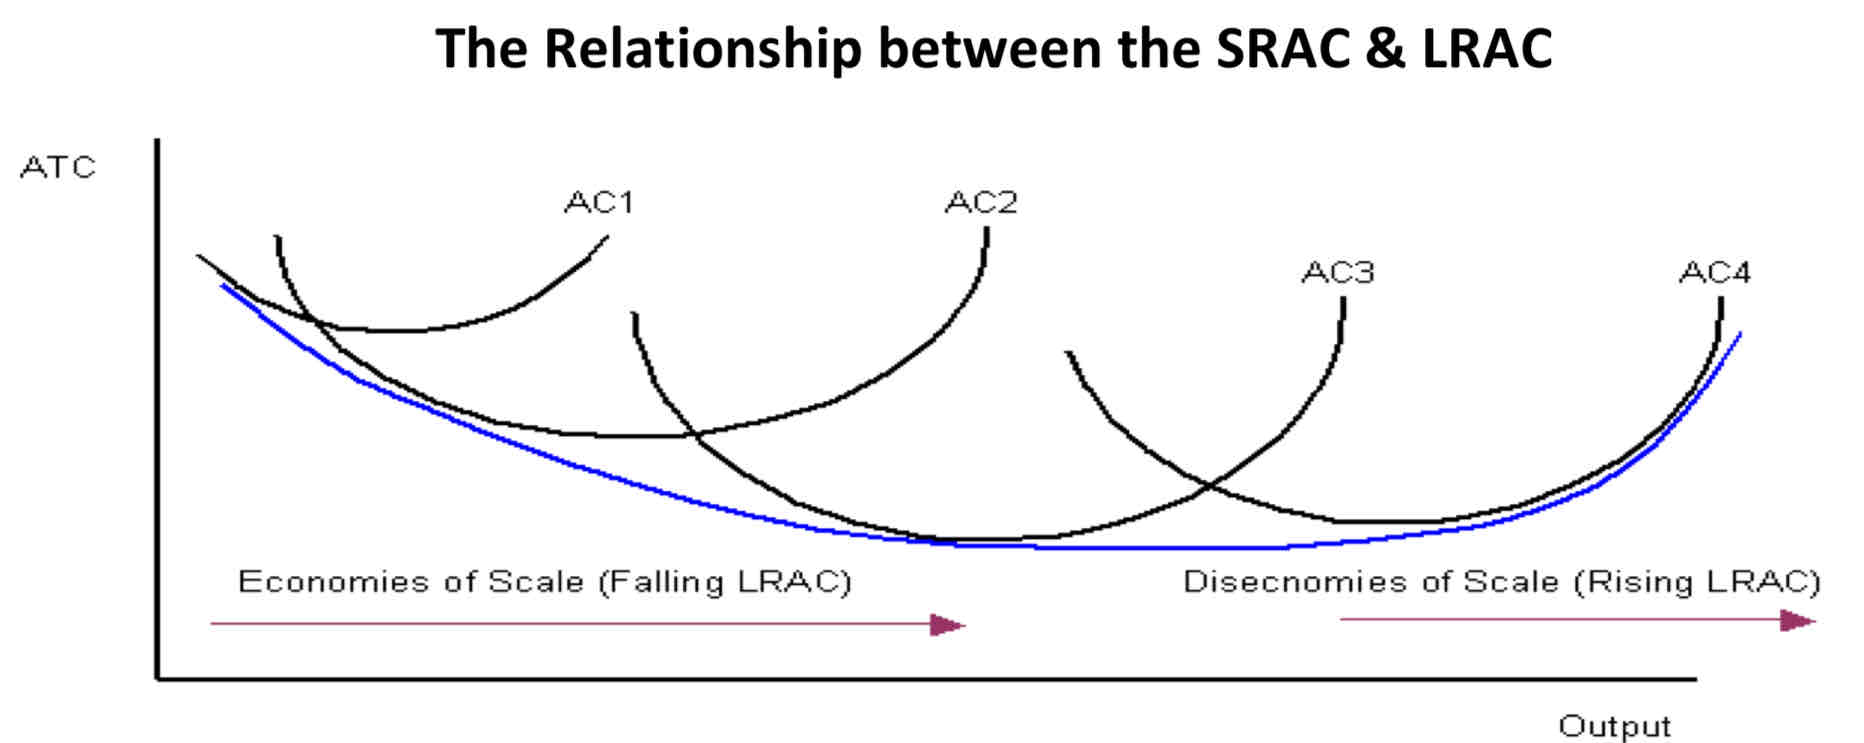
Relationship between LRAC and economies of scale.
Downwards:
Increasing Returns to Scale.
Economies of Scale.
Upwards:
Decreasing Returns to Scale.
Diseconomies of Scale.
Economies of Scale
Factors that cause the average cost per unit to decrease as the firm expands.
Internal Economies of Scale
Factors within a firm that cause the average cost per unit to decrease as the firm expands.
Types of Internal Economies of Scale.
Labour Economies: If a particular job can be separated into components, workers will become more skilled, efficient and thus specialised. This leads to an increase in output per worker.
Purchasing Economies: A large firm may be able to avail of discounts when purchasing raw materials / lower supply costs when buying in bulk (can buy in larger quantities and can agree discounts from suppliers.)
Economies in Distribution: A firm with a high volume of sales can organise a more efficient transport and distribution system than a small firm with only a few deliveries to make. This results in lower unit cost of delivery.
Financial Economies: Larger firms may have access to a greater range of finance options than a small firm and are more likely to be able to borrow at lower interest rates hence reducing production costs.
External Economies of Scale
Factors outside the firm that cause the average cost per unit to decrease as the firm expands.
Examples of External Economies of Scale.
Better Infrastructure: As roads/communications etc. improve, all firms will benefit. Shorter delivery times and less fuel is being used. E.g. Irelands motorway system.
Bulk Purchasing of Raw materials by the Industry: As an industry expands, firms require more materials/components. These may become cheaper as suppliers expand to meet increased demand. More suppliers enter the market leading to more competitive market which can result in cheaper goods.
Supports from Public Bodies: Some public bodies help particular industries e.g. Failte Ireland / Enterprise Ireland may help firms in the tourism industry. They can provide grants and subsidies which help reduced the unit cost of production.
Diseconomies of Scale
Factors that cause the average cost per unit to increase as the firm expands.
Internal Diseconomies of scale.
Factors within the firm that cause the average cost per unit to increase as a firm expands.
Examples of Internal Diseconomies of Scale
Managerial Diseconomies: The bigger the firm, the harder it is to manage. The directors of the firm are a small group of people who may not know all the necessary information which can result in communication problems.
As a firm expands, the interest of workers and management may conflict: Workers may lose motivation leading staff to become less efficient and increasing the cost per unit.
Increased number of Unproductive staffing: As a firm grows in size it must hire solicitors, accountants and other employees who do not directly contribute to producing goods and services. Despite being necessary to the business as a whole, they increase the average cost of production.
External Diseconomies of Scale
Factors outside the firm that cause the average cost per unit to increase as the firm expands.
Examples of External Diseconomies of Scale
Increased demand for raw materials: As demand increases, price rises thus increasing costs for the firm.
Increased demand for labour: Skilled labour becomes short in supply causing wages to rise. The firm may be forced to employ less skilled workers. Either way, costs increase.
Greater Need for Infrastructure: As an industry expands, greater demands are made on the economy’s infrastructure. The current state of the infrastructure may be inadequate. For example, traffic congestion leads to an increase in delivery time which increases the cost of distributing the product.
Economic advantages of falling productions costs for the Irish Economy
Increased Competitiveness: With lower costs, prices may fall for Irish goods and exports may become cheaper.
Lower Prices: With lower prices inflation may fall and this may entice consumers to purchase more goods.
Increased Employment: With rising demand, businesses may increase their demand for labour/maintain existing labour.
Attract Investment: lower costs for businesses will encourage expansion and attract foreign firms(FDI) into Ireland.
Profits May Increase: As a result of lower costs, business profits may increase leading to an increase in corporation tax revenue for the government.
How can the government improve the competitiveness of small firms?
Reduce Minimum Wage: With a lower minimum wage employers would be able to get cheaper labour and therefore reduce costs.
Reduce Utility Charges: A reduction in costs for electricity, gas, postage, waste charges etc. or anyt state service provided for small businesses would help reduce costs of production
Reduce Taxation: A decrease in indirect taxes would reduce costs to small businesses. E.g. decrease employers PRSI to to reduce firms’ costs.
Develop Infrastructure: basic improvement of roads, telecommunications, broadband etc. will make it easier for smaller businesses to operate more efficiently.
What Objectives might a firm have besides profit maximisation?
To become a Takeover target: Some firms build a business that may not generate profit. However, they have a specific asset that is valuable to another firm that may want to buy them. A bigger firm may also want to eliminate competition by ‘buying them out’
To Satisfy a Sufficient Level of Profit: Increasing output may involve financial risk or added work which entrepreneurs are not willing to put in. They will therefore build a business to a normal level of profit and maintain it.
To Alleviate a Social/Environmental Problem: A social enterprise seeks to build a business to provide a solution to a particular problem rather than pursue profits e.g. Non-profit organisations.
Explain the shape of the long run average cost curve
Firm always operates in the short run meaning the long run average curve consists of a series of short run average curves.
As the firm expands, it will have different factory sizes.
The firm always produces at the lowest point on the SRAC curve.
We join the lowest point of the SRAC curves and end up with the hollow u-shaped LRAC curve.