Descriptive Statistics: Key Concepts and Excel Applications for Data Analysis
1/39
There's no tags or description
Looks like no tags are added yet.
Name | Mastery | Learn | Test | Matching | Spaced | Call with Kai |
|---|
No analytics yet
Send a link to your students to track their progress
40 Terms
Statistics
A branch of mathematics concerning the analysis, interpretation, and presentation of data.
Descriptive Statistics
Summarizing data, usually with estimates of common parameters (e.g. mean, median, range, etc.) or graphs and data visualization techniques.
Inferential Statistics
Inferential statistics help determine whether trends/patterns found in the current dataset (sample) also apply beyond it.
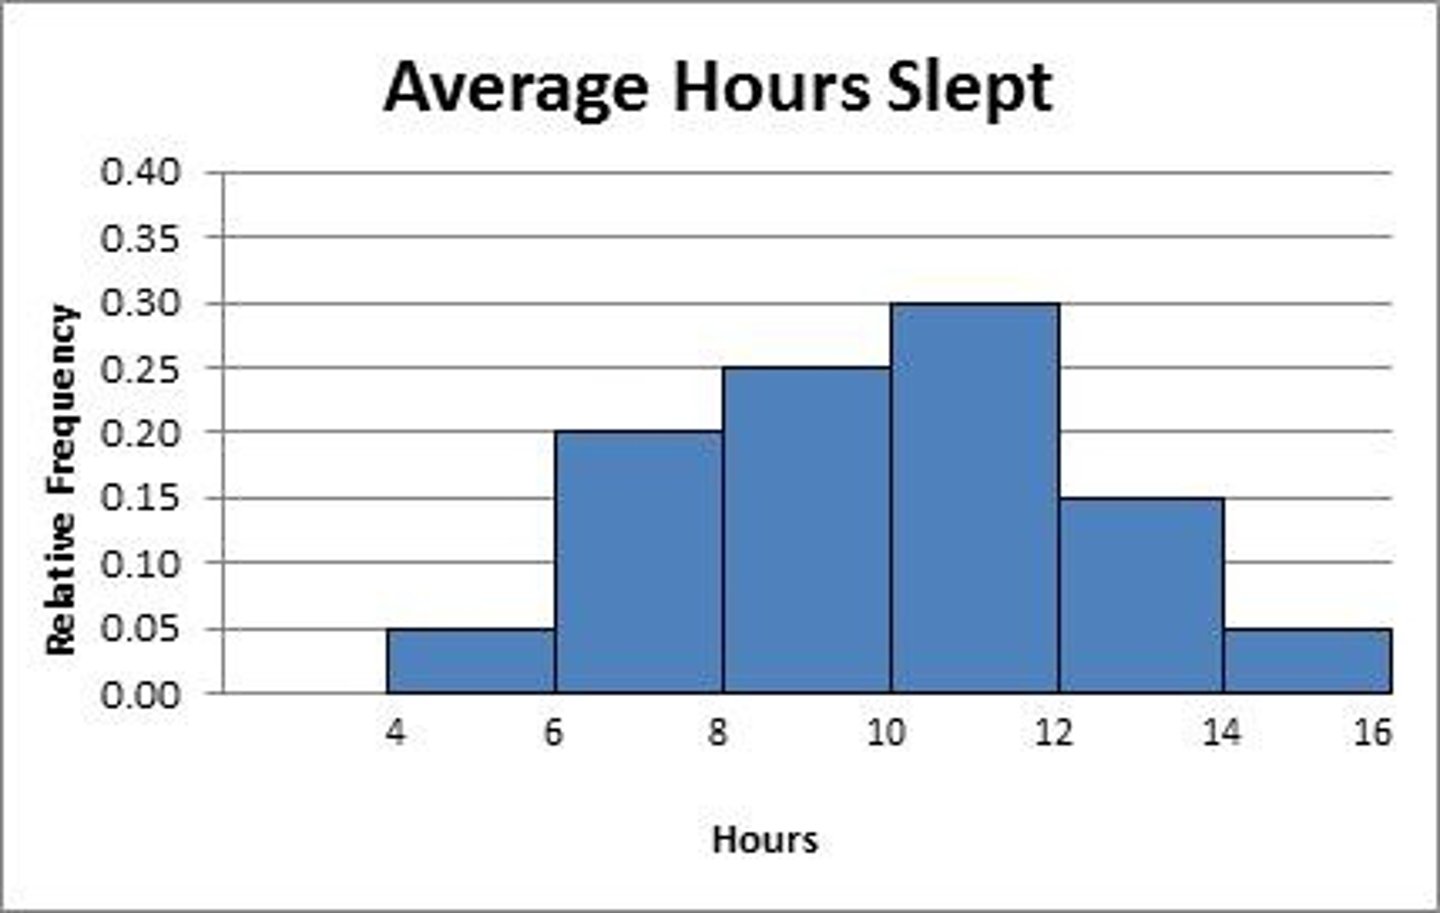
Histogram
A frequency chart that specifies ranges of numbers for each bar called 'bins'.
Average/Mean
The balance point of a dataset.
Standard Deviation
Measure of the average distance that points lie from the mean; for a normal distribution, roughly 70% of the data is within ± 1 standard deviation from the mean and 95% of the data is within ± 2 standard deviations from the mean.
Median
The numeric value separating the higher half of a sample, a population, or a probability distribution, from the lower half.
Mode
The most frequently occurring observation in a dataset.
Range
The difference between the maximum observed data point and the minimum observed data point.
Percentile
An observed value of a given variable below which a certain percent of observations fall.
20th Percentile
The value below which 20 percent of the observations may be found.
First Quartile (Q1)
The 25th percentile.
Median (Q2)
The 50th percentile.
Third Quartile (Q3)
The 75th percentile.
Excel Function for Average
=AVERAGE(Data) to calculate the mean.
Excel Function for Standard Deviation
=STDEV.S(Data) to calculate the standard deviation.
Symmetric Distribution
If the distribution is symmetric (not skewed), then the mean and the median are equivalent.
Data Sorting for Median
Sort the data to find the median, which is the dividing data point where half are below and half above.
Tallest Bar on Histogram
Represents the mode in a frequency distribution.
Percentiles/Quartiles Identification
Approximate percentiles/quartiles can be identified using a histogram.
50th Percentile
The median, which is the value below which 50 percent of the observations may be found.
Common Parameters in Descriptive Statistics
Includes mean, median, mode, range, and standard deviation.
Data Visualization Techniques
Methods used to graphically represent data for better understanding.
Sample Size (n)
The number of data points in your sample.
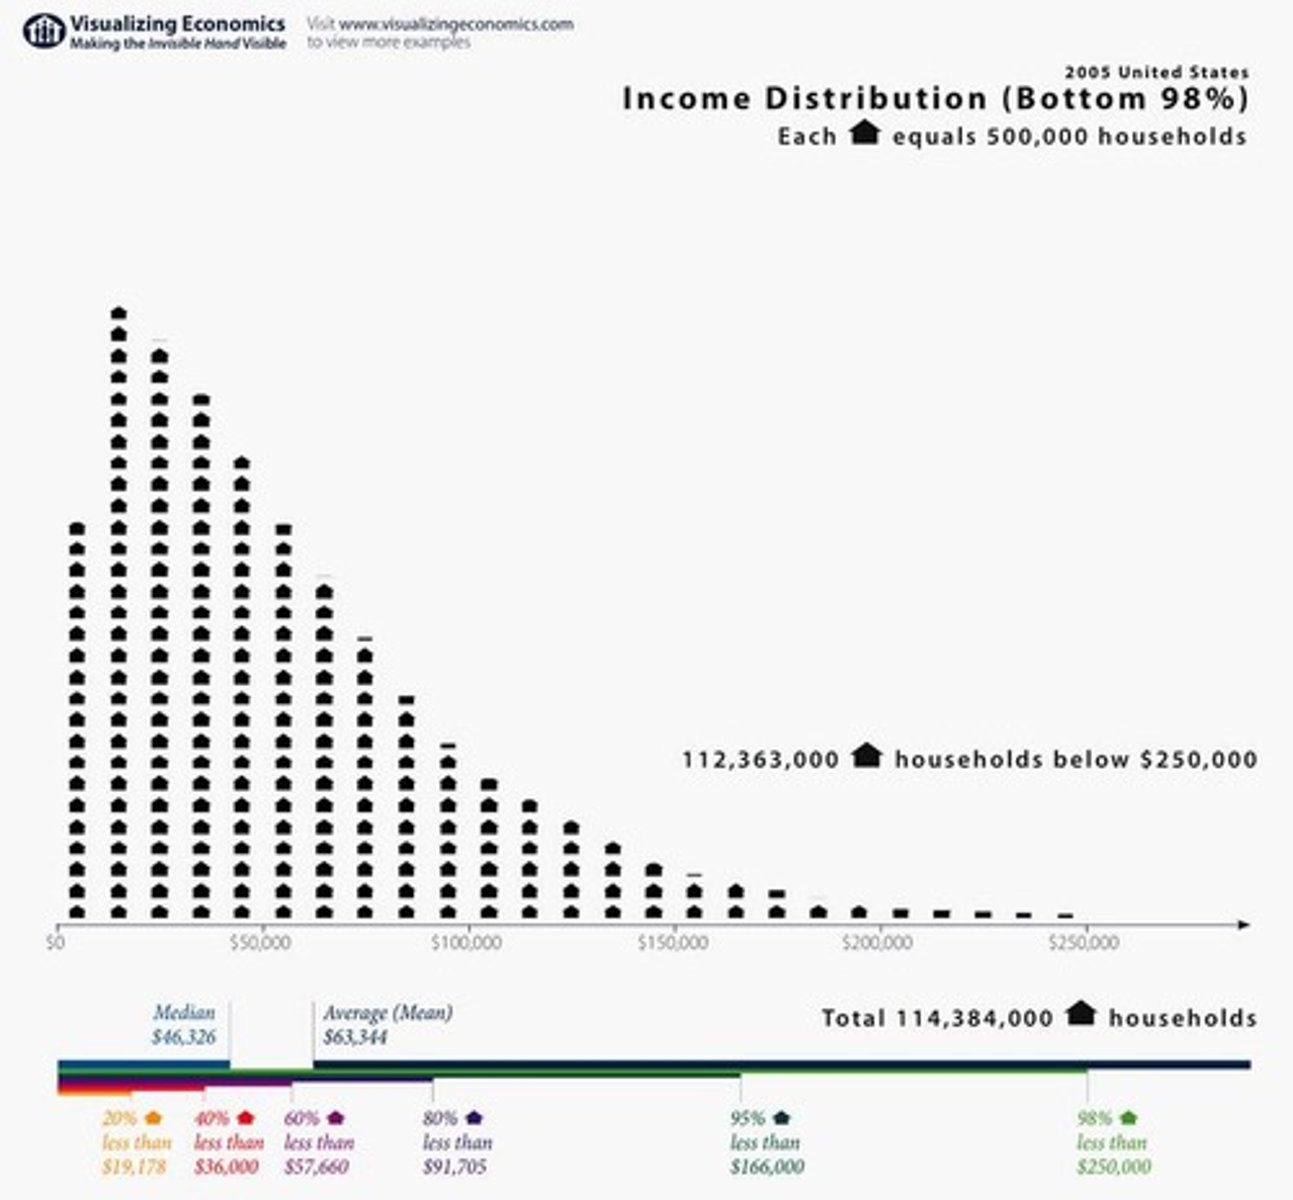
Average vs. Median
The average is commonly used, but the median is preferred for household incomes as it divides households evenly, providing a more accurate representation.
Mean Household Income
$63,000, according to the US Census Bureau.
Median Household Income
$46,000, according to the US Census Bureau.
Example 1: Incomes for 5 households
35k, 35k, 35k, 35k, 100k; Average Income = 48k, Median Income = 35k.
Example 2: Incomes for 5 households
35k, 35k, 35k, 35k, 500k; Average Income = 128k, Median Income = 35k.
Top 1% Wealth Distribution
The top 1% of the wealth distribution has more wealth than the bottom 50%.
Max Income
4.9 Billion, with a scale of 1 inch = 50k, and distribution stretching 1.5 miles.
When is the Median Preferred?
The median is preferred when the data is not highly discrete.
When are Means Preferred?
Means are preferred when the data is highly discrete.
Quantitative Variables
Observations that take on numerical values representing different magnitudes.
Categorical Variables
Observations that take on values that are names or labels.
Common Statistic for Quantitative Data
Means are the most common statistic.
Common Statistic for Categorical Data
Proportions (or percentages) in each category are the most common statistic.
Census Data
According to the US Census Bureau, the median income is considerably lower than the average.
Second Quartile (Q2)
The 50th percentile, also known as the median.
Extreme Case for Median
The median equals the more common outcome in binary data but gives no information about the relative number of observations.