Lecture 7 - Issues in Data Collection
1/25
There's no tags or description
Looks like no tags are added yet.
Name | Mastery | Learn | Test | Matching | Spaced | Call with Kai |
|---|
No analytics yet
Send a link to your students to track their progress
26 Terms
Survey
method of gathering info using relevant questions from a sample of people with the aim of understanding populations as a whole
Can be used for scientific research, market research, political data, etc
Opinion poll
type of survey asking people for their opinion, usually about a policy or about a candidate for public office
Fundamental goal of surveys and polls
Sample: a set of people who will answer the questions
Ideally large and representative of the population we want to generalize to
Questionnaire: a set of questions to capture what we want to learn
Typically multiple-choice or a likert/rating scale
Mode of interview: how we ask the questions
In-person, mail, phone, online
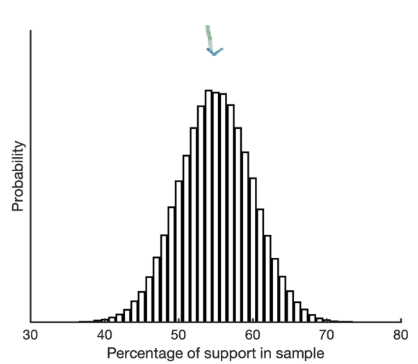
Outcomes of simulated polls of 100 ppl
Let’s assume that the 55% is the true level of support in a population
Assume you repeatedly sample 100 people
Histogram: with samples of 100 ppl, the outcome varies a lot around the mean (55%). In most samples, we get numbers between 50-60, but occasionally beyond this range
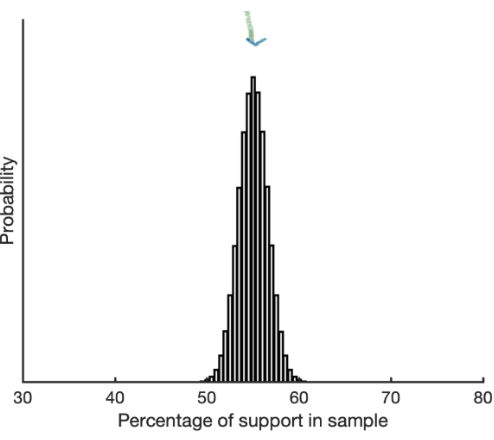
Outcomes of simulated polls of 1000 people
Let’s assume that the 55% is the true level of support in a population
Assume you repeatedly sample 1000 people
Histogram: with samples of 1000 ppl, the outcome varies less around the mean (55%). In most samples, we get numbers between 53-57
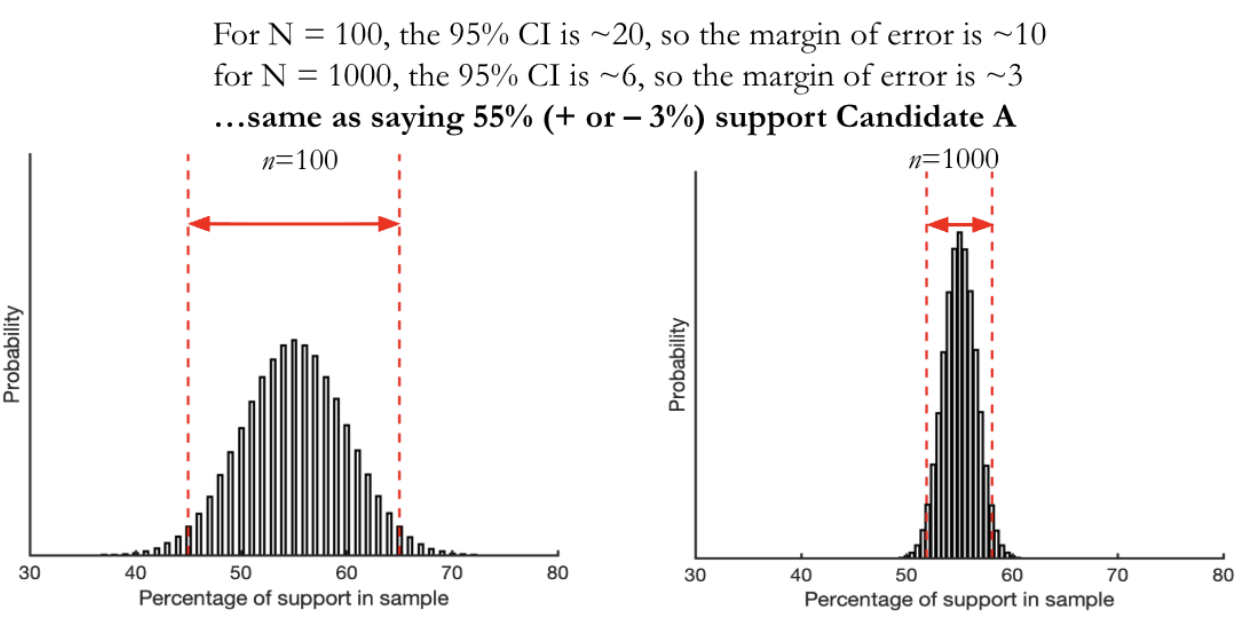
95% confidence interval
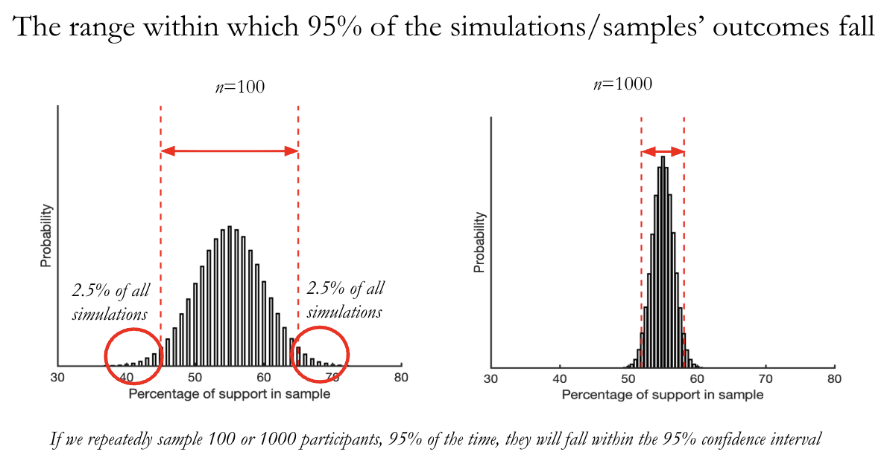
Margin of error: half the 95% confidence interval
Law of large numbers
states that as the sample size of a random experiment increases, the average value of the outcomes will converge to the expected value or true probability or population mean
Larger sample = lower sampling/statistical error or lower margin of error
Systematic errors such as error due to biased samples cannot be addressed by large samples
Statistical error
due to limited sample size, larger samples can minimize this error
Systematic error
due to biases in selecting your sample and other design problems. Larger samples cannot minimize this error
Probability sample
gives everybody in the population an equal chance of being included (e.g., calling random phone numbers)
This is different from non-probability sample, such as convenience samples. When an NYU researcher who wants to study the US population recruits an NYU sample, that’s a convenience sample. It’s not representative of the population but is easy to collect
Random selection
randomly select and contact respondents to avoid selection bias
But not everyone who is contacted participates
More educated, higher income ppl are more likely to participate
Weighting
mathematically boosting (or providing a higher weight to) the voices of people who belong to groups that are less likely to participate in polls
Oversampling
the researcher intentionally over represents one or more groups for which they expect lower representation
Ex: I'm collecting a sample of 1000 Americans. There are only ~2% South Asians in the US (20 ppl in my sample). Because 20 is too few, I may sample 100 South Asians (constituting 10% of my sample). My final analysis will under-weight the oversampled group to their actual proportion in the population
Reasons for systematic bias
Some people are easier to reach (e.g., WEIRD samples)
Some people may be more willing to participate (e.g., people will stronger opinions)
The source (e.g., Fox news vs CNN) or topic (e.g., vaccines) may affect who participates
People lie in surveys, even for harmless reasons (e.g., to make themselves look good)
Biased attrition in longitudinal surveys (e.g., anti-vaxxers may drop out in a vaccine study)
Misleading question wording
Leading questions
Would you favor or oppose taking military actions in Iraq to end Saddam Husssein’s rule? → 68% said they favored military action
Would you favor or oppose taking military action in Iraq to end Saddam Hussein’s rule even if it meant that U.S. forces might suffer thousands of casualties? → only 43% said they favored military action
Double-barreled questions
Double-barreled questions ask respondents to evaluate more than one concept. Better to ask two separate questions
Ex: How much confidence do you have in President Obama to handle domestic and foreign policy?
What if participants have confidence for domestic but not foreign policy?
Avoiding reactance
Support for expanding “assistance to the poor” vs support for expanding “welfare”
Support for affordable health insurance vs support for obamacare
“Making it legal for doctors to give terminally ill patients the means to end their lives,” vs “making it legal for doctors to assist terminally ill in committing suicide”
Consider whether certain words may produce bias, be viewed as biased or offensive, or trigger an emotional reaction
Negative Wording
Issues: 1) larger cognitive load for participants, 2) participants may misread the question
Simply negative wording: “I disagree that it is important to fund the arts”; “I do not believe that it is important to fund the arts”
Double negative wording: “I agree that it is not unimportant to fund the arts”
Complex negative wording: “I disagree that it is not important to fund the arts”
How question choices matter
Choosing from a set of options versus allowing open text entry can return very different results
Forced-choice questions tend to yield more accurate responses than select-all-that-apply questions, especially for sensitive questions
Acquiescence bias
respondents have a greater tendency to agree with statement on surveys, especially respondents lower education levels
even more pronounced when there’s an interviewer present
Order effects
questions early in a questionnaire can have unintended effects on how respondents answer subsequent questions
How can polls be misused/manipulated?
By using misleading questions wording, choice wording, etc.
By collecting biased samples
By creating fake surveys
Potemkin numbers
Meaningless statistics designed to look real and authoritative
Results from poorly designed surveys are not reliable, but they can serve to advance the incentives of motivated individuals/groups
Prediction/forecasting
Telling in advance whether an event will happen or which event will happen
Elections results but also world events like collapse of the Soviet Union
Sports forecasting and betting
Uses past results and information (e.g., election predictions use state and national poll data, simulations, data on inflation, past voter turnout)
In electoral prediction, the goal is to predict who will win an election or the probability for each candidate winning
Challenges
Unanticipated sampling biases (in addition to usual/anticipated sampling biases):
Supports of one candidate are more willing to participate
Requires predicting not just people’s opinions but also who will vote
Requires predicting how much each voter can actually influence the outcome given not everyone has equal influence (gerrymandering, swing states, etc)
Requires accounting for changes in people’s opinions in the days leading up to the election, especially for undecided voters