GLPH 271: Module 2
 Call Kai
 Learn
Learn Practice Test
 Spaced Repetition
 Match
Match Flashcards
 Knowt Play
1/40

There's no tags or description
Looks like no tags are added yet.
Name | Mastery | Learn | Test | Matching | Spaced | Call with Kai | Chat |
|---|
No analytics yet
Send a link to your students to track their progress
41 Terms
WHAT IS EPIDEMIOLOGY
Epidemiology is the study of the distribution and determinants of health-related states or events (including disease), and the application of this study to the control of diseases and other health problems.
DATA SELECTION AND DATA USE for indigenous
Often, the epidemiological data collected on minority groups, such as Indigenous Peoples of Canada, comes from a place of colonization
For example, data registries and databases will often identify Indigenous Peoples through the use of the Indian Registry
For Indigenous Peoples in Canada, there are two conditions for reaching data sovereignty;
1. the decolonization of data,
2. Indigenous data governance.
DECOLONIZATION OF DATA
-Although data that is collected is sometimes used to benefit Indigenous communities, we must recognize that it is often collected through a colonial framework
-five categories, or "five D's", of the colonization of Indigenous data. These include: disparity, depravation, disadvantage, dysfunction, and difference.
-often used to classify Indigenous populations as "problematic" and in need of help.
-especially harmful as this data can be used to rationalize dispossession and the marginalization of specific communities
-INDIGENOUS DATA GOVERNANCE
-in Canada there are many cases of Indigenous governance over data; for example, O C A P.
-WHAT IS PREVALENCE
-prevalence of a disease tells us about the number of existing cases of that disease in a given population
-measure can be representative of a specific point in time, referred to as point prevalence
-indicative of a period of time, referred to as period prevalence
-POINT PREVALENCE
-Point prevalence is a measure of the proportion of the population that has a certain disease at a specific point in time.
-in global health research, the use of point prevalence is rare
-it may require six months to survey a region of Somalia and determine the number of existing cases of tuberculosis, in which case period prevalence must be used.
-PERIOD PREVALENCE
-proportion of the population that has a certain disease over a defined period of time
-Period Prevalence = # of cases at a period of time / average population during that period of time
-INCIDENCE?
-Incidence measures how quickly new cases of a disease arise in a population over a defined period of time.
-Incidence is also a measure of risk
-incidence of pop A / incidence of pop B is risk
-CUMULATIVE INCIDENCE (OR INCIDENCE PROPORTION
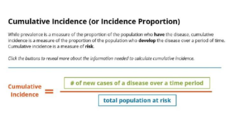
-While prevalence is a measure of the proportion of the population who have the disease, cumulative incidence is a measure of the proportion of the population who develop the disease over a period of time.
-Cumulative incidence is a measure of risk
-Cumulative Incidence = # of new cases of a disease over a time period / total population at risk
-Total population at risk excludes individuals who already have the disease or who are incapable of developing the disease. It is calculated by the equation:
-(total population) - (# of existing cases)
-INCIDENCE DENSITY RATE (OR PERSON-TIME Incidence Rate)
-the incidence rate (I R) focuses on the length of time people were at risk of disease
-Incidence rate is also sometimes referred to as incidence density
-Incidence Rate = # of people who develop the disease / # of person-years at risk of disease
# of person-years at risk of disease
= (# of people at risk) × (# of years at risk)

at risk population constant assumption
-Sometimes the at-risk population is constant. However, it is not safe to assume the at-risk population is constant in certain situations:
-Reasons for Increased At-Risk Population
• Births
• Immigration
Reasons for Decreased At-Risk Population
• High incidence
• High death rate from other causes
• Emigration
-A village has a population of 1,000. Each year for four years, 50 people fall ill with malaria and in the second year an earthquake kills half the population. What is the incidence rate for malaria? What would the incidence rate be if the population remained constant?
incidence rate for malaria:
200 ÷ (1000 + 475 + 425 + 375) = 0.088
Therefore the I R for malaria is 8.8%.
if population remained constant:
200 ÷ 1000 = 0.2
Therefore the I R for malaria if the population remained constant is 20% over the course of the four years, or 5% per year.
incidence vs prevalence compared

-For a study of H I V, 1000 women aged 20-35 years old were recruited from a high risk population. Of these, 50 tested positive for H I V at the initial examination. The remaining 950 women are followed for 5 years and re-examined on a yearly basis. During the follow-up period, a total of 75 women are diagnosed with H I V. For 25 of these, the diagnosis was made at the 3 year exam, for 25 the diagnosis was made at the 4 year exam, and for 25 the diagnosis was made at the final exam. Assume that no women were lost to follow-up for other reasons during the course of the study.
Using the case study and your knowledge about the health measurement calculations, answer the question.
Review the equations used to calculate prevalence, cumulative incidence, and incidence rate.
What is the prevalence at the beginning of the study, cumulative incidence, and incidence rate of H I V?

-CRUDE MORTALITY RATES
-Crude mortality rate is the count of all the deaths over a specified time period divided by the population at the midpoint of the time period being considered.
-often reported per 100,000 people and the time period is usually a year.
-Crude Mortality Rate = # of deaths over a time period × 100 000 / population at midpoint of time period
-TWO TYPES OF CRUDE MORTALITY RATES
-All-Cause Mortality Rate
Considers deaths for any reason in the population.
Cause-Specific Mortality Rate
Measures the deaths in a population from a specific disease.

-CALCULATING SPECIFIC MORTALITY RATE
-Calculating specific mortality rate is very similar to calculating crude mortality rate. however, it is for a certain subgroup instead of the whole population
-Specific Mortality Rate = # of deaths over a time period (in a certain subgroup) × 100 000 / subgroup population at midpoint of time-period
-STANDARDIZING MORTALITY RATES
-Standardization of mortality rate is used when comparing the mortality in two populations that differ in terms of characteristics that are known to influence mortality (i.e. age, sex, etc.).
-Crude and specific mortality rates don't take sex, age, or the general composition of a population into account
-most common metric to standardize mortality by is age.
-While at a friend's cottage, you pick up an old magazine from 2010 and read an article about Chad, which states that the mortality rate from Alzheimer's and Dementia that year was 4.7 per 100 000. By way of comparison, you find a site that states that the rate in Canada that year, was 36 per 100 000.
-What might be the reason for the higher mortality rate from Alzheimer's and Dementia in Canada compared to Chad?
-Alzheimer's is an illness that typically affects older people. When comparing Canada to Chad, Canada has a greater proportion of older citizens. This, along with the fact that Canada probably has better diagnosis and tracking, would translate to Canada having a higher Alzheimer's and Dementia mortality rate.
-Which of the statements is correct regarding the size of all-cause mortality rates as compared to cardiovascular disease (C V D) - specific mortality rates in men aged 40-45?
A. All cause mortality < C V D; specific death rate < C V D; specific death rate in men aged 40-45.
B. All cause mortality > C V D; specific death rate > C V D; specific death rate in men aged 40-45.
C. All cause mortality > C V D specific death rate; no statements can be made regarding the age-specific rate.
D. We don't have enough information in the question to access this.
-The correct answer is C.
All-cause mortality will always be greater than any single disease specific mortality. Remember in the calculations only the numerator is changed and it must be smaller for any single disease than for all causes of death.
However, since in specific mortality rates both the numerator and the denominator are changed, no generalizable statements about the size of the rate can be made.
-MEASUREMENT LIMITATIONS IN DEVELOPING COUNTRIES
-In developing countries it can be difficult to obtain reliable measurements of population morbidity and mortality.
-many people die at home, never having been to a health facility.
-Vital Event Registration
-Provides policy makers and public health professionals with a better understanding of number of deaths in developing countries
-Verbal Autopsy
-Provides policy makers and public health professionals with a better understanding of the causes of death in developing countries
-WHAT IS RELATIVE RISK
-Relative Risk (R R) refers to how many times more likely it is that one group of people will become ill compared to another group
-Risk is simply the cumulative incidence of being exposed to an illness
-Relative Risk = a/(a+b) / c/(c+d)
a/(a+b)
The primary group (E+) normally refers to the group exposed to the risk.
a = primary group (E+) with the disease (D+)
b = primary group (E+) without the disease (D-)
c/(c+d)
The comparative group (E-) refers to the group not exposed to the risk.
c = the comparative group (E-) with the disease (D+)
d = the comparative group (E-) without the disease (D-)
-TABLE FOR R R CALCULATIONS

-INTERPRETING RELATIVE RISK
-If R R
-Out of the 525 people that lived
(104/525) / (135/1045) = 0.153
thus, those that lived closer to the water had lower risk then those that lived further away
-ODDS RATIO
-the calculation of relative risk is contingent upon being able to calculate incidence. In some circumstances, you may be unable to calculate incidence because there is not enough information about the entire population.
-In the absence of information about the incidence of an entire population, you can calculate an odds ratio based on information about the primary group (E+) and the comparative group (E-)
-In certain circumstances, like when the outcome is rare or when you cannot quantify the at-risk population such as in retrospective case-control studies, the odds ratio is considered a reasonable approximation of the relative risk
-Odds Ratio = a × d / b x c
a = primary group (E+) with the disease (D+)
d = the comparative group (E-) without the disease (D-)
b = primary group (E+) without the disease (D-)
c = the comparative group (E-) with the disease (D
calculated based off of a/b divided by c/d
odds ratio question

-most accepted metric for global burden of disease
-is the Disability Adjusted Life Year (DALY), which is used by the W H O.
-CALCULATING DALY
-Disability Adjusted Life Year (DALY) is a measure of overall disease burden, expressed as the cumulative number of years lost due to ill-health, disability, or early death.
-Disability Adjusted Life Year (DALY)
= Years Lived with Disability (Y L D) + Years of Lost Life (Y L L)
-YEARS LIVED WITH DISABILITY (Y L D)
-incorporate disability and mortality into a single measure of burden, years lived with disability (Y L D) is used. Y L D multiplies the number of years a person has a condition that affects their quality of life
-Each condition has a weighting factor between 0 and 1, 0 being perfect health and 1 being death. The rating is indicative of the degree to which a disease negatively impacts an individual's life
-Y L D = prevalence x disability weighting factor
-VISUALIZING YEARS LIVED WITH DISABILITY
-Once Y L D has been calculated for a disability, it can be compared to other Y L Ds from different disabilities. For example, a graph is commonly used to compare multiple disabilities across multiple age groups.

-YEARS OF LIFE LOST
-Years of life lost (Y L L) is an indicator of premature mortality and has two defining characteristics:
• It takes age of death into account by subtracting life expectancy by the average age of death.
• It places more weight on illnesses that result in early mortality because dying young has a bigger impact on both the individual and society at large.
-Y L L = (# of deaths) x (Life Expectancy - Death)
YLD
-Much like Y L D, years of life lost can be visualized on a graph to compare to other causes, as well as the number of actual deaths for that cause.

-You are investigating a community with a population of 1.2 million. You are given this information about the population:
• Annual deaths due to congestive heart failure: 2316
• Average age of death with disease: 71
• Life expectancy without disease: 80
• Congestive heart failure prevalence: 5,000 per 100,000
• Congestive heart failure disability weighting factor: 0.20
DALY = Y L D + Y L L
Y L D = (prevalence) x (disability weighing factor)
Y L L = (# of deaths) x (Life Expectancy - Age of Death)
-DALY = [(5,000/100,000 × 1,200,000) × 0.2] + [2316 × (80-71)] = 32 844
-CRITICISMS OF DALY
-Criticisms
-One major criticism of DALY is that it evaluates health through an ableist lens. By weighting disability, able-bodied people are valued more highly than people with disabilities.
-Another criticism is that DALY doesn't account for the age of people, which is related to a person's ability to contribute to society.
-Support
-Supporters of DALY counter criticisms by pointing out that prioritizing interventions based on people's potential to contribute to society is currently the best option.
-ORAL HISTORIES, TRADITIONS, AND STORYTELLING
-Oral histories and storytelling both convey events from the past and offer lessons or cautionary tales to the listener.
-Oral histories are more specific to a time period or special event that happened, and are often considered historically accurate
-In contrast, storytelling gives the storyteller more creative and imaginative liberty to better emphasize the teaching or lesson.
-In some Indigenous communities, specific individuals are selected to be the orators, to carry forward these stories and histories
-These orators would have the permission to tell the stories even if they were not their stories originally.
-Each orator has the ability to add their own experience to the story, therefore increasing the protective knowledge held within the stories.
-ACCURACY OF ORAL RECORD KEEPING
-Indigenous oral record keeping is completed through complex and sophisticated ways including performative practices such as dancing and drumming
-Many scholars have studied the effectiveness and accuracy of these oral histories, including Canadian scholars such as Renée Hulan and Renate Eigenbrod.
oral traditions definition
-"The means by which knowledge is reproduced, preserved and conveyed from generation to generation. Oral traditions form the foundation of Aboriginal societies, connecting speaker and listener in communal experience and uniting past and present in memory."
-BLENDING ORAL AND WRITTEN RECORDING KEEPING
-One example of the blending of oral and written record keeping was during both the SARS outbreak and smallpox pandemic. Many Western communities leveraged their knowledge, previous experience, and records from the SARS outbreak to prepare and combat the COVID-19 pandemic
-some Indigenous communities in Canada have used not only their previous experience and knowledge of SARS, but their experience with smallpox to help in the fight against COVID-19