Rate of change from graphs
1/3
There's no tags or description
Looks like no tags are added yet.
Name | Mastery | Learn | Test | Matching | Spaced |
|---|
No study sessions yet.
4 Terms

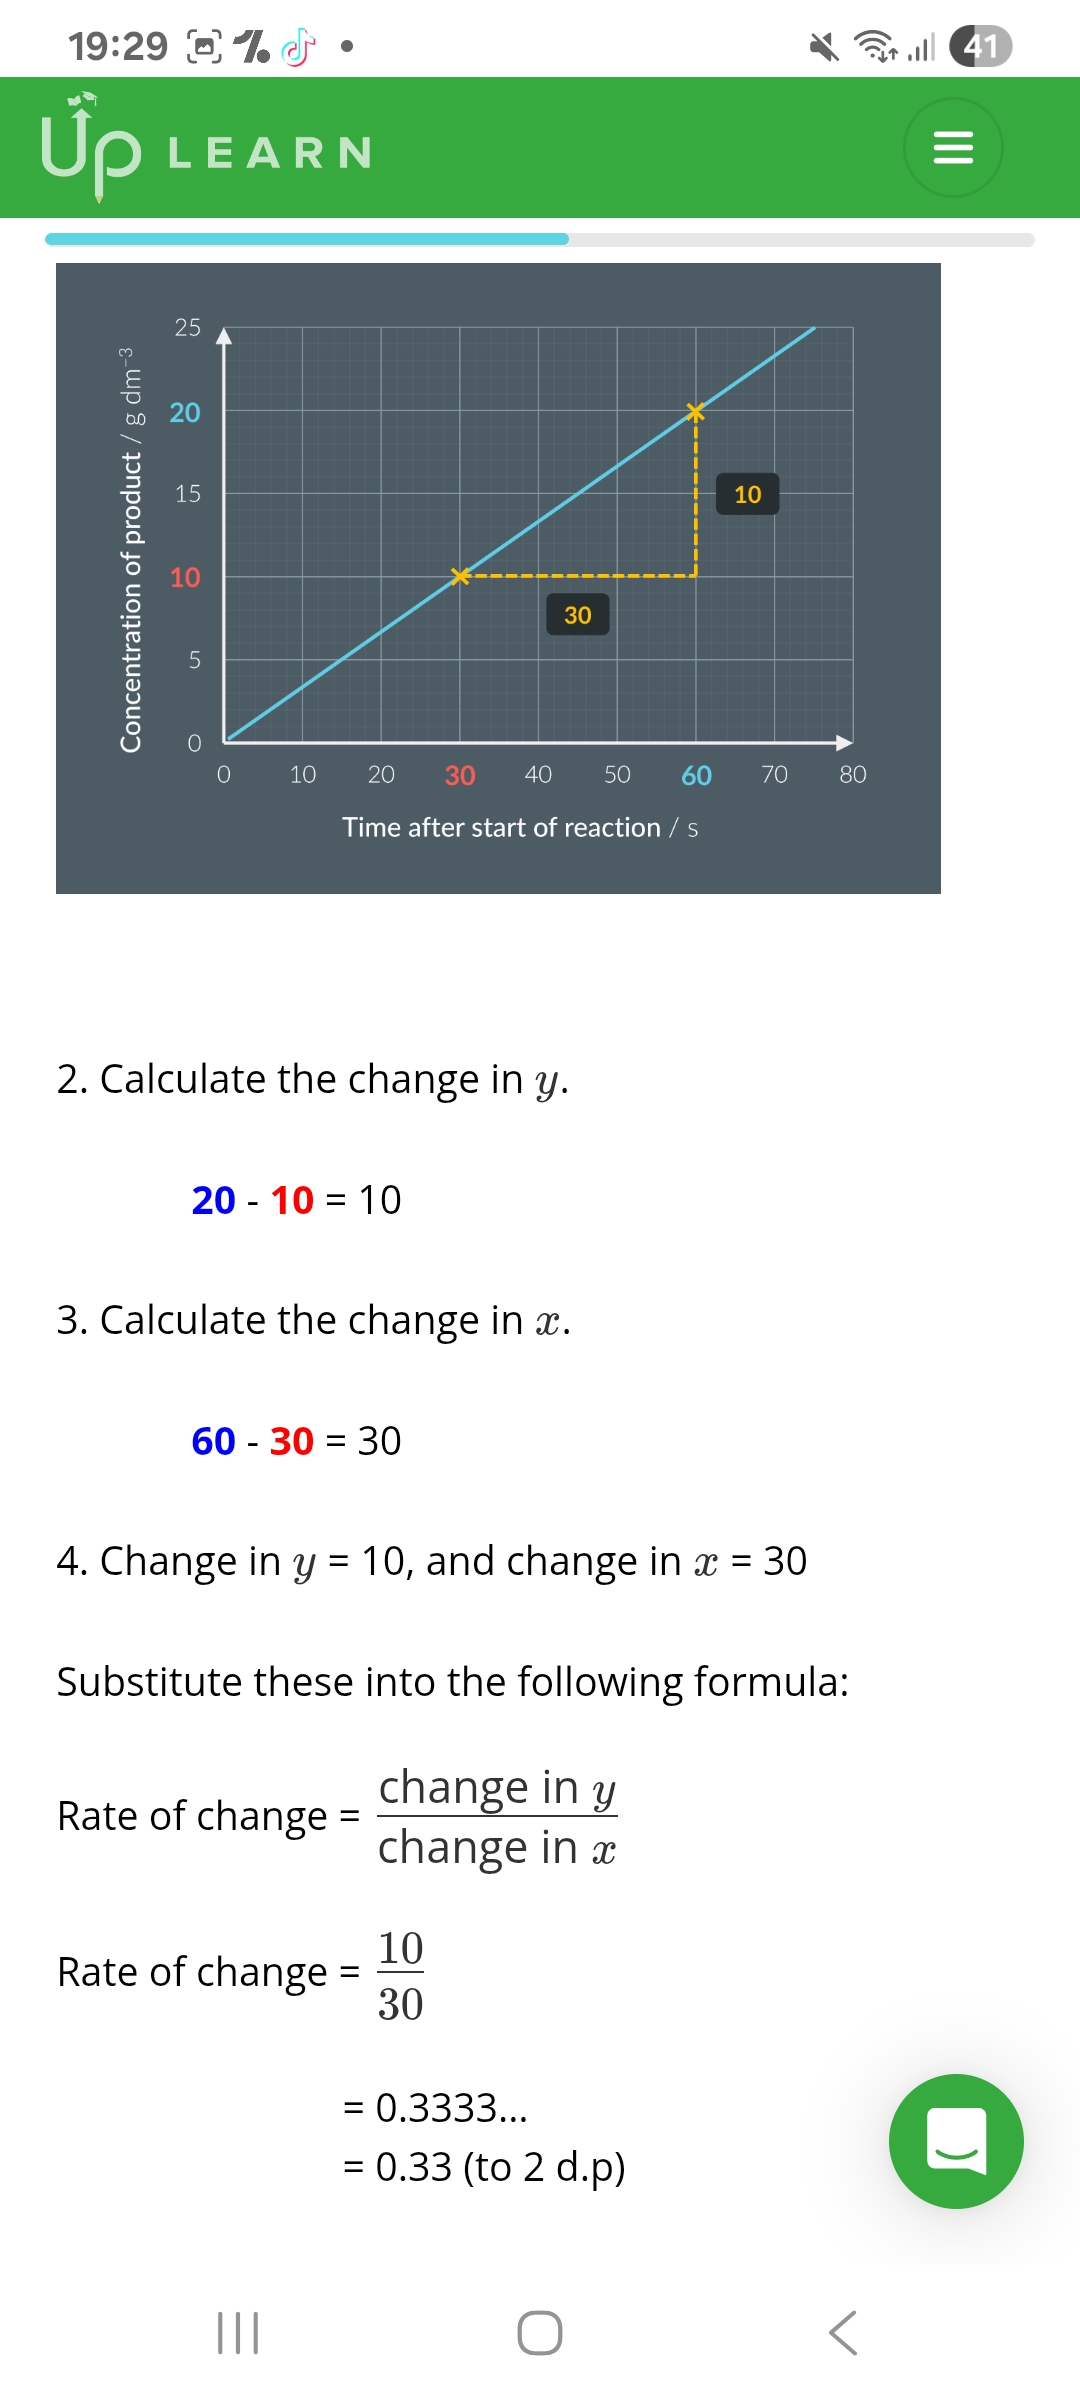
A student carries out an enzyme-controlled reaction. They measure how the mass of substrate mg changes over time.
What should a graph of their results look like?
A
Explanation
When you draw a graph:
•The independent variable should be on the x-axis.
•The dependent variable should be on the y axis.
•The shape of the line of best fit depends on the trend shown by the data.
In this experiment:
•The independent variable is time.
•The dependent variable is the mass of the substrate.
•The trend shown by the data is linear, which means a straight line of best fit should be drawn.

Answer the question?
0.33
B
To work out the units, substitute the y and x units into the same formula:
Rate of change units = change in y/change in x
Rate of change units = g dm*-3/s = g dm*-3 s*-1

Answer the followung questions
0.03. 2. g/s or g s*-1
Explamation of q1 continued:
3.Calculate the change in y
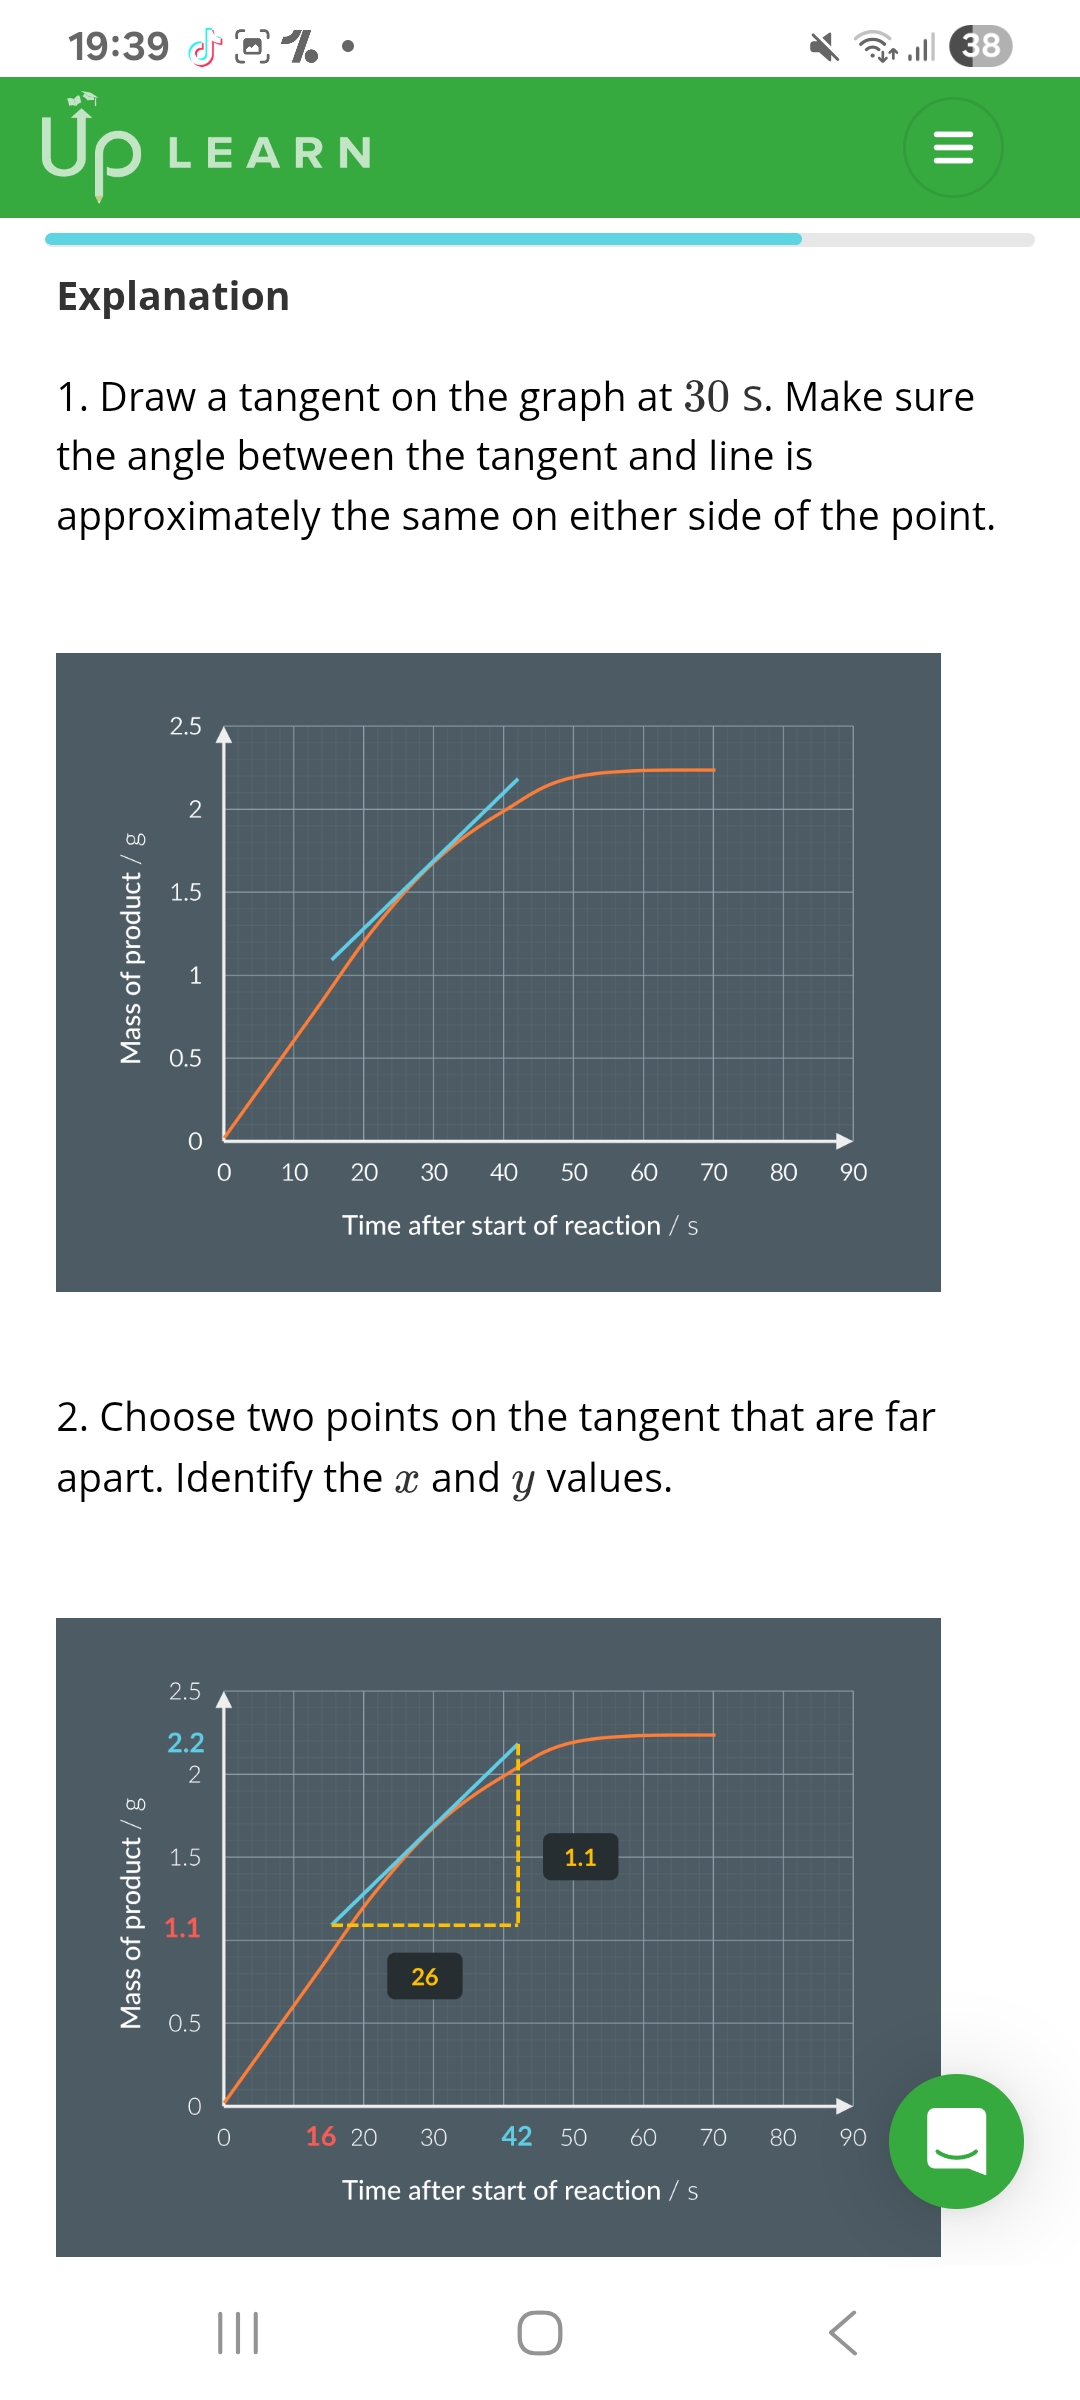
2.2 - 1.1 = 1.1
4. Calculate the change in x
42 - 16 = 26
5. Change in y = 1.1, and change in
x = 26
Substitute these into the following formula:
Rate of change = change in x =
1.1/26 = 0.04230…
= 0.04 (2 d.p)
Q2 explamation:To work out the units, substitute the y and x units into the same formula:
Rate of change units =
change in y/ change in x
Rate of change units = g/s =
g s*-1

Answer the question:
To predict what the concentration of the product will be at 60s, the student should extend the line of best fit. This is called extrapolation.