Heritability
1/16
There's no tags or description
Looks like no tags are added yet.
Name | Mastery | Learn | Test | Matching | Spaced |
|---|
No study sessions yet.
17 Terms
What are traits influenced by?
By genetic and environmental factors
Therefore what is the equation for phenotype?
Phenotype = Genotype + Environment
(P) = (G) + (E)
What makes up genotype and give examples?
Genotype = Additive effects + Non-additive effects
Additive effects = Individual effects/genes that add up (predictable and heritable so passed down to generations)
Non-additive effects = Genetic interactions that don’t simply add up
Dominance effects (interaction between SAME locus)
Epistasis effects (interaction between DIFFERENT locus)
So what is the full equation for phenotype?
P = A + D + I + E
Genotype =
A = Additive gene effect
Non-additive gene effect =
D = Dominance
I = Interaction/Epistasis
E = Environment
Heritability
What
Based on
Symbol
Types
What: Measures how much of the variation in a trait (weight, height) is due to genetics rather than environment
Degree of resemblance between relatives for a trait in a population
Based on: Breeding values or additive gene effects
Symbol: h2
Types:
Narrow sense heritability #00be3b
Board sense heritability #0084ff
Heritability: Narrow Sense Heritability #00be3b
What
Formula
Tells us
Used in
What does it mean if
h2 is high
h2 is low
What: Proportion of phenotypic variance (VP) that is due to additive genetic variance (VA)
Formula: h2 = VA / VP
Tells us:
How much of a trait’s variation is passed from parents —> offspring
How much of variation in animal’s performance is caused by breeding values (additive genetic differences)
Used in: Breeding and selection
Because only additive effects (VA) are predictable and inherited
What does it mean if:
h2 is high: Most trait variation is due to additive genetics (what you see = what’s inherited)
h2 is low: Most trait variation is due to environment or non-additive genes
Heritability: Broad Sense Heritability #0084ff
What
Includes
Formula
Shows how
Used in
What: The proportion of phenotypic variance (VP) that is due to total genetic variance (VG)
Includes:
Additive (VA)
Dominance (VD)
Epitasis/Interaction (VI)
Formula: H2 = (VG) / (VP)
H2 = (VA) + (VD) + (VI) / (VP)
Shows how: Genetically influenced a trait is (but not all can be inherited predictably)
Used in: Research
Heritability Estimates
What is the value of low heritability
Means
How can improve herd
What is the value of moderate heritability
Means
What is the value of high heritability
Means
How can improve herd
What is the value of low heritability: < 0.2
Means: Trait is mostly influenced by environment so selection is slow and difficult
How can improve herd: Through improving management/environment
What is the value of moderate heritability: 0.2 - 0.4
Means: Genetics have moderate influence
What is the value of high heritability: > 0.4
Means: Trait is strongly controlled by genetics so selection is very effective
How can improve herd: By selecting the best animals
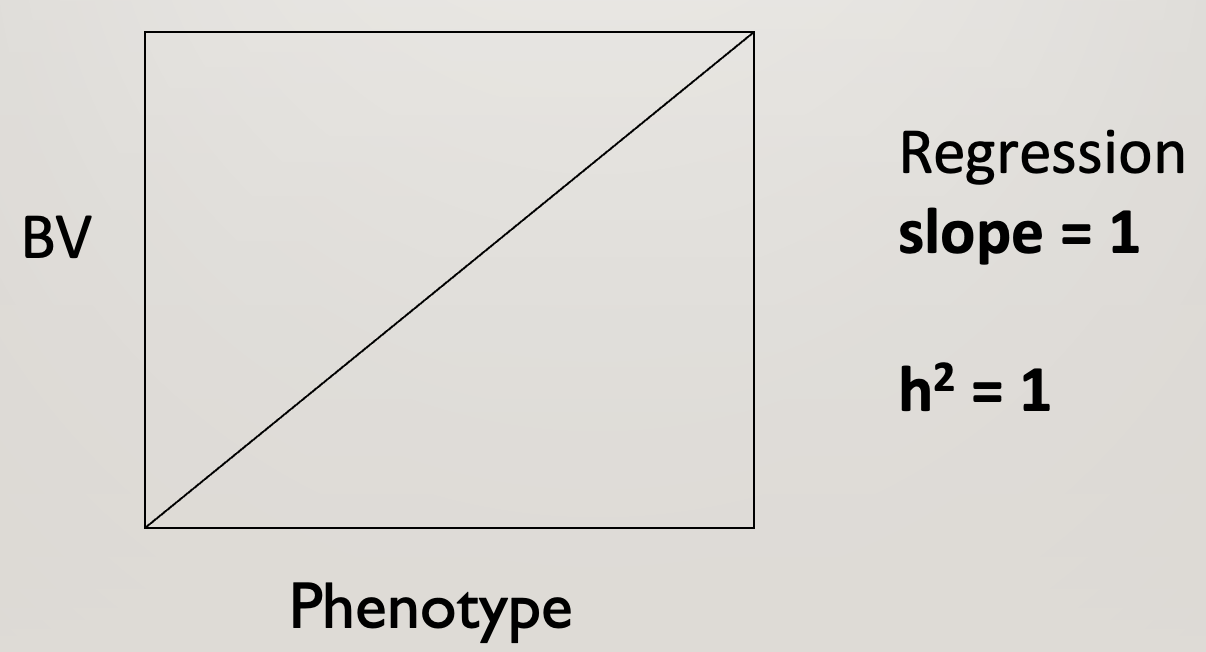
What is the slope on the graph is all phenotype is heritable
Regression slope = 1
h2 = 1
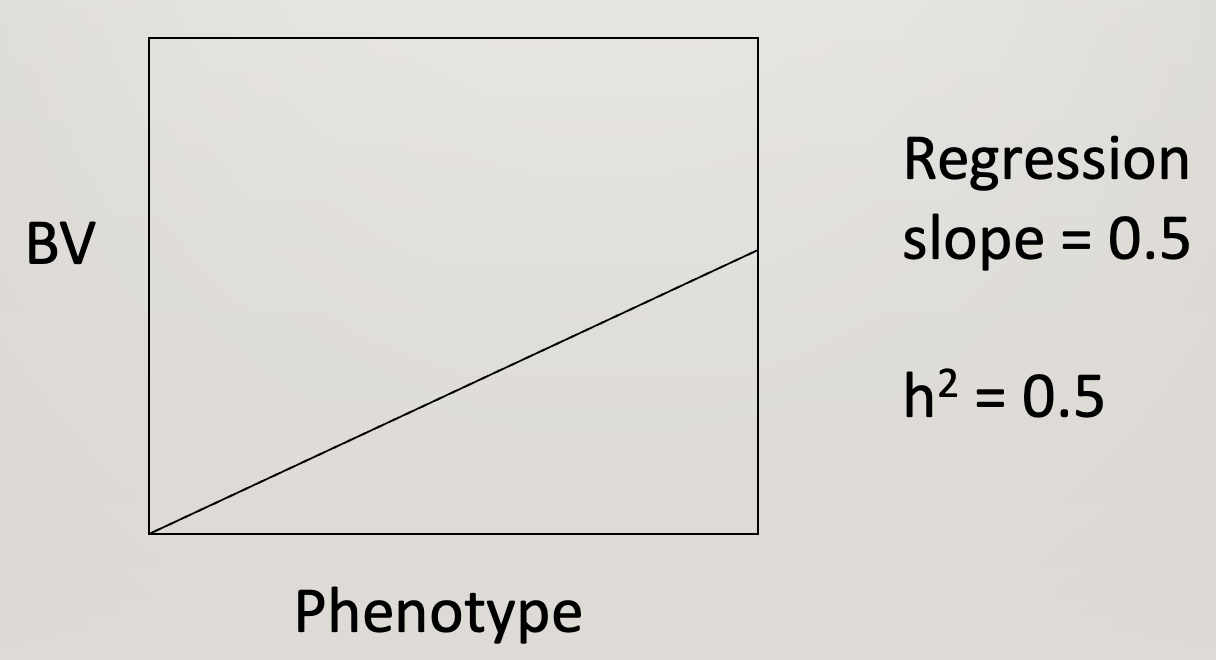
What is the slope on the graph when one half of the phenotype is heritable
Regression slope = 0.5
h2 = 0.5
What are 2 ways to estimate heritability?
Resemblance between relatives
By using information on relatives
Realised heritability
From selection carried on individuals and observe the response to selection
What are the 3 classes of relatives?
Ancestral relatives (parent and offspring)
Collateral (siblings only; full sibs and half sibs)
Both (pedigree; both ancestral and collateral)
Covariance
What
Why do relatives resemble each other
What: Between relatives is the extent the phenotype of pair of relatives or siblings vary together
Why do relatives resemble each other: Because they have more genes in common and share same environment
What does interclass (between-class) covariance mean?
Comparing values between generations
What does intraclass (within-class) covariance mean?
Looking within a group or class
Such as comparing siblings within the same family
What is the regression value for
Mid-parent & offspring
Parent & offspring
Half-siblings
Mid-parent & offspring
Regression value: h2
Why: When the average of both parents is compared to the offspring’s trait then get direct estimate of h2
Parent & offspring
Regression value: ½ h2
Why: If only one parent (sire or dam) is used, estimates only gives you half the heritability
Half-siblings
Regression value: ¼ h2
Why: Half siblings only share 25% of their genes on average
What are the 4 ways to improve heritability estimates
Make environment as uniform as possible
Have accurate measurement to minimize error
Adjust for known environmental effects
Use contemporary group (compare animals born within the same season and coming from the same herd)