Terms and Definitions for ENSC 201 Test #1 (Lectures 1-6 inclusive)
1/146
Earn XP
Description and Tags
NOTE: For the steps to performing an ERA (environmental risk assessment) there were "extra" steps in the slides not mentioned in the original outline given in an earlier slide. I have designated these "extra" steps by adding a " .5" to the preceding original step if I put them on a separate flashcard
Name | Mastery | Learn | Test | Matching | Spaced | Call with Kai |
|---|
No study sessions yet.
147 Terms
Toxicology
The study of the ways poisons interact with biological systems
Toxicant
A substance that will cause a harmful effect when administered to a living organism
Toxin
A toxicant produced by a living organism (or by a biological process)
Receptor
The organism or system affected
Hazard
The ability of a chemical to produce toxicity in the receptor (harm, adverse response)
Exposure
Pathway for substance to be transferred to a receptor (frequency, duration, route)
Risk
The probability that the hazard will occur under defined conditions (incl. exposure)
Mathematical model (of risk, hazard, and exposure)
Risk = Hazard x Exposure
Ecotoxicology/Environmental toxicology
The branch of toxicology concerned with the study of toxic effects, caused by natural or synthetic pollutants, to the constituents of ecosystems, animal (including human), vegetable and microbial, in an integral context
Roots of environmental toxicology
Roots founded in environmental and resource management, “classical” toxicology (human)
5 major differences between classical and environmental/ecological toxicology
Objective
Experimental options
Nature of concern
Dose
Test methods
Objective of classical vs environmental/ecological toxicology
Classical: Protection of humans (1 species plus a few surrogates)
Environmental/ecological: Protection of many diverse species (about 35,000,000) and ecosystem structure and function
Experimental options of classical vs environmental/ecological toxicology
Classical: Investigations limited to human surrogates (mice, rats, guinea pigs, monkeys etc),
Environmental/ecological: Organisms, model ecosystems, and real ecosystems can be subjected to direct experimentation
Nature of concern for classical vs environmental/ecological toxicology
Classical: Focus on the individual and human
Environmental/ecological: Not all species of concern are known (may protect the most sensitive or “valued” species) – effects are managed at the level of populations, communities or ecosystems
Dose for classical vs environmental/ecological toxicology
Classical: Chemical exposure is measured directly by known routes of administration; control the dose taken by the individual
Environmental/ecological: Dose is unknown, estimated indirectly through concentrations in air, water, sediment, food, etc - focus is on controlling the environment
Test methods for classical vs environmental/ecological toxicology
Classical: Methods to assess exposure, toxicity, and risk are well-developed and standardized
Evironmental/ecological: Methods are relatively new, not consistently standardized, and often must be adapted to each new species or ecosystem tested
View on environmental toxicology in history
In general, industrial activity was considered integral to prosperity and pollution was tolerated
2 types of paradigm shift (end of WWII)
Dilution paradigm – “solution to pollution is dilution”
Boomerang paradigm- “what you throw away can
come back to hurt you”
“Radium Girls”
Female factory workers who painted radium onto watch dials during early 1920s (US Radium Corporation); suffered “suspicious” deaths or illness due to radium poisoning
“Great Smog” of London, England (Dec. 1952)
Period of cold weather (lots of coal burning) and anticyclone weather event (inversion trapping air) resulting in smog
4000 deaths (100,000 illnesses)
Leads to Clean Air Act – phase out of coal burning
Cause of “Modern Environmental Movement”
The publication of Rachel Carson’s “Silent Spring” in 1962
Result of “Modern Environmental Movement”
Public, the scientific community and legislative
bodies gained awareness of the potential for harm from chemical substances in the environment
Formal scientific study of adverse environmental effects of chemicals begins
Environmental activists had a role in these phenomena
Result of industry and government boom (1960s-80s)
Exponential increase in the number of synthetic industrial chemicals
Agricultural chemicals
Industrial chemicals
Therapeutic drugs
Increase in litigation
Mandatory testing and regulation
Result of growth of environmental technology (1960s-80s)
Analytical chemistry and monitoring technologies advanced
i.e gas chromatography with new detectors
Monitoring shows sources, enables regulation
Local or “point source” releases of pollutants mostly understood and regulated
Diffuse pollution remains issue (long range transport
8 principles from Canadian Environmental Protection Act (CEPA) (1999)
Sustainable development
Pollution prevention
Virtual elimination
Ecosystem approach
Precautionary principle
Intergovernmental cooperation
Polluter-pays principle
Science-based decision making
Sustainable development (CEPA)
Development that meets the needs of the present without compromising the ability of future generations to meet their own needs
Virtual elimination (CEPA)
Reduction of releases to the environment of a substance to a level below which its release cannot be accurately measured
Precautionary principle (CEPA)
Where there are threats of serious or irreversible damage, lack of full scientific certainty shall not be used as a reason for postponing cost- effective measures to prevent environmental degradation
Science-/evidence-based decision making (CEPA)
Integral role of science and traditional aboriginal knowledge (where available) in decision-making and that social, economic and technical issues are to be considered in the risk management process
How toxic effects begin
Reaction between a chemical and some component of living tissue
Xenobiotic
Foreign to the body
Anthropogenic
Human-made
How toxicity is assessed
By toxicity tests (conducted in a laboratory) which expose groups of organisms to a range of doses/concentrations for a set period of time and record their responses
3 characteristics of toxicity tests
Controlled experiments
Rapid, relatively inexpensive
Often conducted with individual substances
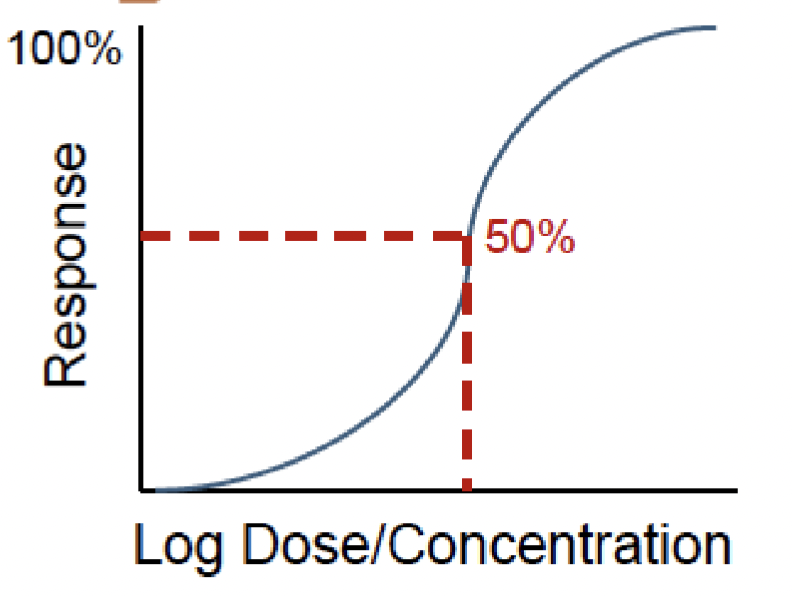
Dose-/exposure-response relationship
The quantitative relationship between exposure and measure of damage to organism or groups of organisms
2 variables in dose-/exposure-response relationship
Dose
Response
2 assumptions of dose-response relationship
Response is due to the toxicant
Response is related to the amount of exposure (dose/concentration)
2 types of standardized test methods for dose-response relationships
Extrapolate from one species to another
Similar to human toxicology; mice/rats are surrogate species to humans
Standard tests with select species
E.g. Environment and Climate Change Canada
biological test methods
4 toxicant routes of exposure
Inhalation
Ingestion
Dermal
Injection (into tissues or body fluid)
Inhalation
Toxicant inhaled into pulmonary system, lungs
Ingestion
Toxicant ingested into gastro-intestinal system, gut
Dermal
Toxicant interacts with surface of organism, skin
2 TYPES
2 types of toxins absorbed by dermal absorption
Lipophilic molecules (diffuse through the lipid-rich bilayer of the cell membrane)
Large lipophilic molecules —> steric hindrance
Small uncharged polar molecules (diffuse through the cell membrane)
CO2, glycerol and H2O —> Depends on chemical gradient; slow
Dose
Amount of toxicant taken up by organism (internal)
Concentration
Amount of toxicant in external media (e.g. water, soil, air)
Acute exposure
Short duration (< 96 h), often single dose
Chronic exposure
Longer duration, continuous exposure to toxicant
2 axes of toxicity tests graphs
Exposure (x axis)
Response (y axis)
2 ways data is collected for dose-response graph
Quantal response (All-or-none (e.g. death, cancer))
Graded response (Variable degree (e.g. heart rate, respiration))
Endpoint
Quantifiable response related to exposure
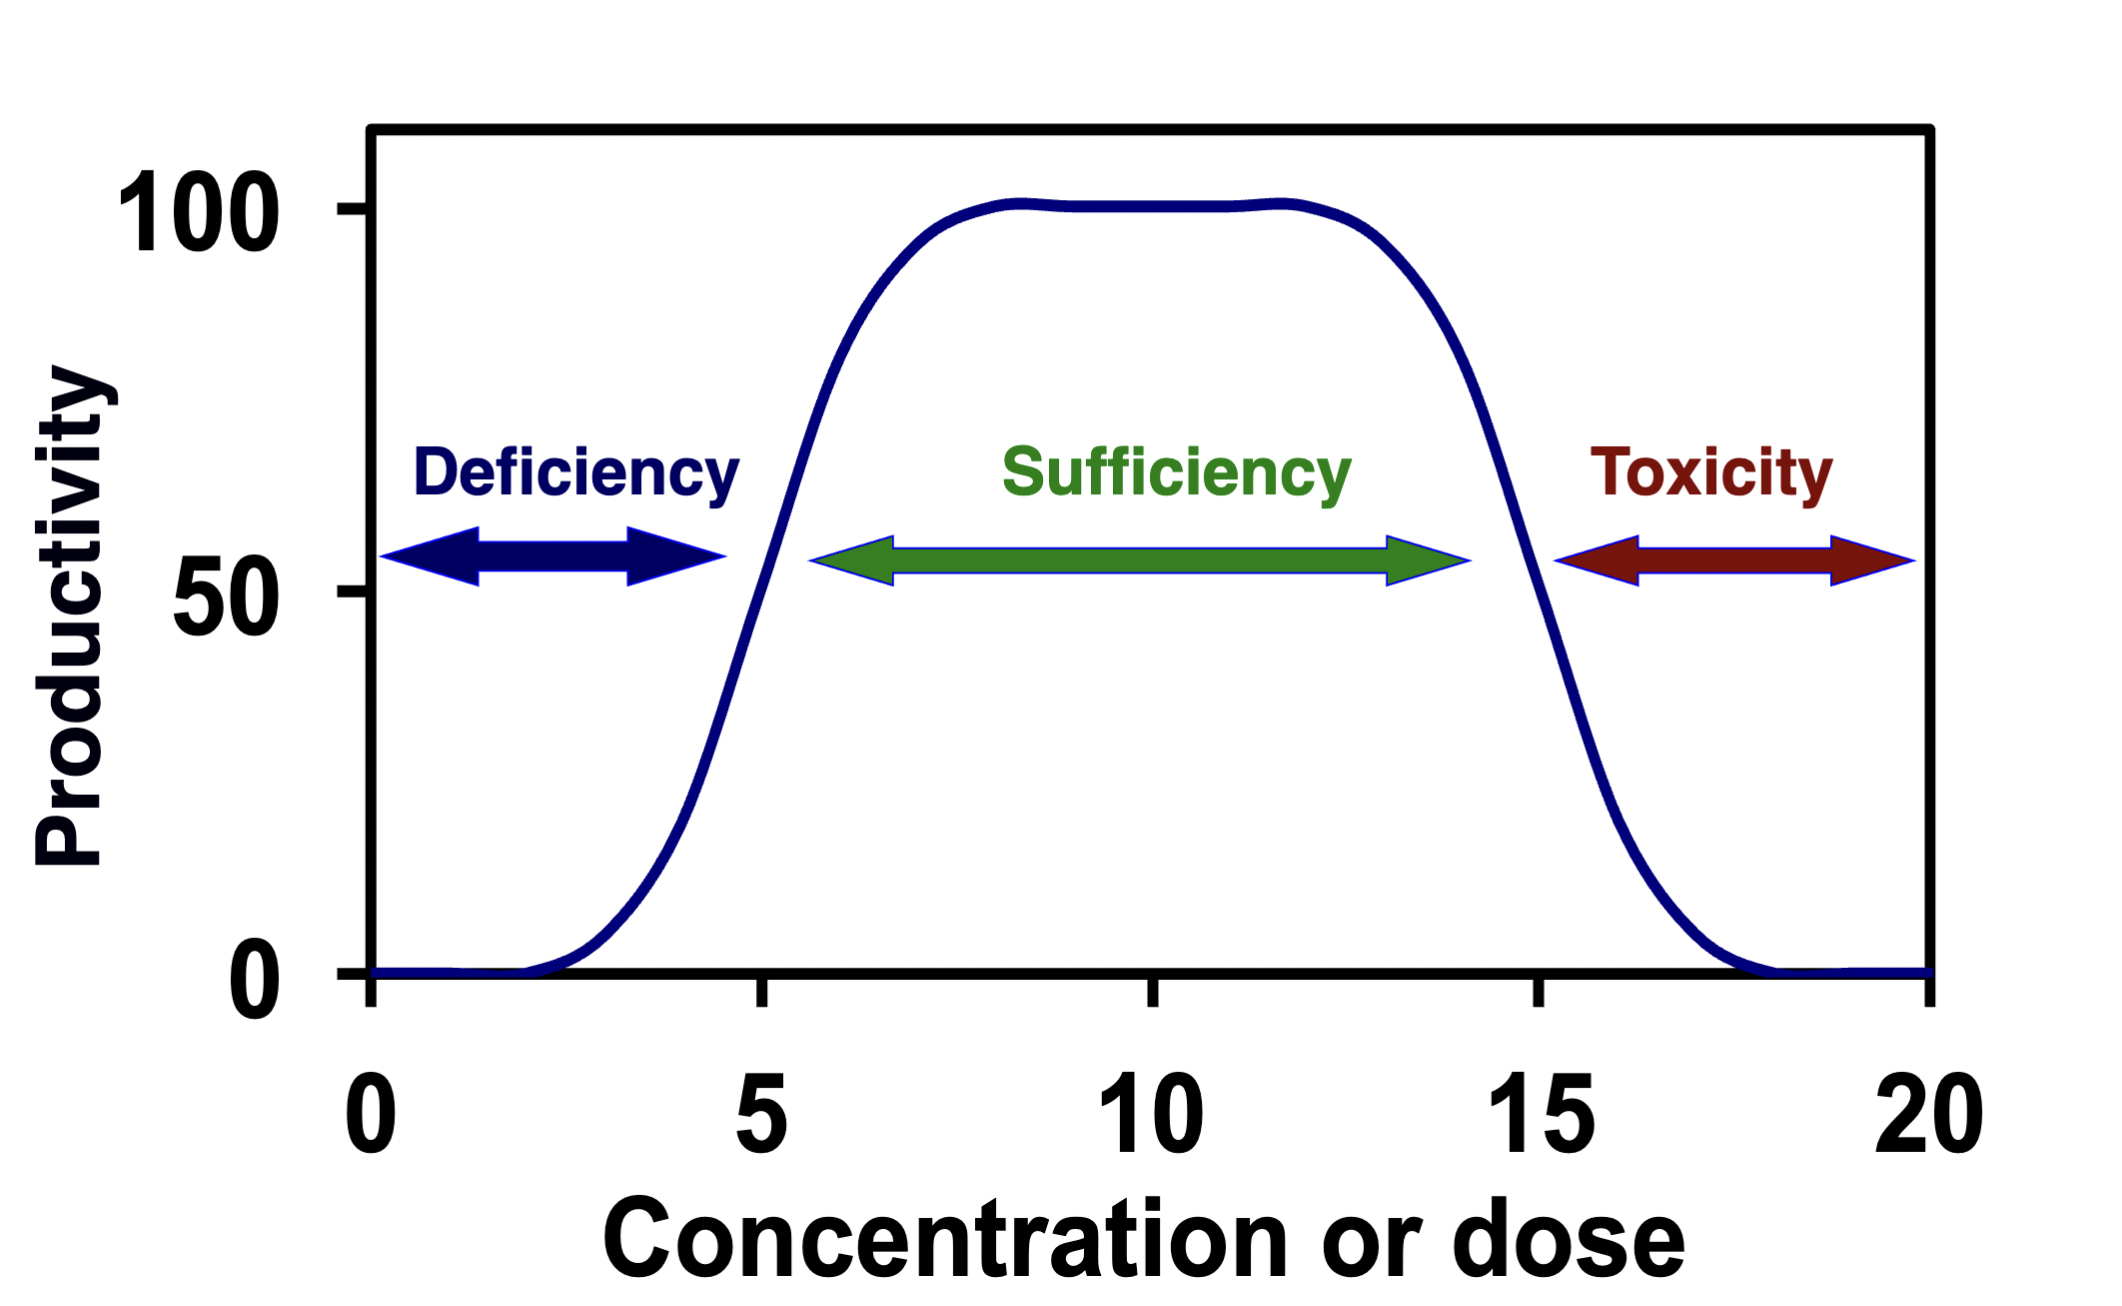
Nutrient
A substance that is needed for growth
Nutrient graph
Non-nutrient graph
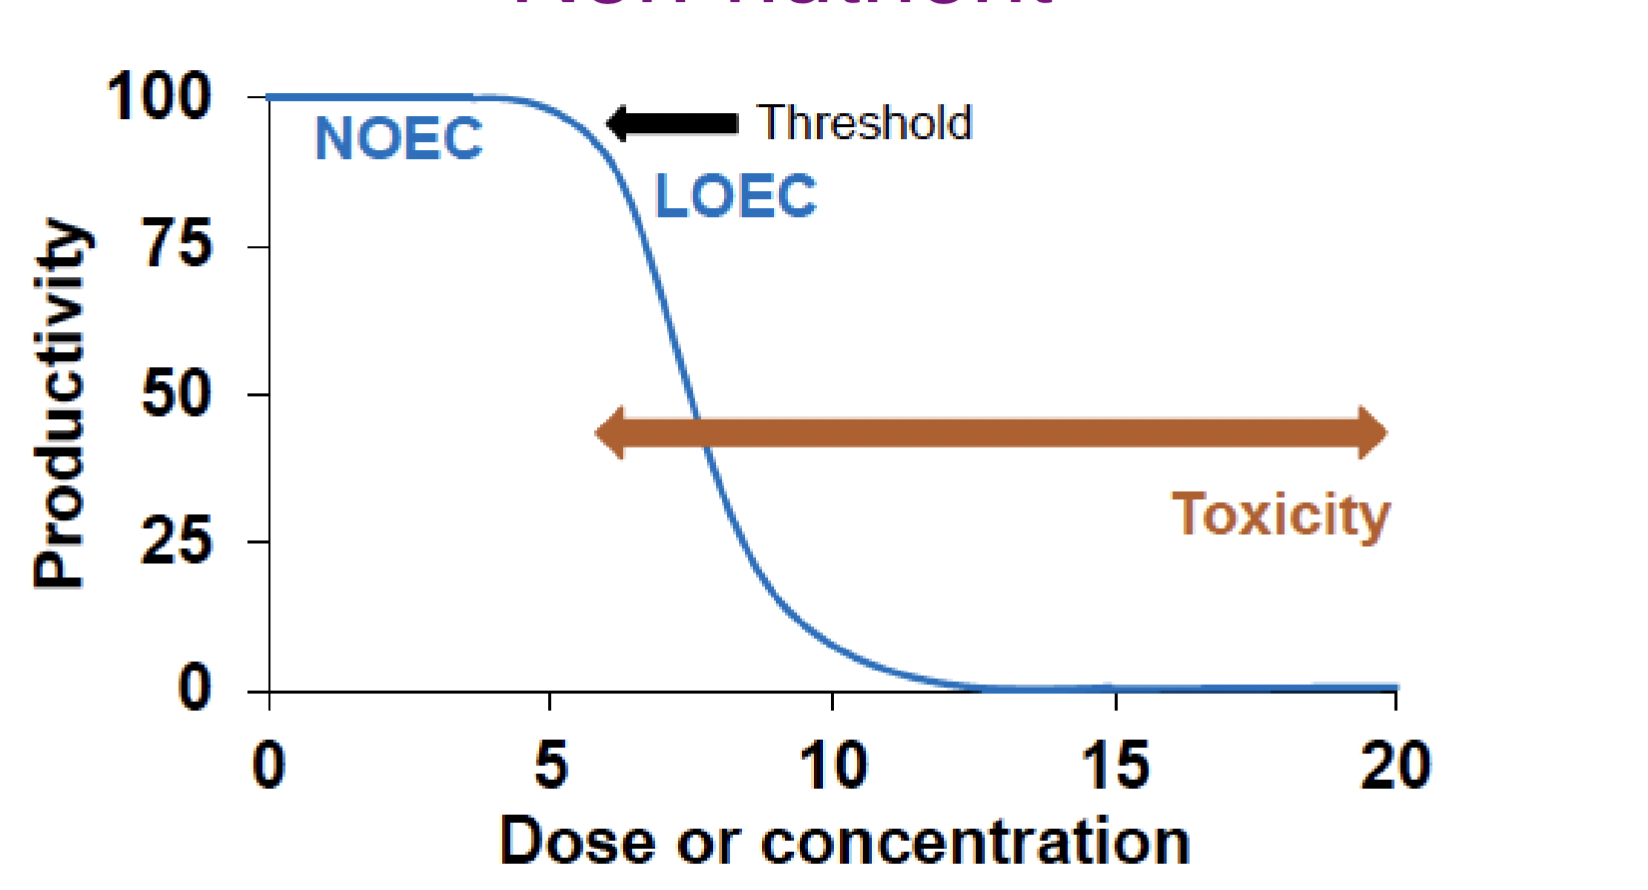
NOEC (No Observed Effect Concentration)
Highest concentration where no effects are observed
Identical to control
LOEC (Lowest Observed Effect Concentration)
Lowest concentration that is significantly different from the control
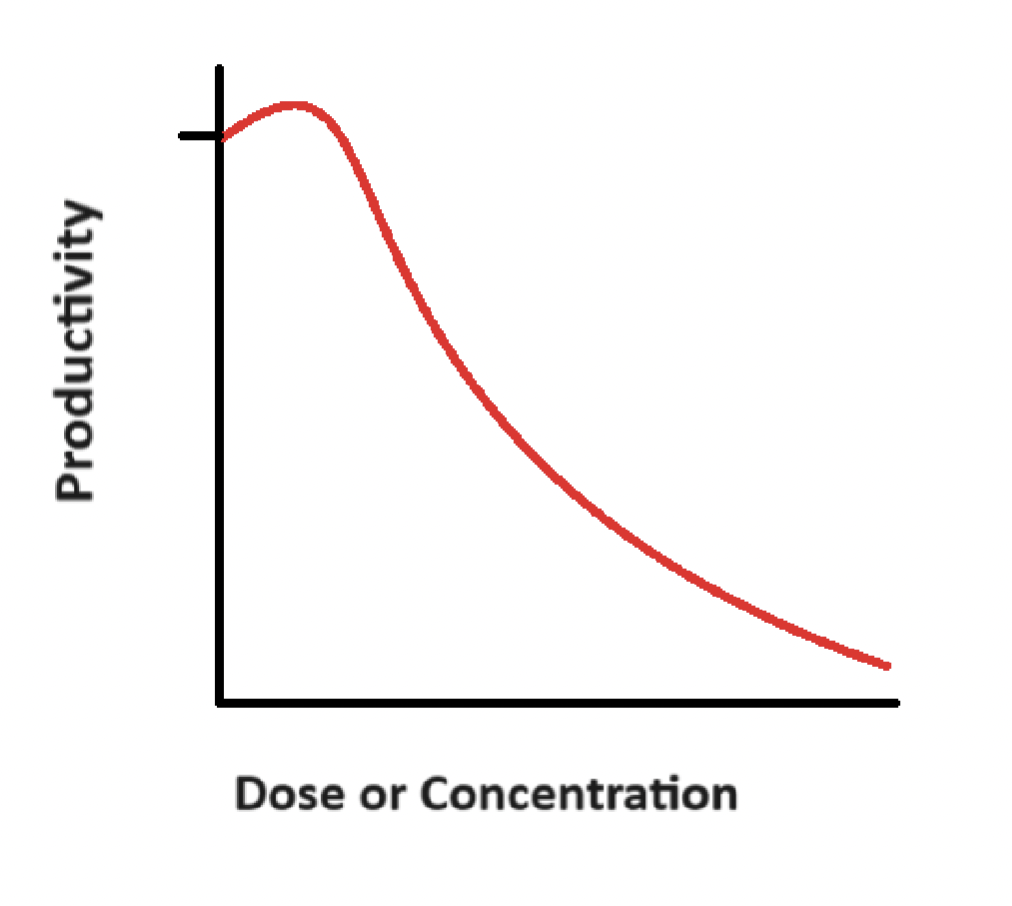
Hormesis
A harmful substance gives stimulating/beneficial effects to living organisms in small quantities
LD50 (median lethal dose)
Toxicant dose that kills 50% of test population at time t
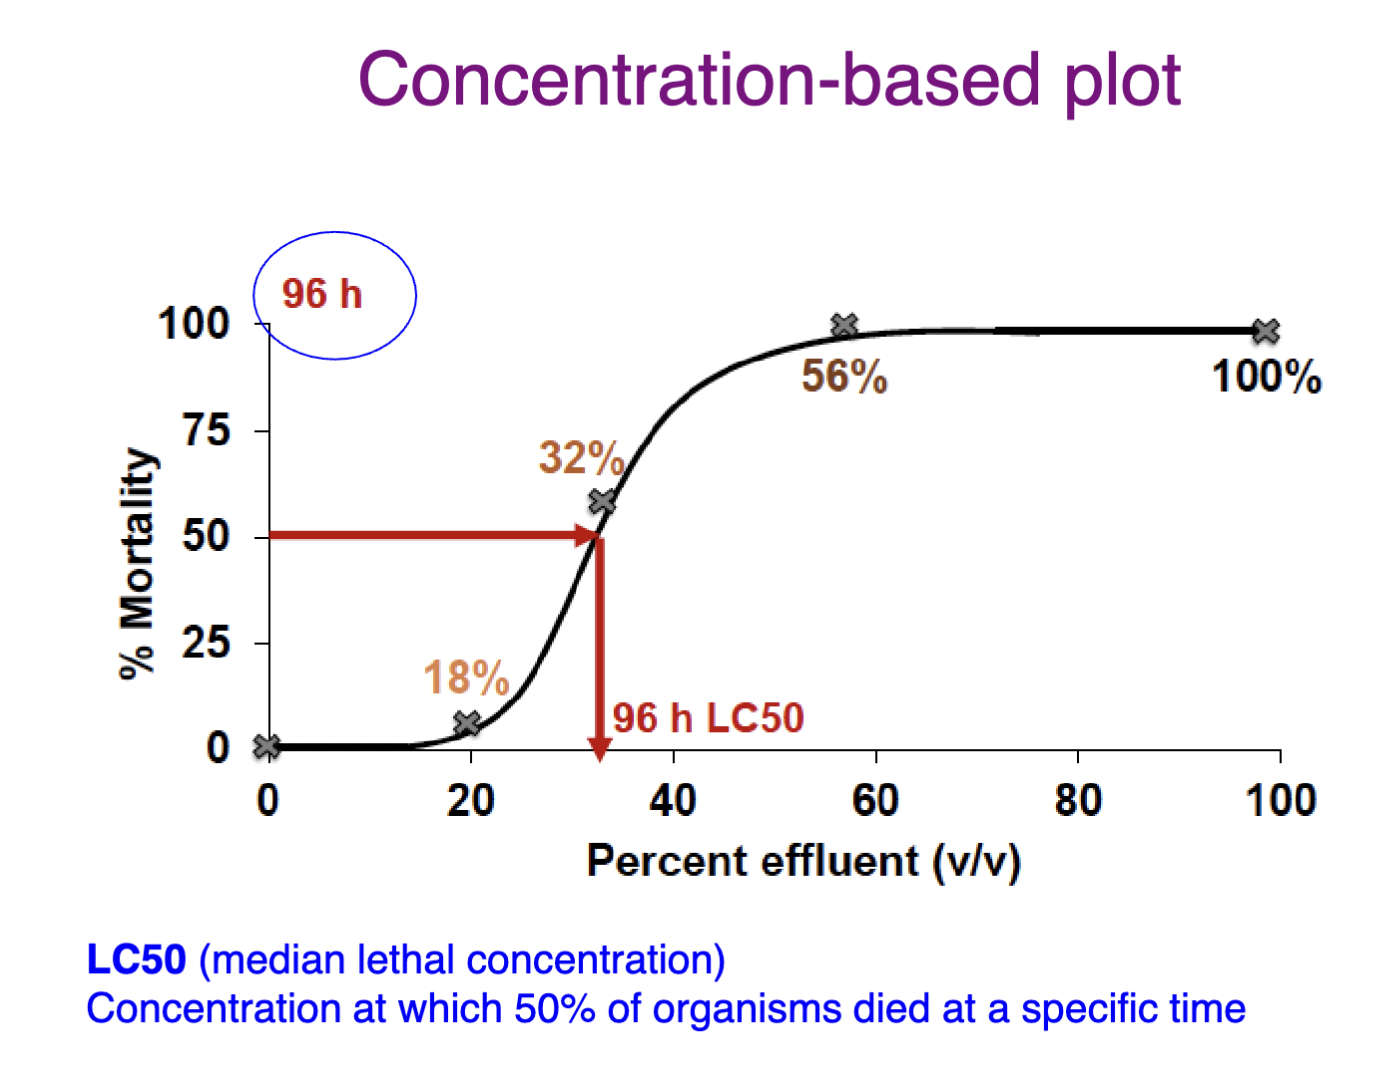
LC50 (median lethal concentration)
Toxicant concentration that kills 50% of test population at time t
ED50 (median effective dose)
Toxicant dose that caused a response in 50% of the population at time t
EC50 (median effective concentration)
Toxicant concentration that caused a response in 50% of the population at time t
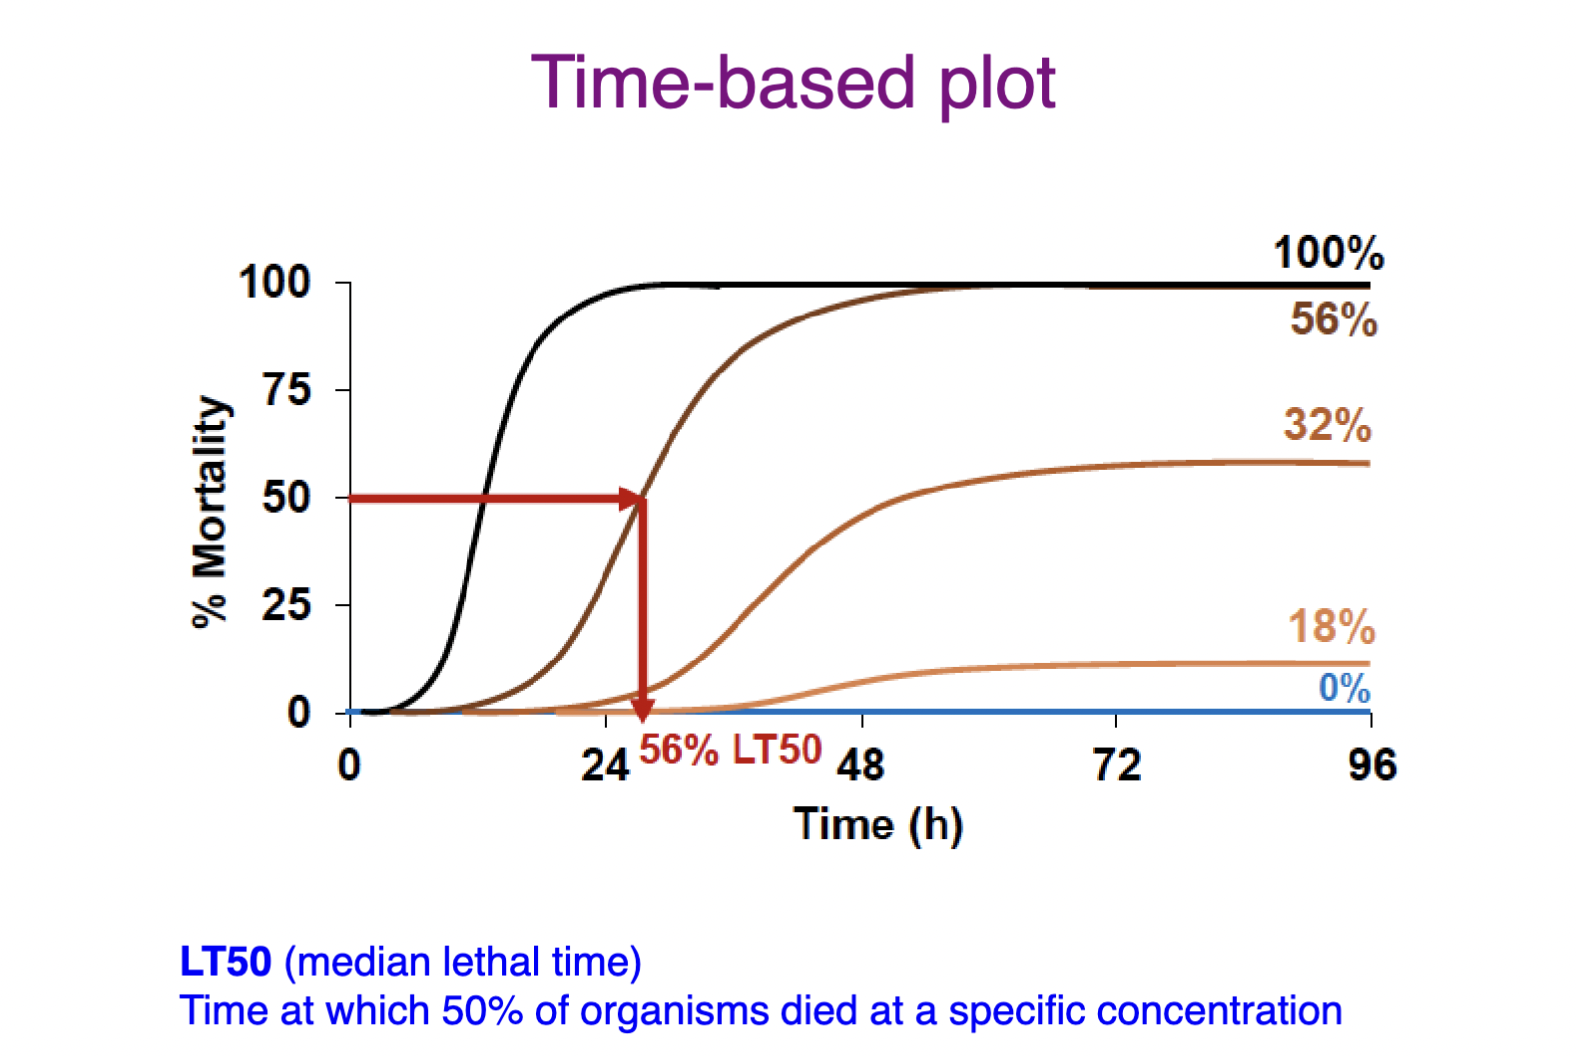
How to express toxicological values (e.g LC50, EC50)
Need to include the duration of exposure time (t) with endpoint values (e.g. 96 h LC50 = 32 mg/L)
2 ways to plot toxicity data
Time-based plot
Dose/concentration-based plot
Time-based plot
One test concentration over time
x-axis = time
y-axis = response
Dose/concentration-based plot
Multiple concentrations at fixed time period
x-axis = dose/concentration
y-axis = response
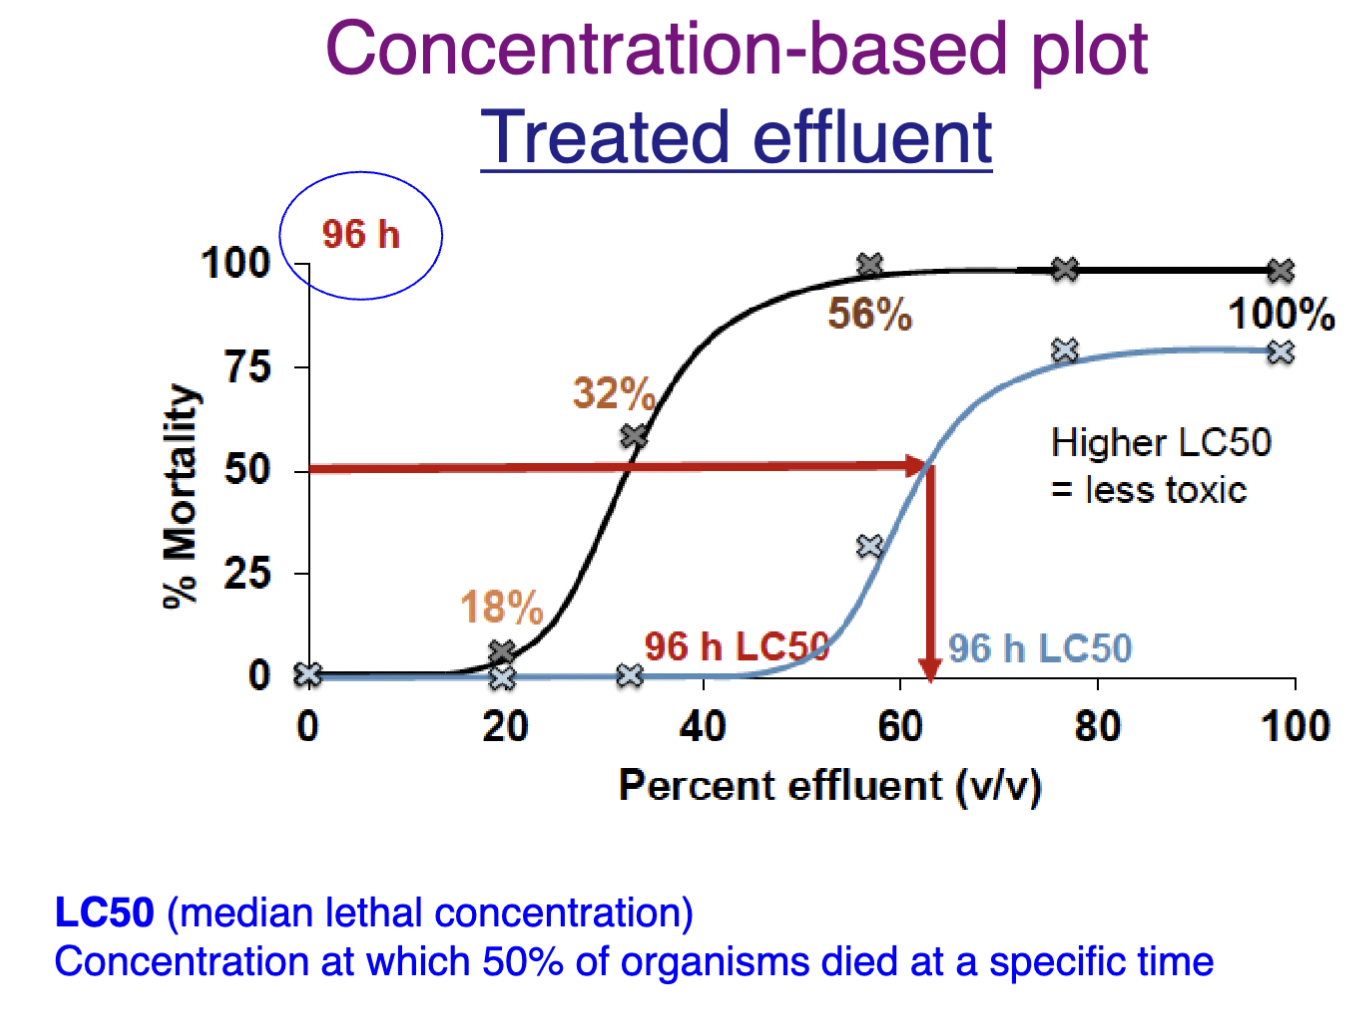
How LC50 relates to toxicity
HIGHER LC50 = LESS toxic
4 reasons why toxicity testing is important
Standardized assessment of chemicals/effluents
Basis for monitoring effluent/environmental quality
Provides data for setting standards to limit environmental levels of contaminants
Responses can predict ecological response
Disadvantage of labratory-based testing
Toxicity testing under realistic conditions is much more complex than determining the effects of single substances on single species under controlled laboratory conditions
2 kinds of model ecosystems
Microcosms
Mesocosms (i.e experimental ponds)
Unique approach for environmental toxicology
Biological indicators and biological monitoring can be used
Indicator species
Species sensitive to some factor(s) of concern (e.g. acidity, air pollution)
Change in distribution or density of indicator species
Cannot always be quantitative but may show trends
Biochemical markers
The subcellular response of the living organisms is used to indicate the effect of a substance, departure from normal status
Bioindicator examples: Heat shock protein (HSP), Cytochrome P450, Metallothionein
Mixture toxicity
Many contaminants are found in mixtures (i.e petroleum hydrocarbons, PCBS) so we must account for joint effects of contaminants in mixtures
4 types of joint effects in mixture toxicity
Potentiation
Additivity
Synergism
Antagonism
Potentiation
The activation of a contaminant that is normally non-toxic by itself
Additivity (2 kinds)
Concentration additivity- toxicants have same mode of action so effect is calculated as the sum
Response additivity– toxicants have different mode of action, but similar effects so not always predicted by summing the effects
Mode of action
Low-level cellular changes to function or anatomy due to the action of a toxicant on an organism
Synergism
The effect of the mixture is greater than the sum of each toxicant
Antagonism
The effect of the mixture is less than the sum of effects of each contaminant
Some challenges with animal testing
Expensive
# of substances
Results not always transferable
Ethics
3 R’s of Animal Use Alternatives
Replacement (e.g., cell lines, tissues, computer modeling)
Reduction
Refinement (modifications to procedures to reduce animal suffering)
Risk assessment
Process to estimate the probability of adverse effects following the use/release of a pollutant (retroactive and proactive)
Retroactive risk assessment
Assessment of risk of an existing contamination
Proactive risk assessment
Proactive process that deals with planned or proposed release of waste/effluent
2 components of risk assessments
Human health risk assessment
Ecological risk assessment (ERA)
4 steps of an ecological risk assessment (ERA)
Problem formulation
Exposure assessment
Hazard assessment
Risk characterization
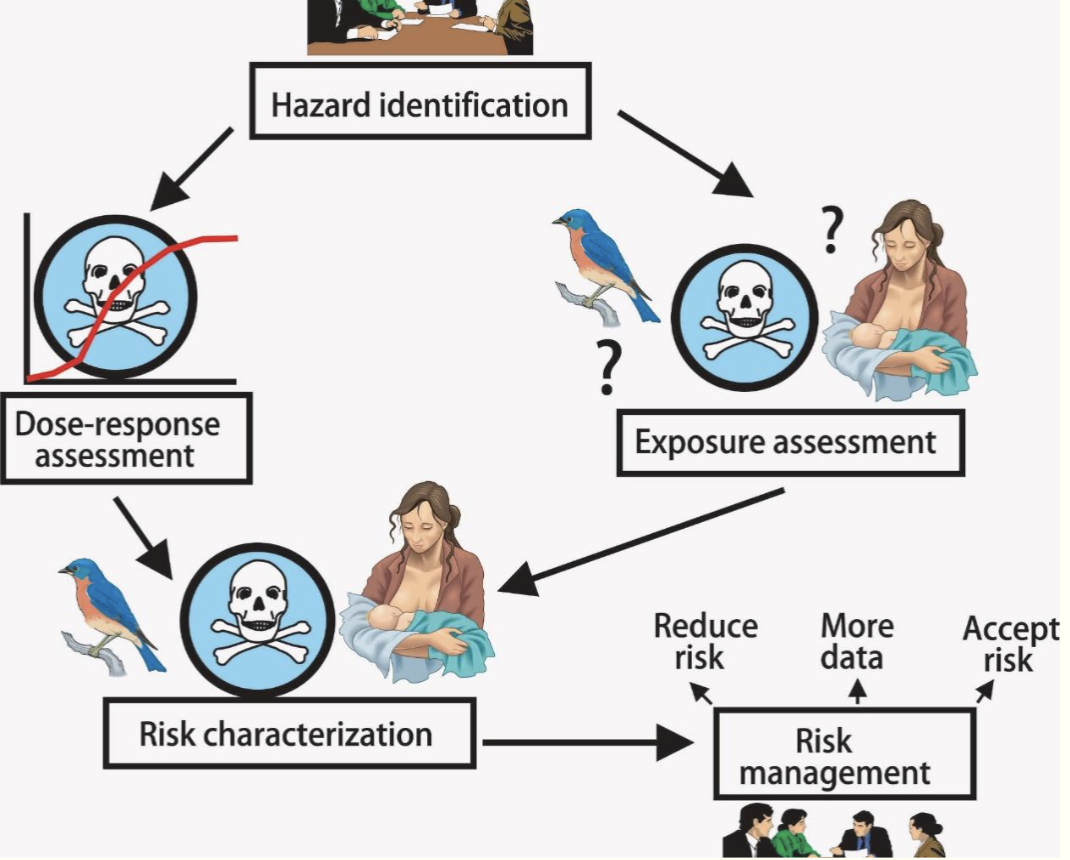
Problem formulation (Step 1)
Frame the project, including final goals and nature of potential adverse effects
Formulate approaches and tools used to assess risk
5 key things to consider
5 key things to consider in problem formulation (Step 1)
Site-management goals (e.g., restoration for parkland use)
Regulatory context for the site
Review historical site information— look at site description, use, ecological or traditional significance
Determine fate of contaminants of concern (COC)
Clarify protection goals and associated acceptable effect levels
Site description (Step 1.5)
Site size, contamination sources and fate
Point-source vs non-point source
Geography of site to determine the transport of COCs
Concentrations of COCs and relevant guidelines/ background levels
Wildlife survey and review (e.g., interviews, monitoring)
Identify important species, such as keystone species, species at risk
Build conceptual site model (CSM)
Exposure assessment (Step 2)
Determine how organisms in the ecosystem will be exposed to contaminants (e.g in air, soil, sediment, food)
Assess degree of exposure (total dose of contaminants for each receptor in the ecosystem)
Use methods to estimate exposure doses (abiotic and biotic)
2 methods to estimate exposure doses (abiotic and biotic)
Direct – less uncertainty, many parameters cannot be estimated (soil pH), site-relevant information
Estimation using models – more variability, relies on information from other sites that may not be relevant
Hazard assessment (Step 3)
Characterize expected effects due the exposure concentrations (previously determined)
Determine toxicity reference value (direct vs indirect)
Develop site-specific remediation objective (below the TRVs)
Toxicity reference value (TRV)
The dose/concentration expected to cause a unacceptable level of effect in the receptor (can be direct or indirect)
Types of studies used for toxicity reference values (TRVs)
Site-specific controlled study
Site-specific field study
Indirect field and control studies
4 pros of site-specific controlled studies
Directly test toxicity of media from a site by controlling variables (i.e temp and lighting)
Precise and specifically relevant to the site
Contaminant mixtures are directly addressed
Remedial goals may be determined with higher confidence
3 cons of site-specific controlled studies
Sample preparation may alter the media (affecting form and bioavailability)
If using a surrogate species, hard to determine accuracy of sensitivity prediction
Acute vs chronic study limitations
4 pros of site-specific field studies
Highest relevance to site
Takes into account spatial distribution and bioavailability of the COCs
Compliment lab studies
Reduce uncertainty and reliance of some assumptions (i.e predator-prey relationships, migration)
2 cons of site-specific field studies
Time and scale are limiting factors
Other factors such as competition can make it difficult to detect sublethal effects
2 pros of indirect field and control studies
Compiles data from pre-existing studies
Used to estimate TRVs for receptors at the site
4 cons of indirect field and control studies
Hard to find data for mixtures relevant to the site
Test species irrelevant to site
Abiotic factors not relevant to site
Degree of biotransformation / weather of contaminant differs from site
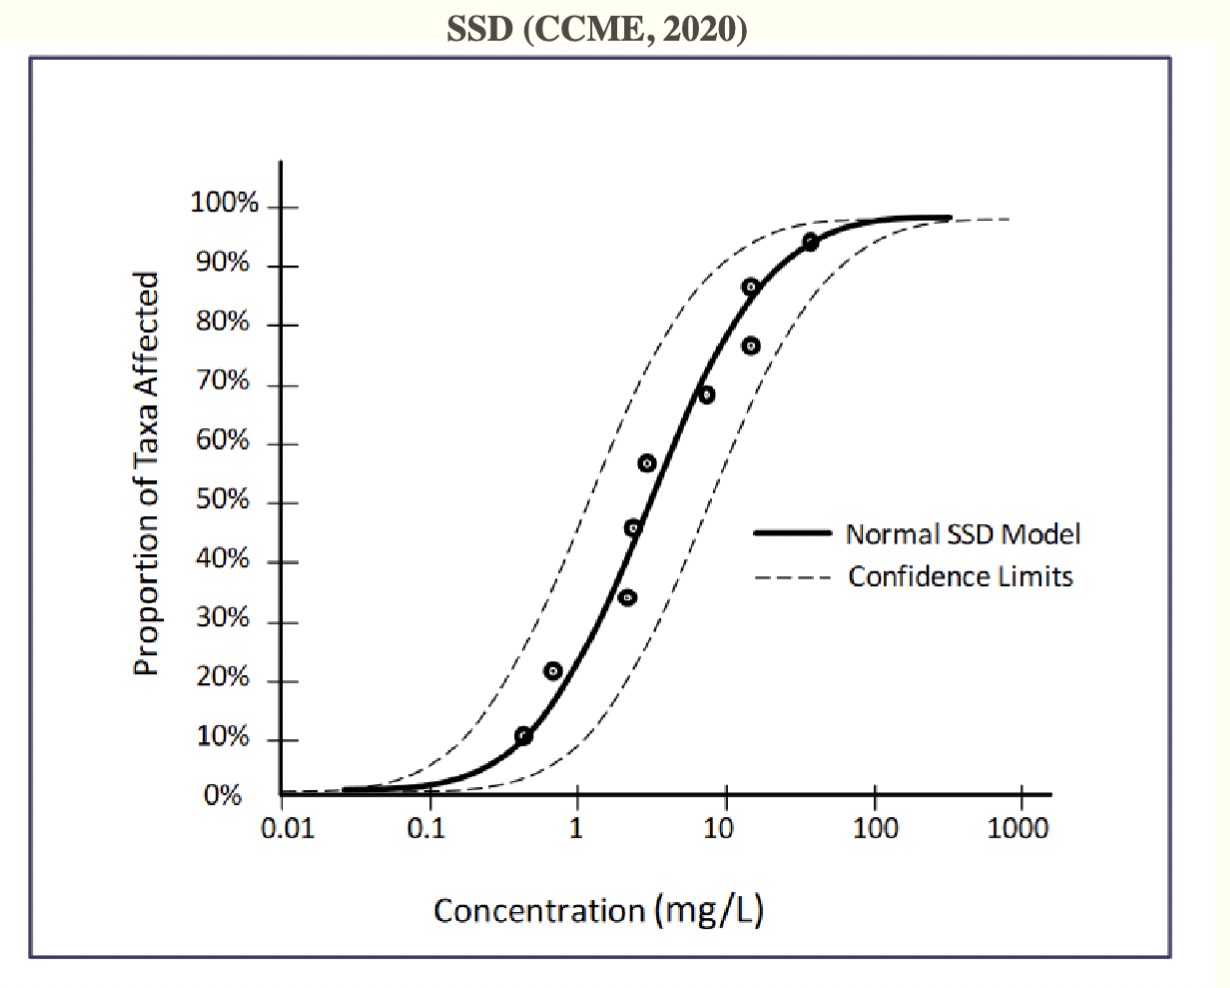
Use of Species-Sensitivity Distributions
TRVs can be used to create SSDs in order to determine acceptable effect levels (AEL)
