UCI Stats 7 Terms + Formulas
1/67
There's no tags or description
Looks like no tags are added yet.
Name | Mastery | Learn | Test | Matching | Spaced |
|---|
No study sessions yet.
68 Terms
Statistics
a collection of procedures and principles for gathering data and analyzing information to help people make decisions when faced with uncertainty
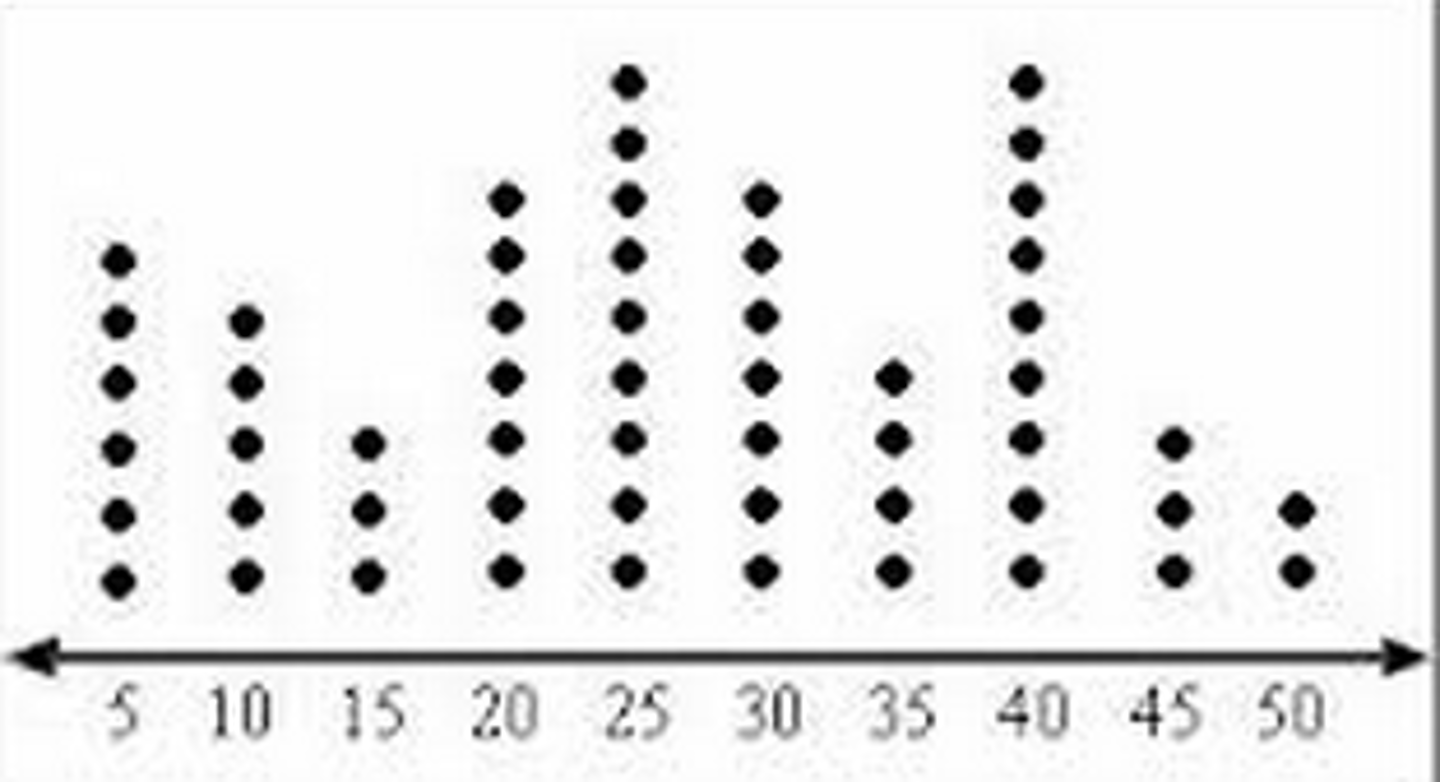
Dotplot
graphs a dot for each data value on a number line. easy to see individual data values, easy to make, but gets cluttered with large sample size
Summary Statistics
statistics that summarize a great deal of numerical information about a distribution, such as the mean and the standard deviation
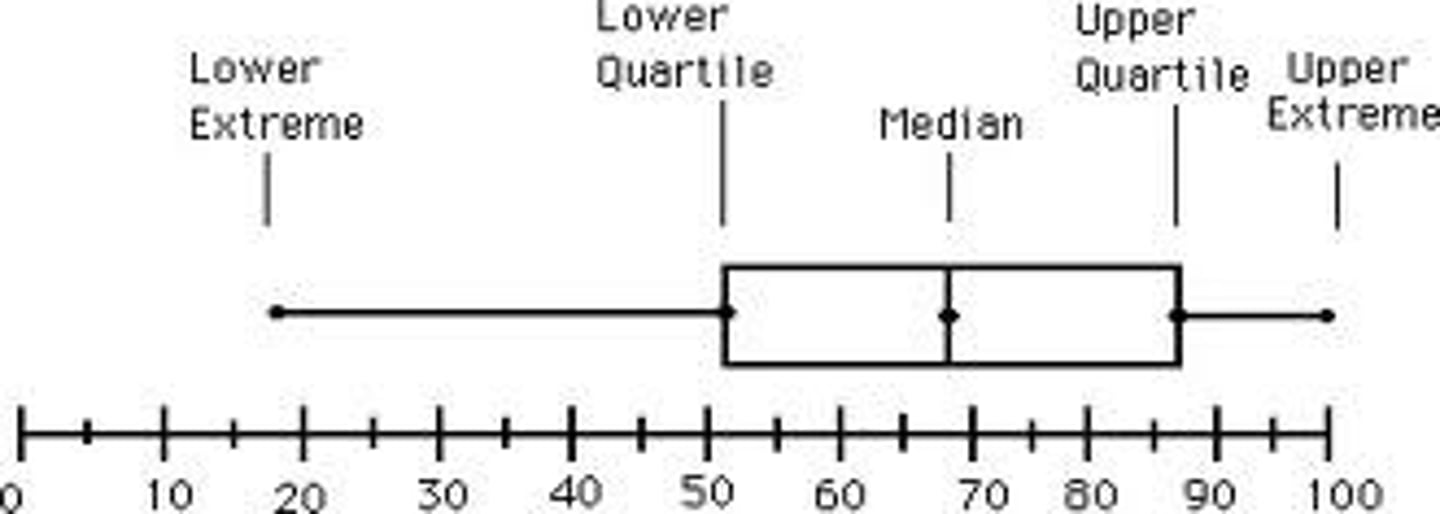
Five-Number Summary
minimum, Q1, median, Q3, maximum
Data
plural word referring to numbers or non-numerical labels collected from a set of entities (people, cities, etc)
Median
middle value of a numerical list
Lower Quartile
median of the lower half of a numerical list
Upper Quartile
median of the upper half of a numerical list
Rate
the number of times something occurs per number of opportunities for it to occur
risk
likelihood of a bad outcome that can be estimated using the past rate for that outcome
base rate/baseline risk
the rate/risk at a beginning time period or under specific conditions
Random Sample
subset of the population selected so that every individual has a specified probability of being part of the sample
Population of Interest
collection of all individuals about which information is desired
Sample Survey
a survey where investigators gather opinions or other information from each individual included in the sample
Poll
investigators gather opinions or other information from each individual included in the sample
Margin of Error
a number added to and subtracted from the sample information to produce an interval that is 95% certain to contain the true value for the population
Margin of Sampling Error
margin of error in polls, term used to distinguish it from other sources of errors and biases that can distort results
Nonparticipation bias (nonresponse bias)
many people who are selected for the sample do not respond to key survey questions or at all. people who actually participate are those who feel strongly about issues.
Self-Selected Sample (Volunteer Sample)
sample size chosen by people who want to do it, not randomly
Observational Study
a study in which participants are merely observed and measured
Variable
a characteristic that differs from one individual to the next. may be numerical or categorical
Confounding variables
variable that is not the main concern of the study but may be partially responsible for the observed results
Randomized Experiment
study in which treatments are randomly assigned to participants
Treatment
specific regimen or procedure assigned to participants by the experimenter
Random Assignment
each participant has a specified probability of being assigned to each treatment
Placebo
pill or treatment designed to look like active treatment but with no active ingredients
Statistically Significant
a difference large enough to be unlikely to have occurred in the sample if there was no relationship or difference in population. does not necessarily have practical significance or importance
Practical Significance (Practical Importance)
a statistically significant difference that actually matters greatly
Multiple Testing (Multiple Comparisons)
refers to the fact that researchers often test many different hypotheses in the same study
false positive (data snooping)
when researchers do multiple comparisons, they can get statistically significant findings by mistake
Process of Discovery
1. asking the right questions
2. collecting useful data, which includes deciding how much is needed
3. summarizing and analyzing data, with the goal of answering the questions
4. making decisions and generalizations based on observed data
5. turning the data and subsequent decisions into new knowledge
Raw Data
numbers and category labels that have been collected but have not yet been processed in any way
Observational Unit
single individual entity (ex. a person) in a study
Observation
individual measurement of an observational unit
Sample Size
total number of observational units
Dataset
complete set of raw data
Census
data is collected from all members of a population
Sample Data
collected when measurements are taken from a subset of a population
Population Data
collected when all individuals in a population are measured
Statistic
summary measure of sample data
Parameter
summary measure of population data
Categorical Variable
data consisting of group or category names. no logical ordering
Ordinal Variable
categorical variables that can be ordered (ex. drink sizes from small to large)
Quantitative Variable (Measurement Variable/Numerical Variable)
data consisting of numerical measurements or counts. does not include numbers that do not follow an order (ex. Social Security numbers)
Continuous variable
every value within some interval is a possible response. does not skip numbers, even the ones with really long and ugly decimals
Explanatory Variable
independent variable (x) helps explain response variable but does not always have a causal relationship
Response Variable (Outcome Variable)
dependent variable (y)
Distribution
describes how often possible responses occur
Frequency distribution
used for categorical variables, lists frequencies (how often it occurs) for all categories
Relative frequency distribution
lists categories similar to a frequency distribution but counts by percentages/proportions
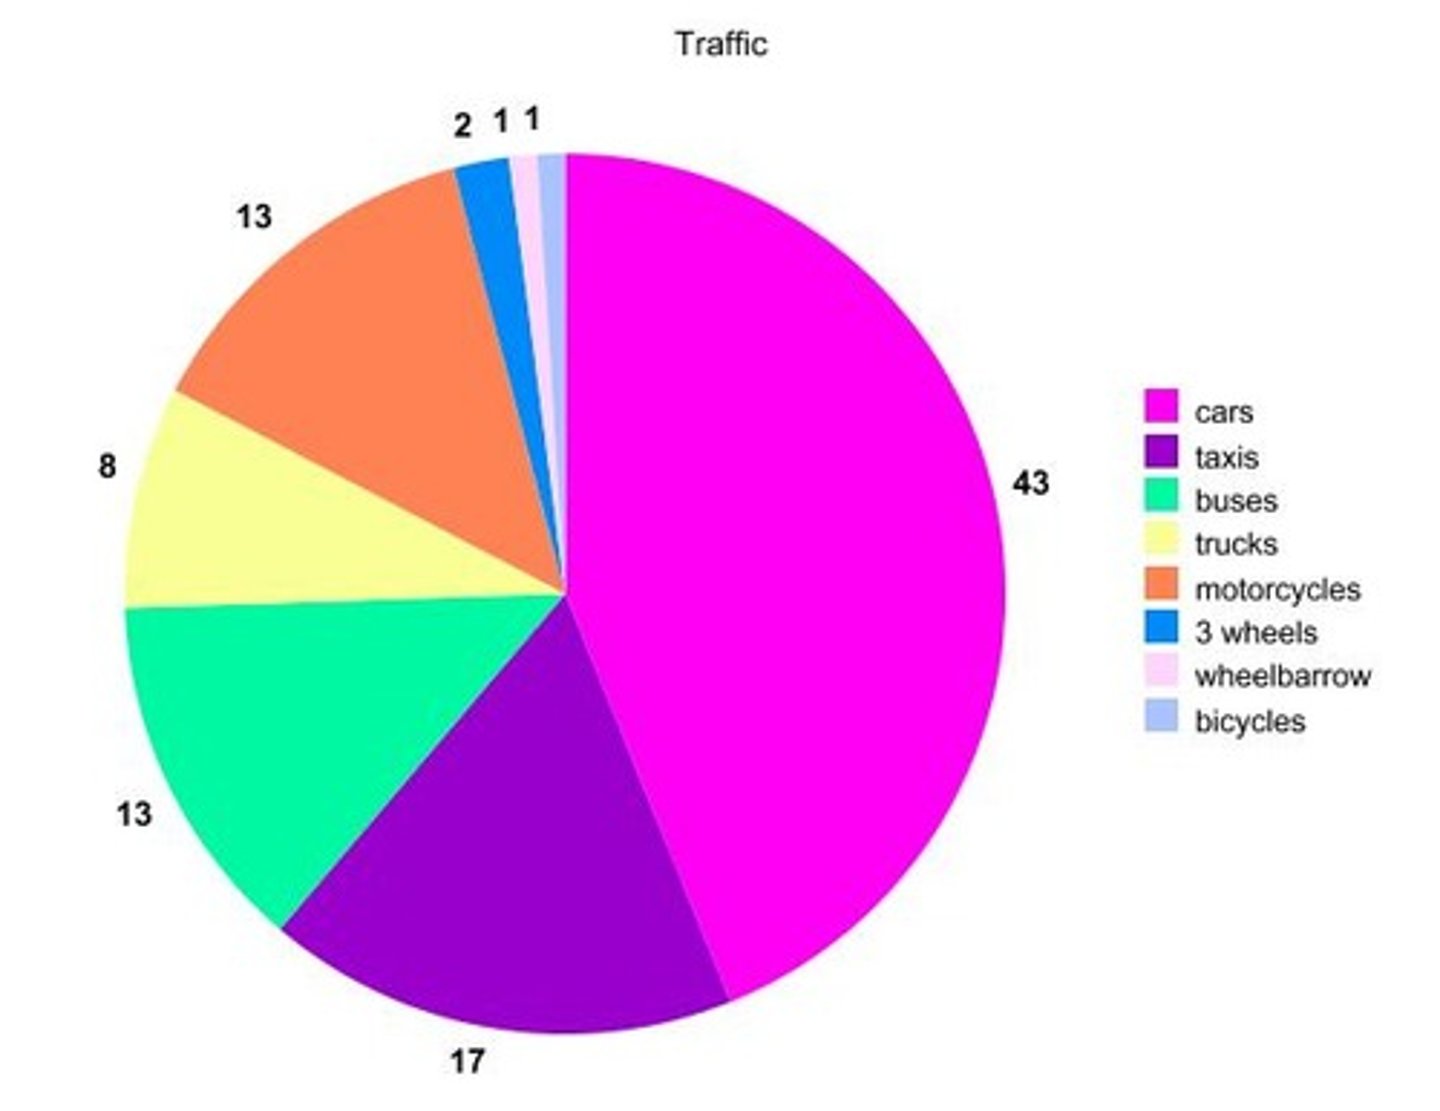
Pie Chart
used for a single categorical variable if there are not too many categories
Bar Graphs
summarizes one or two categorical variables, useful for making comparisons for two variables
Three Summary Characteristics
location, spread, shape
Location
describes the center, average (either mean or median)
Spread
describes variability (either standard deviation or IQR)
Shape
how the graph is shaped
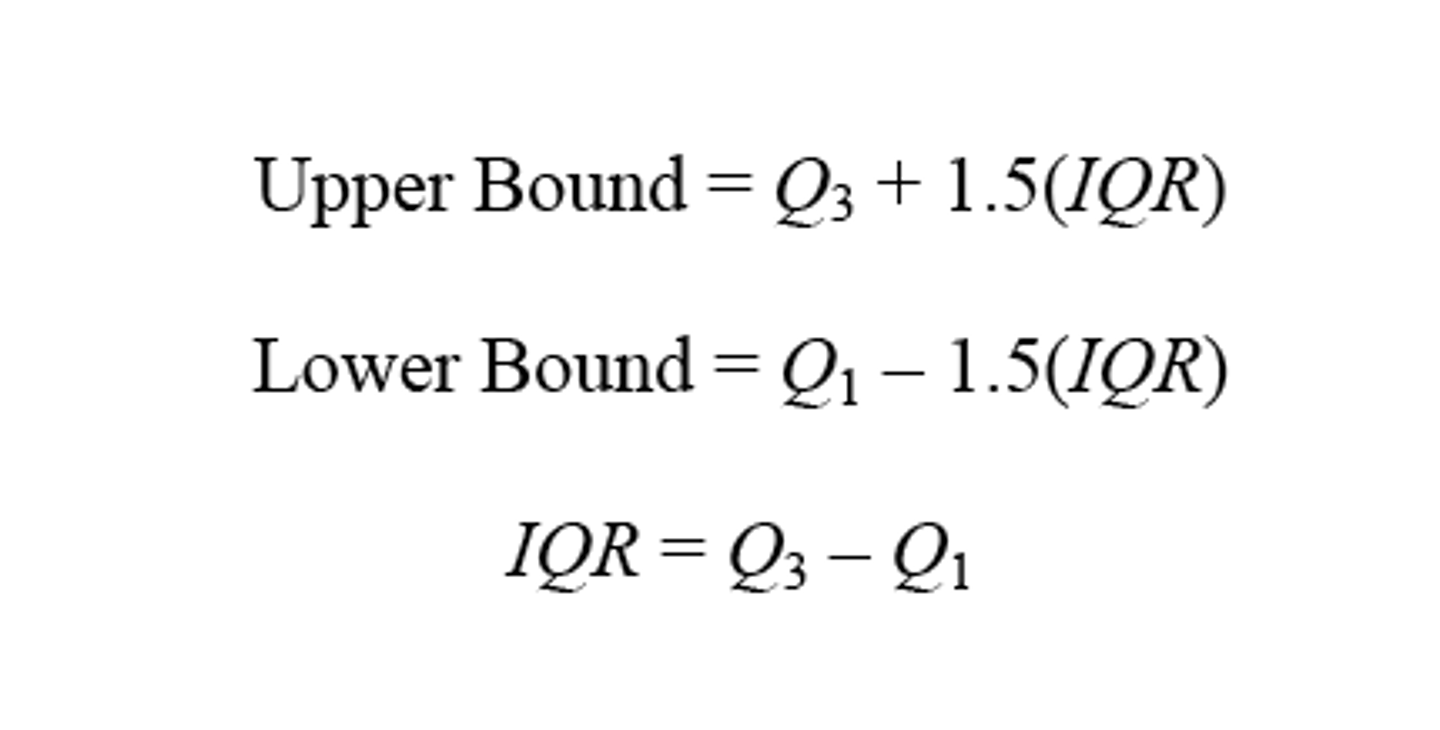
Outlier
values that are unusually large or small
Histogram
similar to bar graph, can be used for any number of data values, good for large sets of data, flexibility with intervals, not informative when sample size is small
Stem-and-leaf plot
present all individual values, bad for large sample sizes, restricted in choices for intervals
boxplot (box and whisker plot)
displays information given in a five-number summary, good for seeing location, spread, symmetry vs skewed, outliers, and comparing. not good for judging shape.
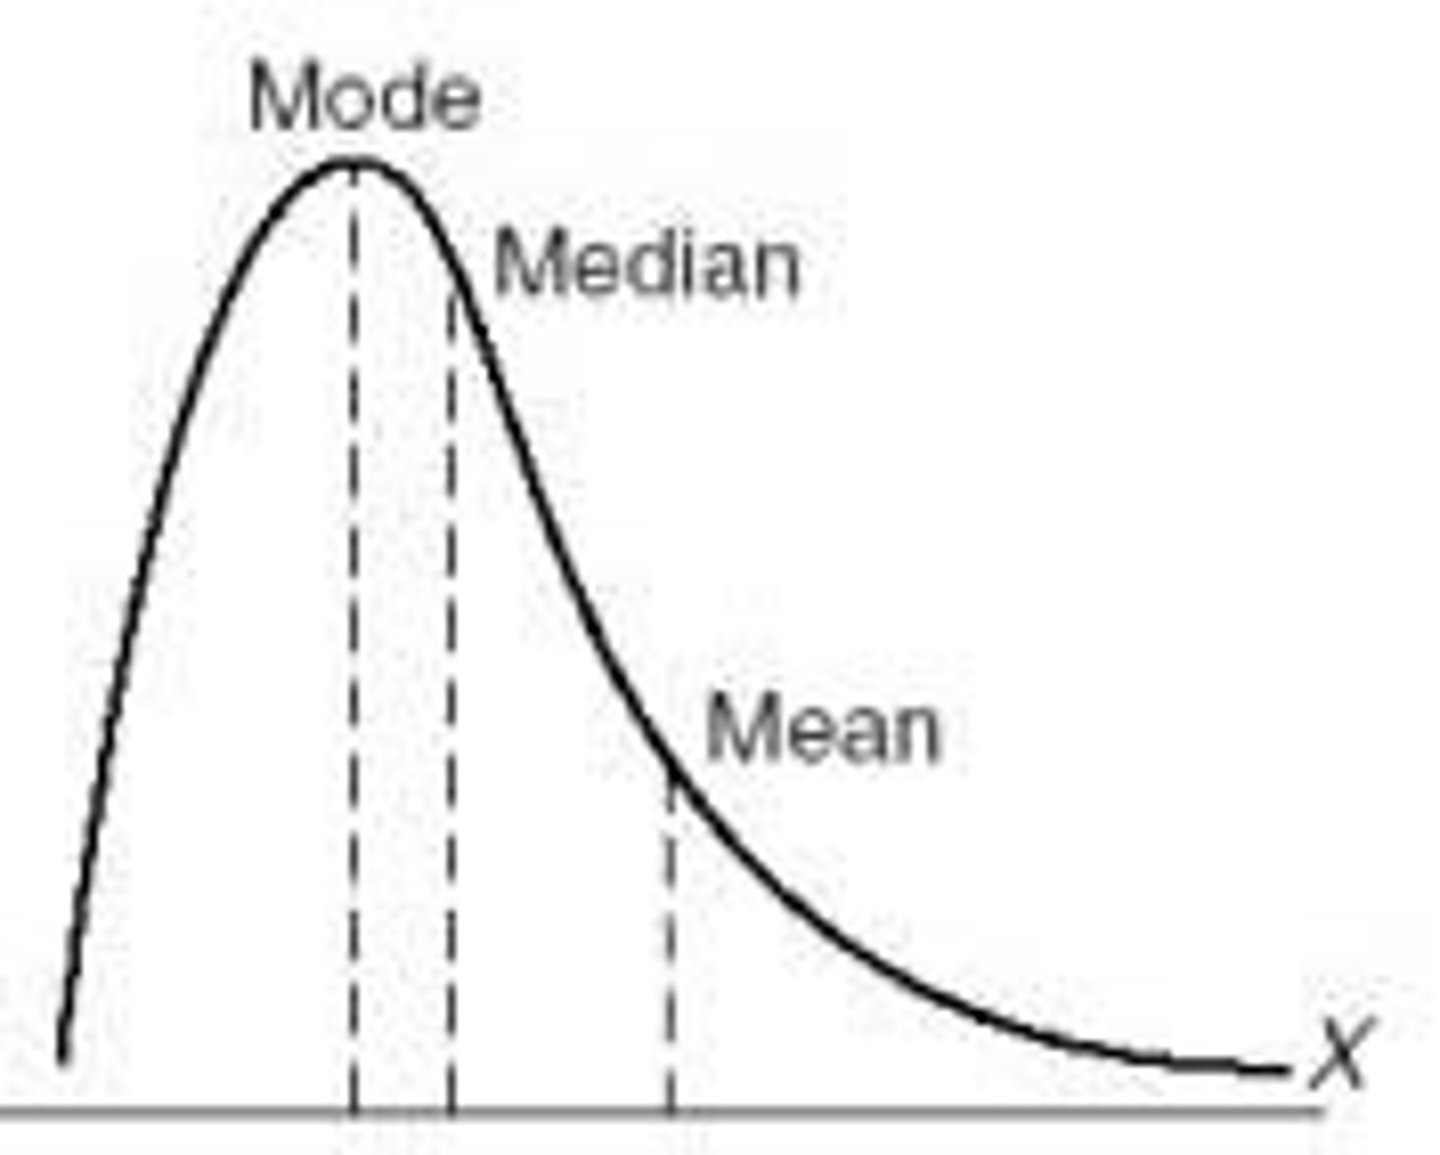
Skewed to the right
description of a shape where data values are concentrated at the left of the graph
Skewed to the left
description of a shape where data values are concentrated at the right of the graph
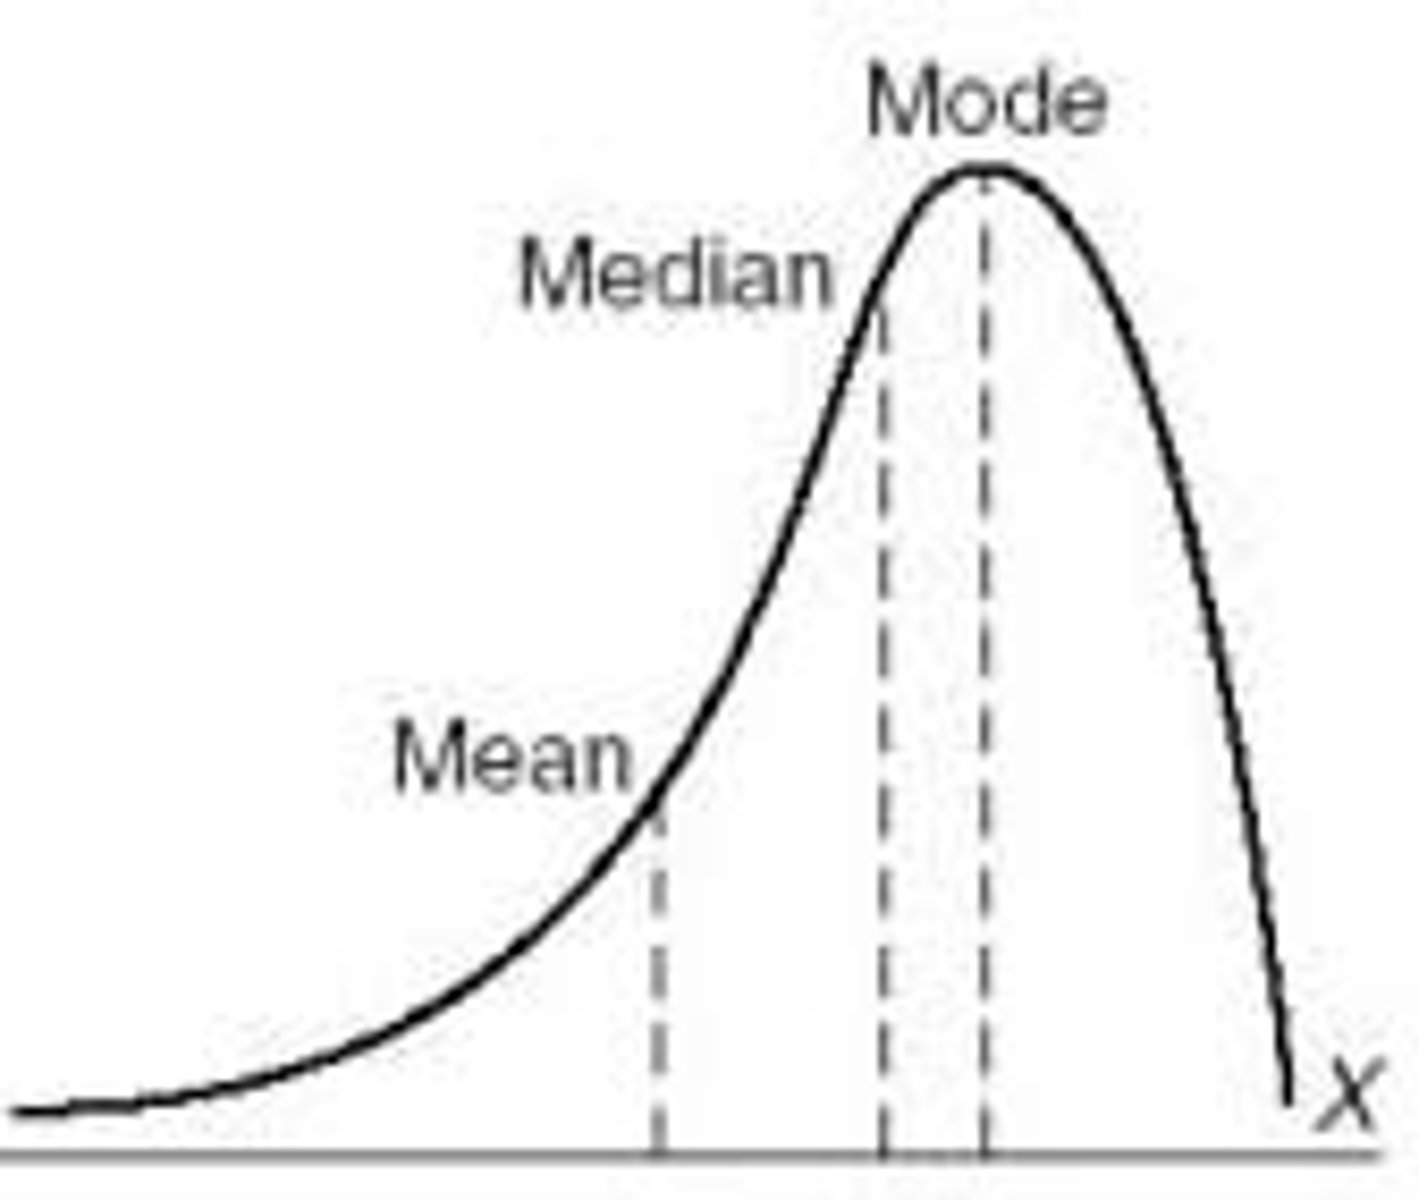
Mode
most frequent value in a data set
Unimodal
one peak in the graph
Bimodal
two peaks in the graph
Percentile
number that has __% of the data values at or below it
Empirical Rule
68% w/in 1 standard deviation 95% in 2 standard deviations and 99.7% in 3 standard deviations
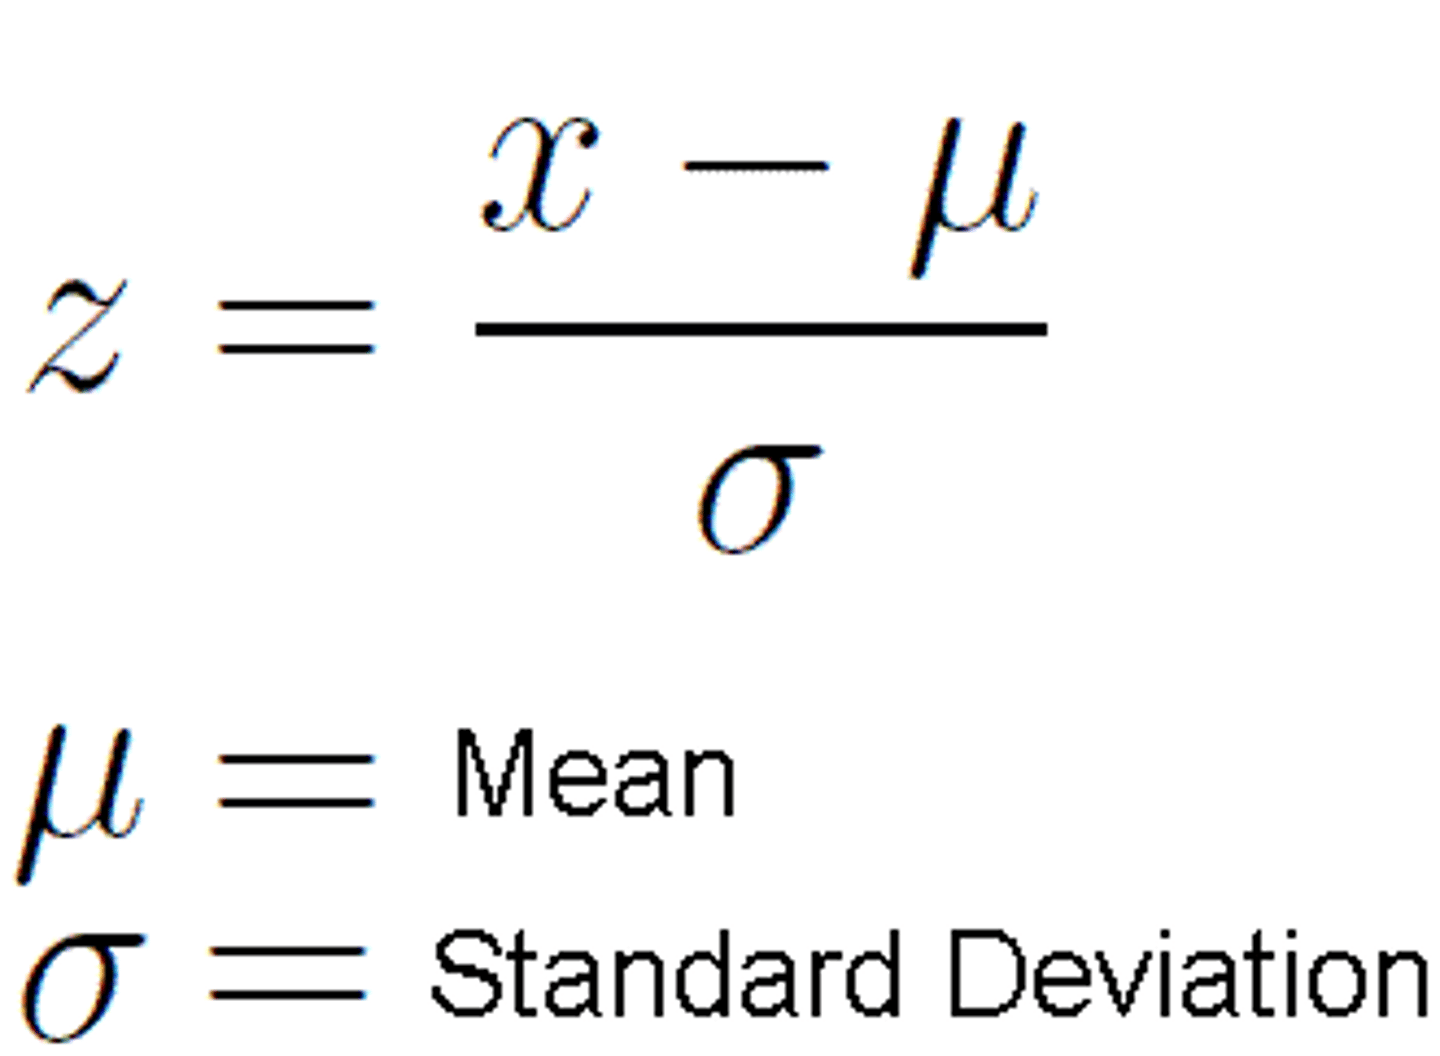
Z-score
a measure of how many standard deviations you are away from the norm (average or mean)