Unit 1 - Question Recognition
 Call Kai
 Learn
Learn Practice Test
 Spaced Repetition
 Match
Match Flashcards
 Knowt Play
1/33

There's no tags or description
Looks like no tags are added yet.
Name | Mastery | Learn | Test | Matching | Spaced | Call with Kai | Chat |
|---|
No analytics yet
Send a link to your students to track their progress
34 Terms
A course has weights of 5%, 10%, 15%, 25%, 45%. What mark is needed on the final?
or What is the overall course grade?
"course grade"
"overall mark"
"worth"
"weighted"
"what mark is needed on the final"
Weighted Average (Grade) because you're taking several grades that have different weights and combining them into one overall course grade.
The reason we used fractions like:8/10, 70/100, 22/30, 28/35 is that these fractions tell us the proportion earned in each category before applying the weight.
Score / Total x Weight [for each category]
![<p></p><p><strong>Weighted Average (Grade) </strong>because you're taking several grades that have different weights and combining them into one overall course grade.</p><p>The reason we used fractions like:8/10, 70/100, 22/30, 28/35 is that these fractions tell us the <strong>proportion earned</strong> in each category before applying the weight.</p><p>Score / Total x Weight [for each category]</p>](https://assets.knowt.com/user-attachments/9aa7418c-160c-49a6-b401-38d33bcf3a01.png)
The following table shows the number of hours studied by students and the frequency of each value. Find the weighted mean number of hours studied.
Hours (x) | Frequency (f) |
|---|---|
2 | 3 |
4 | 5 |
6 | 2 |
Weighted mean
Weighted average
Frequency table
Average with weights
Average GPA using credit hours
Weighted Mean. The question directly says "weighted average" or "weighted mean."
Clue: A frequency table is often a weighted mean question in disguise.

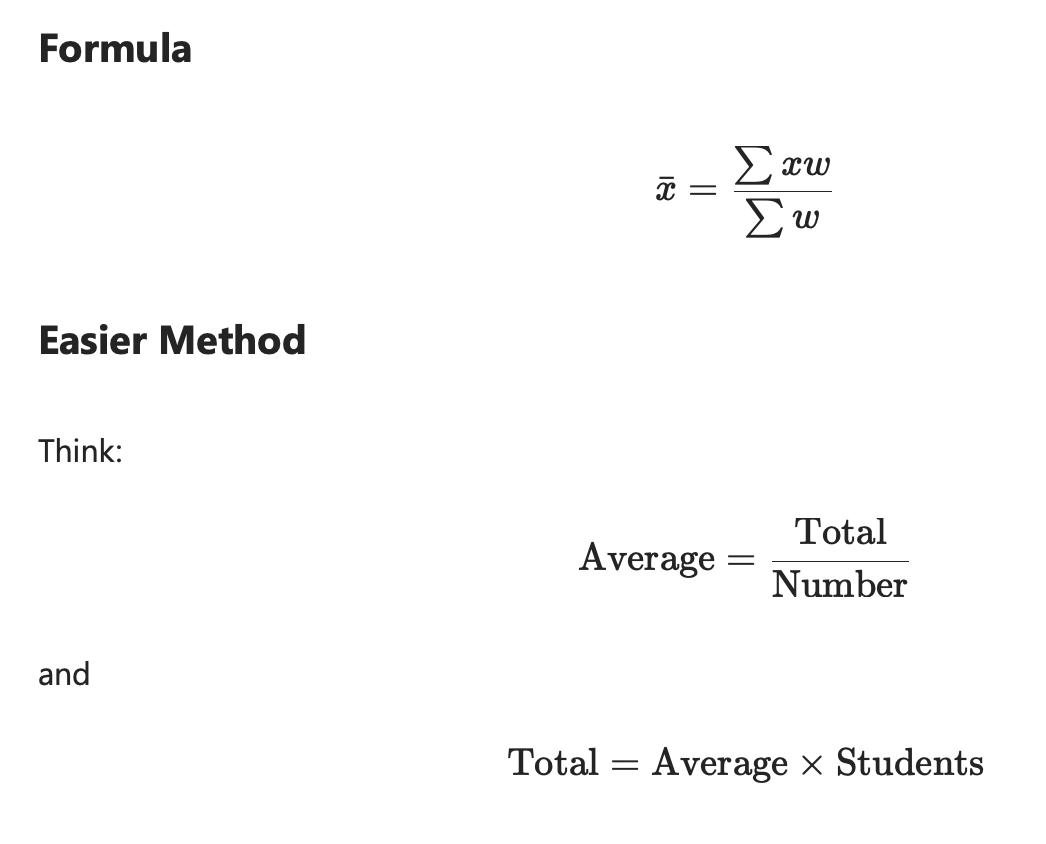
Two groups have different averages. The overall average is known. Find the missing number of students.
or
Find the missing group average.
The clues are:
Group 1 average
Group 2 average
Overall average
Number of people/items in each group
Weighted Mean (Weighted Average) Question with Group Averages.
These are classic weighted mean questions because the groups have different sizes.
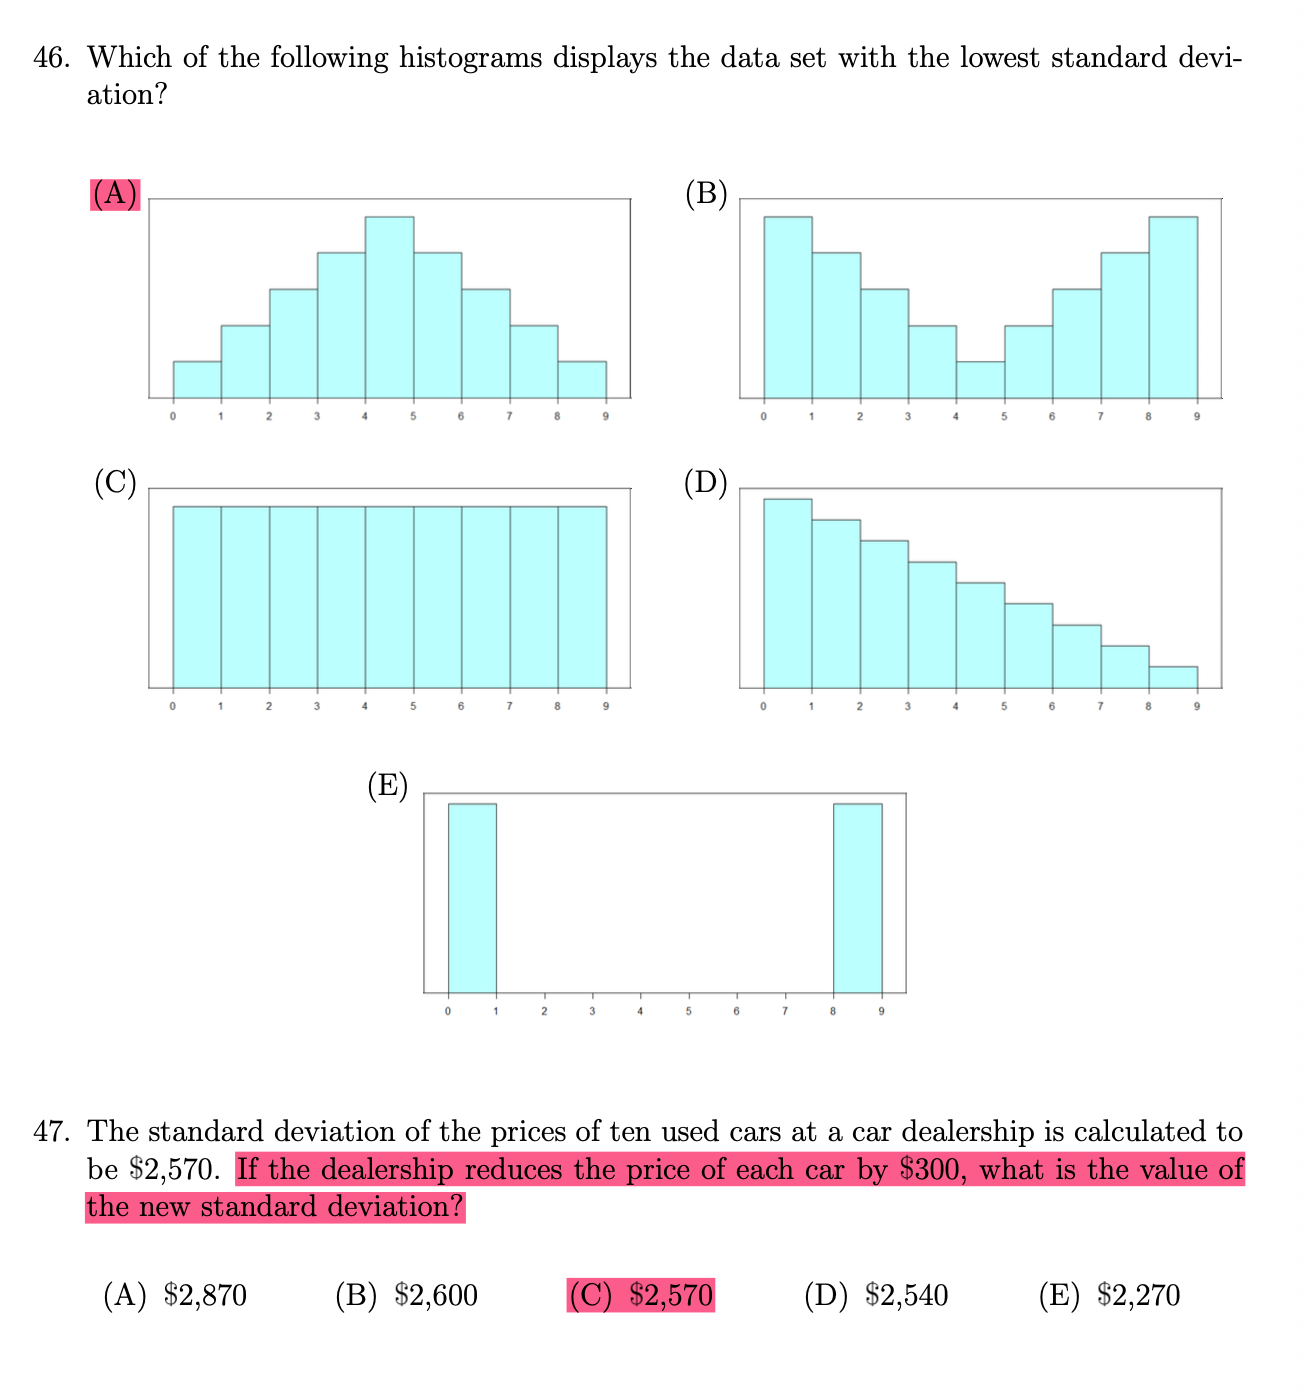
What are Attributes of Standard Deviation and Which Formula is Used?
SD measures the spread out the data are from the mean. When most values are near the centre, this indicates that there is a small distance from the mean. However, when most data is evenly spread everywhere, it means that there are lots of data spread out from the mean.
The standard deviation has the same units as the original observations.
Example: Heights measured in cm, Standard deviation measured in cm
If the standard deviation is zero, then all observations have the same value.
If every value is identical: x − xˉ = 0 for every observation.
The standard deviation should be used as the measure of variability when the mean is chosen as the measure of centre.
Mean ↔ Standard deviation
Median ↔ IQR
The standard deviation should not be used as a measure of spread when the distribution is strongly skewed.
For skewed data we prefer these because they are resistant to outliers:
Median
IQR

The standard deviation of the prices of ten used cars at a car dealership is calculated to be $2,570. If the dealership reduces the price of each car by $300, what is the value of the new standard deviation?
(A) $2,870 (B) $2,600 (C) $2,570 (D) $2,540 (E) $2,270
(A) $2,870 (B) $2,600 (C) $2,570 (D) $2,540 (E) $2,270
Standard deviation measures spread around the mean.
When every value moves down by the same amount:
The mean moves down by $300.
Every data point moves down by $300.
So the distances from the mean don't change. SD stays the same, because the actual spread itself is not changing by a variable amount.
Find the variance of the following sample: 2, 4, 6, 8
or
The variance of a data set is...
Trying to find the variance of the data.

A frequency table has missing RF values. Find the total number of observations.
What type of Question is This?
Finding the relative frequency.
Add up all the known relative frequencies and subtract that sum from
1.0
(if using decimals) or
100%
(if using percentages)
Look for:
Relative Frequency
Frequency Table
Proportion
Percent

Find the Median of the Ordered Dataset
What type of Question is This?
Look for:
Median
Middle value (Q2 or 50%)
Ordered data

Find Q1, Q3, or the IQR.
What type of Question is This?
Finding the measures of positions within a dataset, that also appears in boxplots.
Keywords:
Quartile
Percentile
IQR
Five-number summary

Which values will be labeled as outliers on an outlier boxplot?
What type of Question is This?
This is looking at the outlier box plots. Trying to detect the potential outliers.
Keywords:
Outlier
Boxplot
Suspected outlier
Whiskers


What final grade is needed to earn 80% overall?
A course grade is based on:
Assignments 20%
Midterm 30%
Final 50%
What type of Question is This?
This is a weighted grade question. Weight will add up to 100%.
Look for:
Course grade
Worth 20%
Worth 50%
Final exam needed

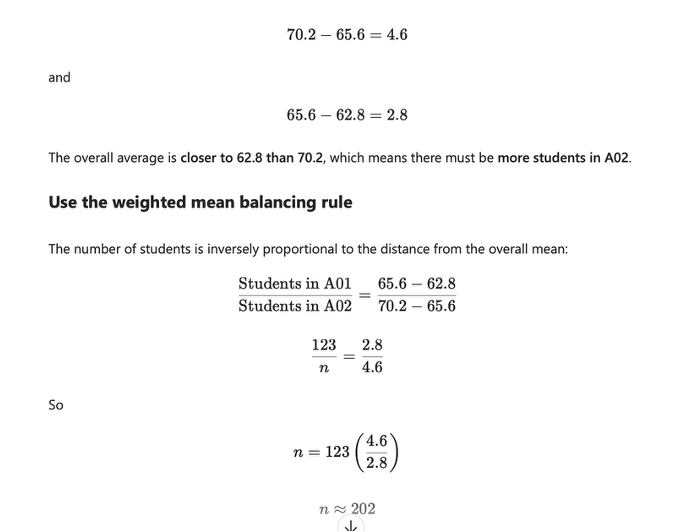
Section A has 123 students with an average of 70.2. Section B has an average of 62.8.
The overall average is 65.6. How many students are in Section B?
This is a type of weighted mean question. Whenever you see question with the average score, number of students, or combined average, this is a weighted mean.
Look for:
Two groups
Group averages
Number of students
Overall average
Which measures are resistant to outliers
Resistant Measures
✅ Median
✅ Quartiles
✅ IQR
These measures only depend on the position of values, not their exact size.
Not Resistant
❌ Mean
❌ Range
❌ Standard Deviation
These are not resistant because they use every actual value.
What graph should be used to display the distribution of quantitative data?
Histogram because the histogram shows the shape, centre, spread, skewness, clusters and gaps in the data
Use when data are:
✅ Quantitative
✅ Numerical
Examples:
Age
Height
Weight
Test Scores
Income
Which graph should be used to track stock prices over time?
Timeplot should be used when data is collected overtime. This can be recognized through words like over time, month, year, day, trend.
Examples:
Daily temperatures
Stock prices
Population growth
Sales each month
Which graph should be used to summarize quartiles, medians, and outliers?
Boxplots should be used when you want to summarize data (the five number summary). Boxplots show the five number summary, skewness, outliers and spread.
This includes:
Minimum
Q1
Median
Q3
Maximum
Or outliers
Anthony scored 76% on a midterm and was at the 68th percentile in a class of 125 students. Approximately how many students scored as well as or better than Anthony?
Percentile Rank
Look for:
"68th percentile"
"90th percentile"
"What proportion is above/below?"
"How many students scored better?"
68th percentile means 68% of students scored at or below Anthony.
100 - 68 = 32%. That means that 32% of students scored better than Anthony.

Find the position of the 75th percentile in a data set containing 40 observations.
Percentile Position
Look for:
Percentile
P75
P20
P90
Position

Which interval contains the first quartile of a frequency distribution?
Looking for the quartile position.
Look for:
Q1
Q3
First quartile
Third quartile
Frequency table

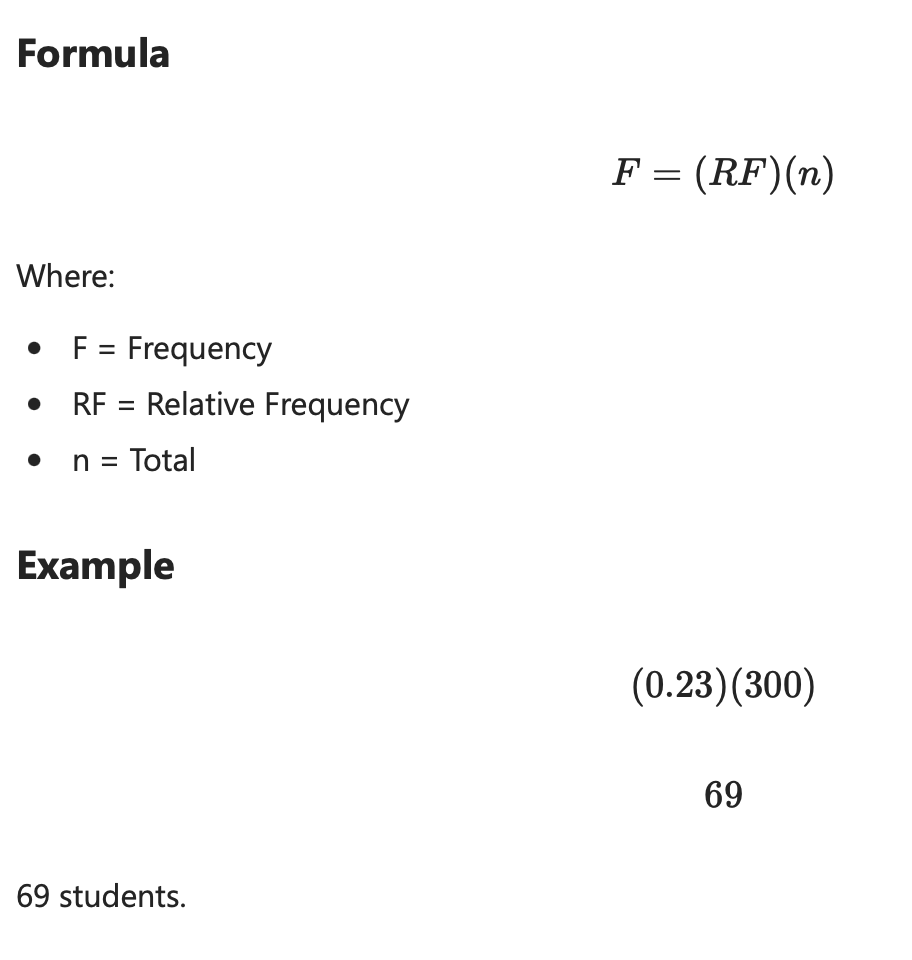
A survey has a relative frequency of 0.23 for Geography. There were 300 students surveyed. How many students chose Geography?
Frequency
Formula: Frequency = Relative Frequency x n (observations)
Look for:
Relative frequency
Frequency
Total surveyed
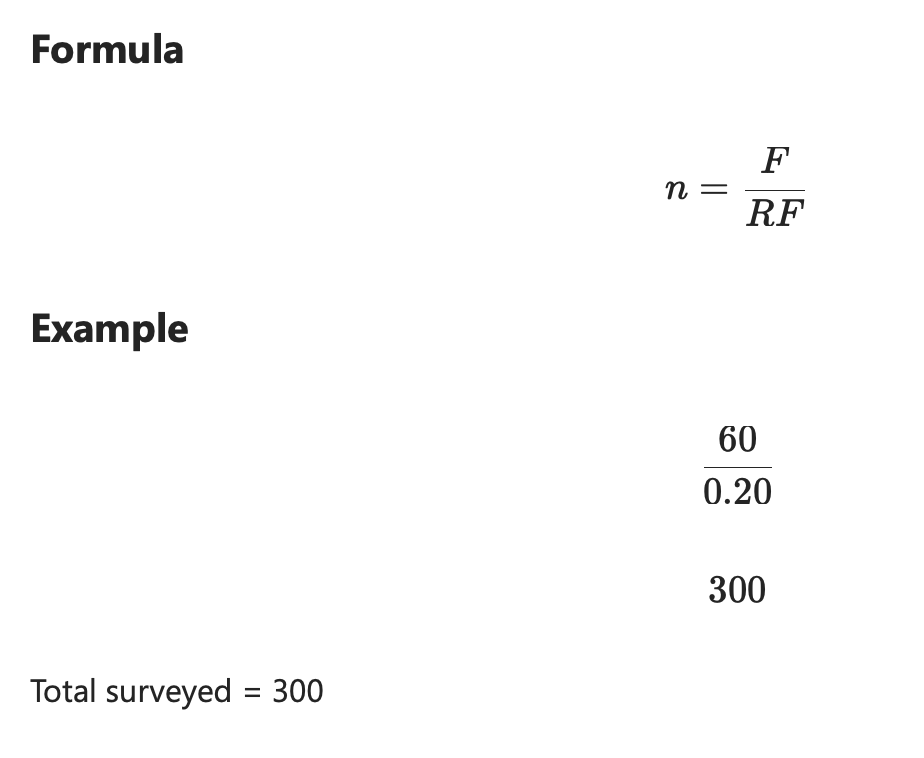
English has a frequency of 60 and a relative frequency of 0.20. How many students were surveyed?
Missing Total from Relative Frequency
Look for:
Frequency given
Relative frequency given
Total missing
Out of 40 students, 26 passed. What percentage passed?
Percentage
Look for:
What percent?
Percentage passed?
Percentage failed?

Out of 50 taxi fares, 37 were less than $25. What proportion were less than $25?
Proportion
Look for:
Proportion
Relative frequency

The mean GPA of 14 students is 3.12. One student with GPA 2.41 leaves. Two students with GPAs 3.97 and 4.26 join. What is the new mean?
Mean Change / Missing Mean
Look for:
Mean given
Someone leaves
Someone joins
New mean needed
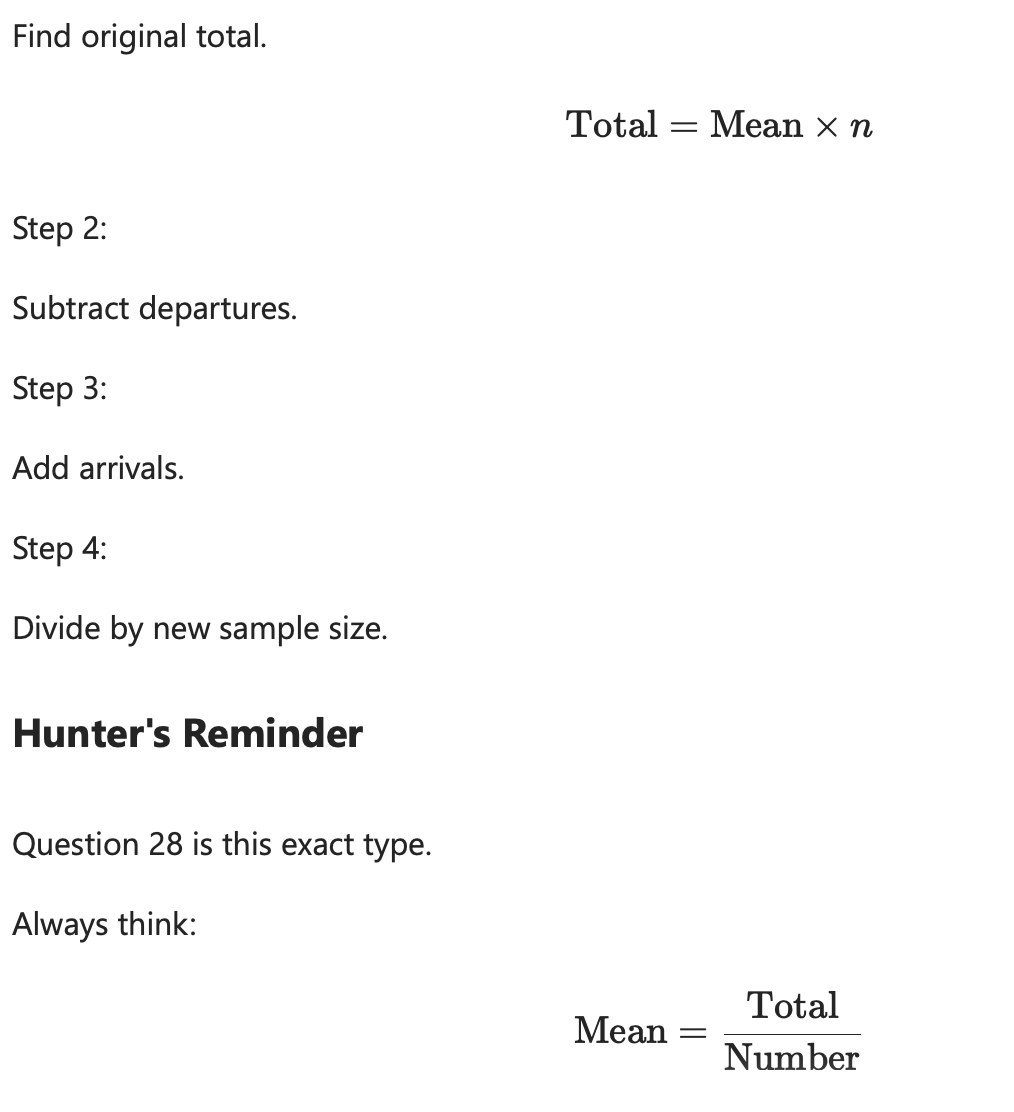
Five values have a mean of 20. Four values are 15, 18, 22, and 24. Find the missing value.
Missing Value from Mean
Mean Average x n (observations) - (sum of the total known values)
Find the total sum of all 8 observations by adding them all together (e.g. 15 + 18 + 22 + 24 = 79).
Multiply this number (79) by n (the total observations, even the one that we are not sure of). 79 × 5 = 395.
Add the total of the know numbers = 79.
Find the missing value by 395 - 79 = 316.
Missing value = average x n - (sum of the whole values)
Look for:
Mean known
One observation missing
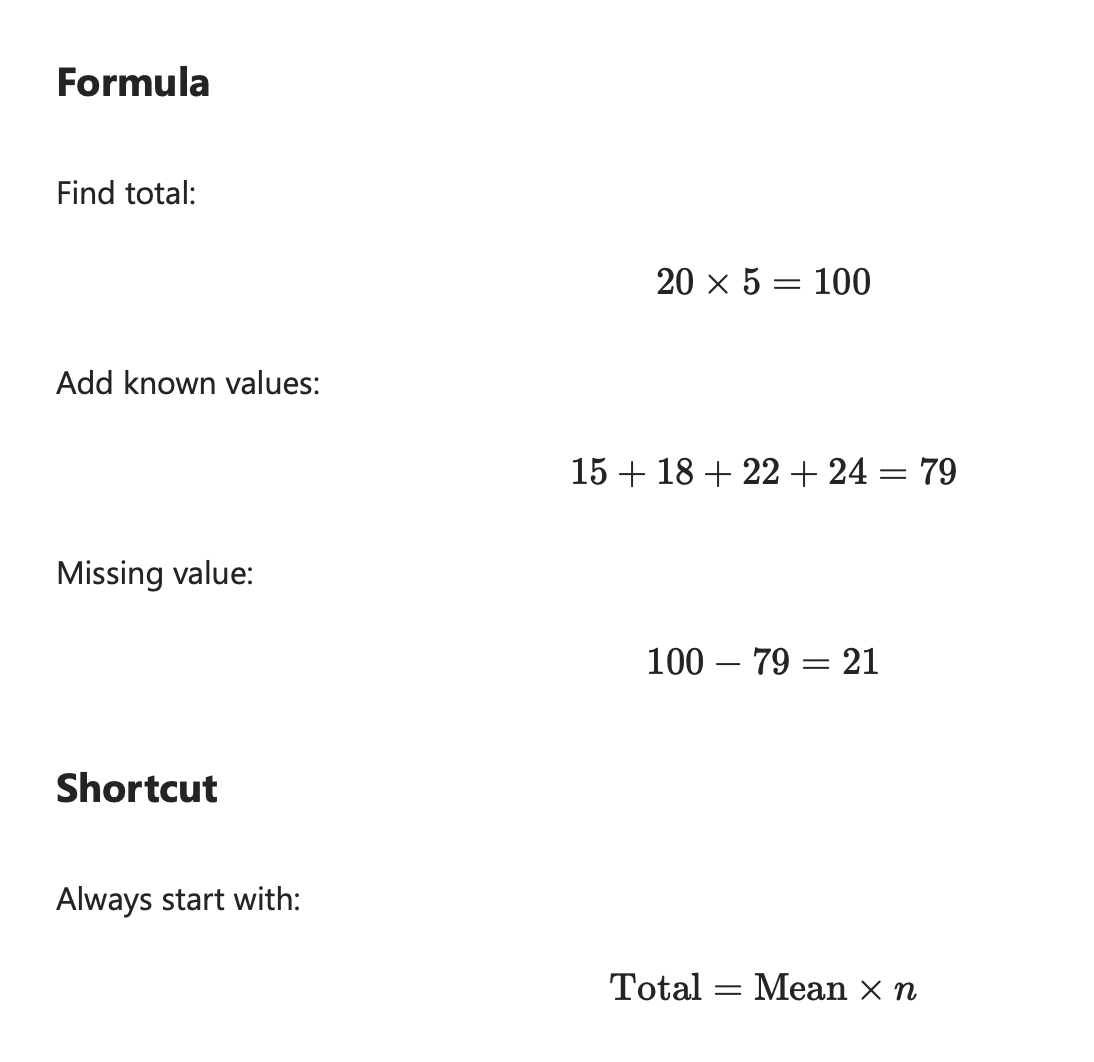
Section A has 123 students with an average score of 70.2. Section B has an average score of 62.8.
The combined average is 65.6. Find the number of students in Section B.
Weighted Mean
The average itself is never the weight. Whatever answers “how many” is usually the weight.
Look for:
Two groups
Two averages
Overall average
Number of students

A course is graded:
Assignments = 20%
Midterm = 30%
Final = 50%
A student earns:
80% on assignments
70% on the midterm
Weighted grade
How to Read Timplots
A timeplot shows how something changes over time. Use for measurements, and not distributions.
The x-axis is always:
Time
Examples:
Days
Weeks
Months
Years
The y-axis is the measurement.
Examples:
Temperature
Stock Price
Sales
Population
Histogram
A histogram shows the distribution of quantitative (numerical) data.
Histograms can tell you: Right skew, Left skew, Symmetric
Boxplots
Boxplots can be useful to summarize data (five number summary) related to:
Finding outliers
Comparing groups
Finding IQR
Finding skewness
Finding the median
They are NOT GOOD for:
Seeing exact data and frequencies
Showing trends over time
A dataset contains 250 observations.
Find the position of:
a) 25th percentile
b) 60th percentile
c) 90th percentile
Percentile Position
Use formula
Pk = k(n + 1)/100
k: This represents the percentile number that you are trying to find. When something appears as a 25th, it can be left as 25, and does not need to be changed to 0.25.
This it looking at understanding the percentile position.
A test has 100 students.
The 75th percentile score is 84.
Approximately how many students scored below 84?
75th percentile means 75% are below.
0.75(100) = 75 students
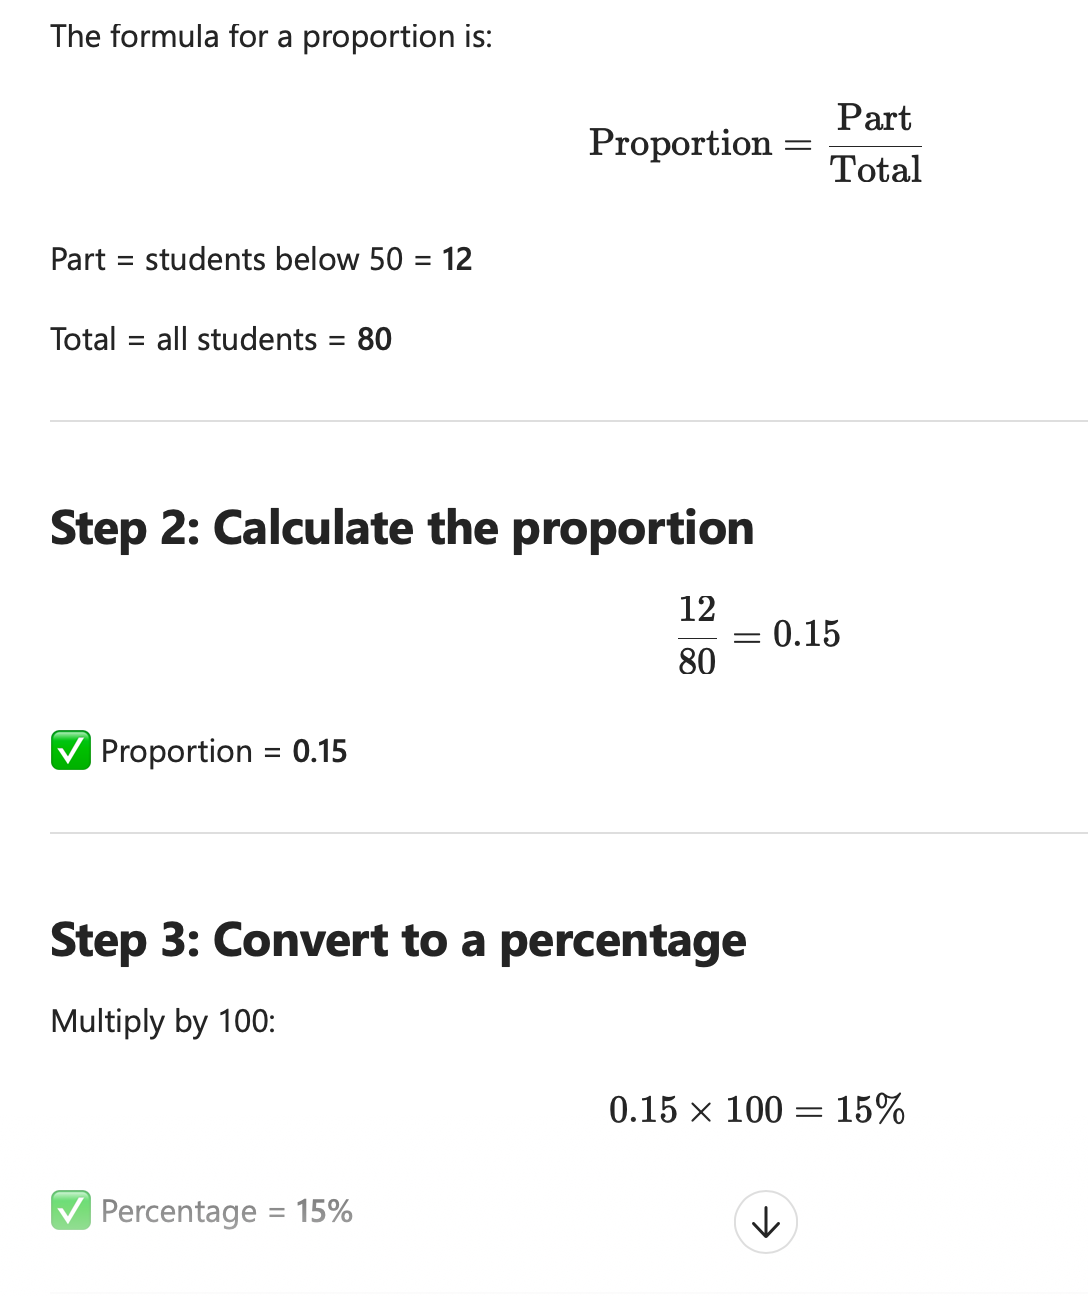
A histogram represents 80 exam scores.
12 students scored below 50.
What proportion scored below 50?
What percentage scored below 50?
Histogram proportion question.

A class of 30 students has an overall average of 72. 20 students have an average of 68. Find the average of the remaining 10 students.
Missing group mean
Question 19 is really asking you to compare two groups within a class. The entire class of 30 students has an average of 72, but one group of 20 students only averages 68, which is lower than the overall class average.
Since those 20 students are pulling the average down, the remaining 10 students must have grades that are higher than 72 to bring the class average back up to 72 overall.
Think of it like a tug-of-war: the larger group is below the average, so the smaller group has to be well above the average to balance everything out.
When we calculate it, those remaining 10 students need an average of 80, which makes sense because 80 is higher than 72 and can offset the lower average of the first group.
