Ch 1: Intro to Statistics and Data Analysis
1/40
There's no tags or description
Looks like no tags are added yet.
Name | Mastery | Learn | Test | Matching | Spaced | Call with Kai |
|---|
No analytics yet
Send a link to your students to track their progress
41 Terms
What is statistics?
The main objective of statistics is to make an inference about a population based on the information given in a sample
Population
a set of units (people, days, etc.) that we are interested in studying
Sample
A subset selected from a population
Most common sampling method
simple random sample (SRS)
Branches of Stats
-Descriptive Stats
-Inferential Stats
Methods of Descriptive Stats
-graphical methods
-numerical methods
Two Types of Data
-quantitative (measure numerically)
-qualitative (think categories)
Quantitative Data Types
-discrete data (countable)
-continuous data
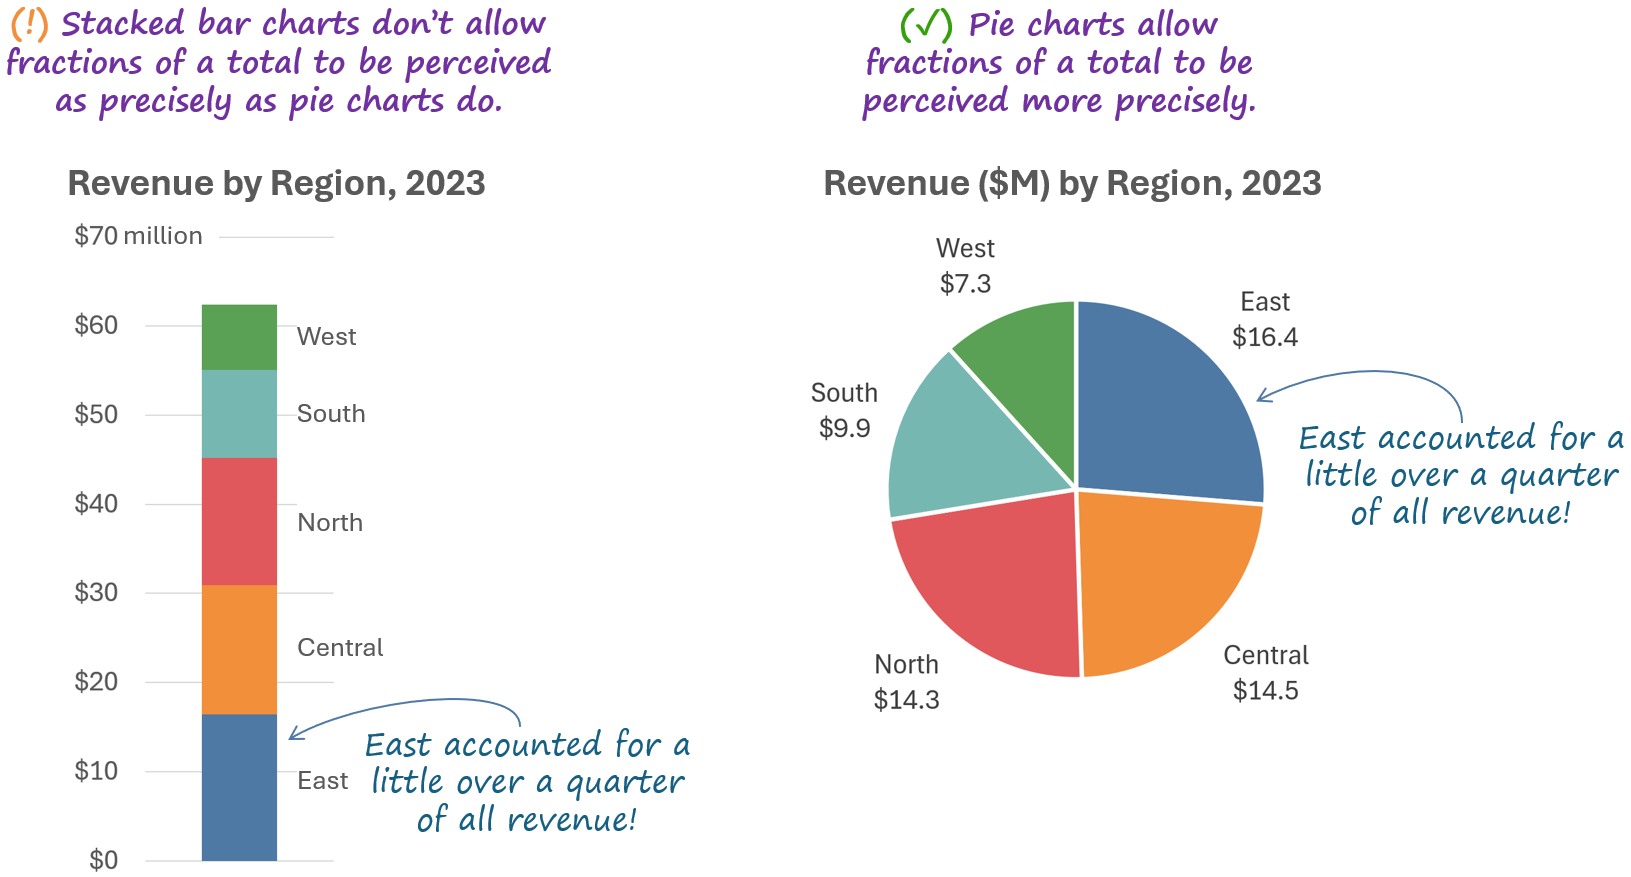
Graphs used for qualitative data
pie charts and bar charts
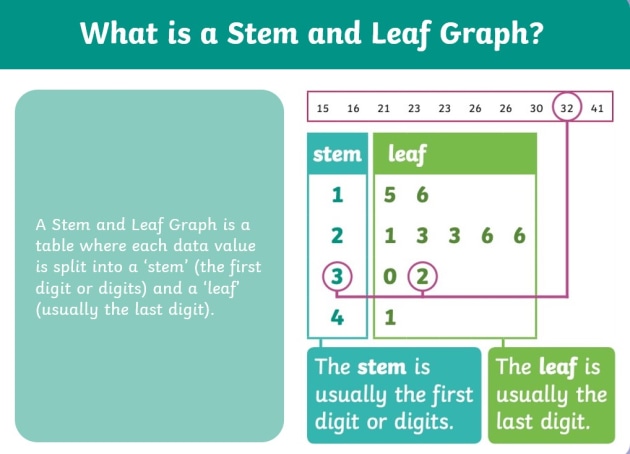
Stem-and-Leaf Plots
split digits to create a pattern we can see
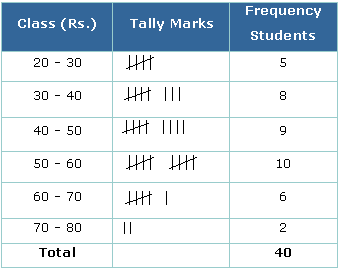
Frequency Table
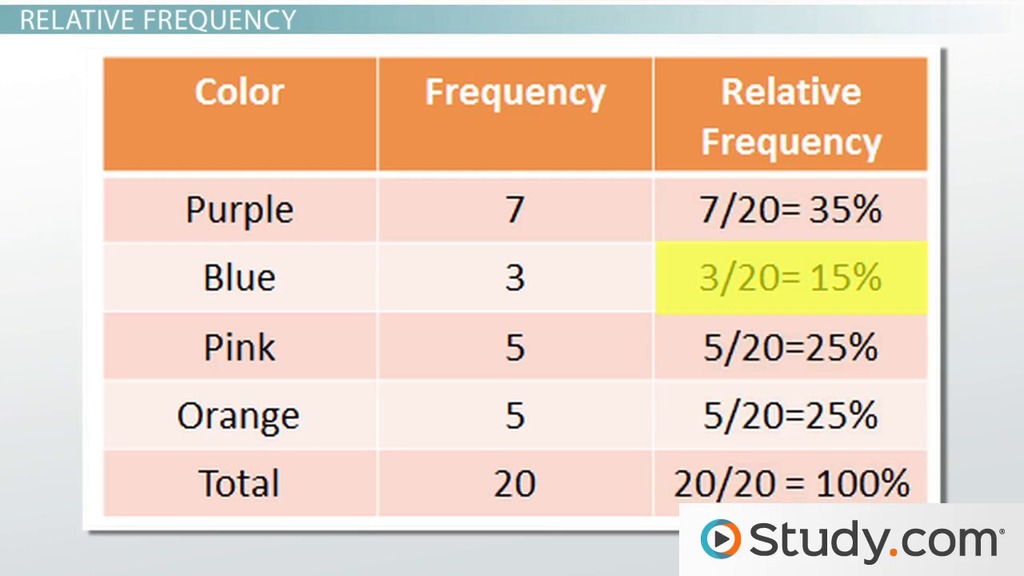
Relative Frequency Table
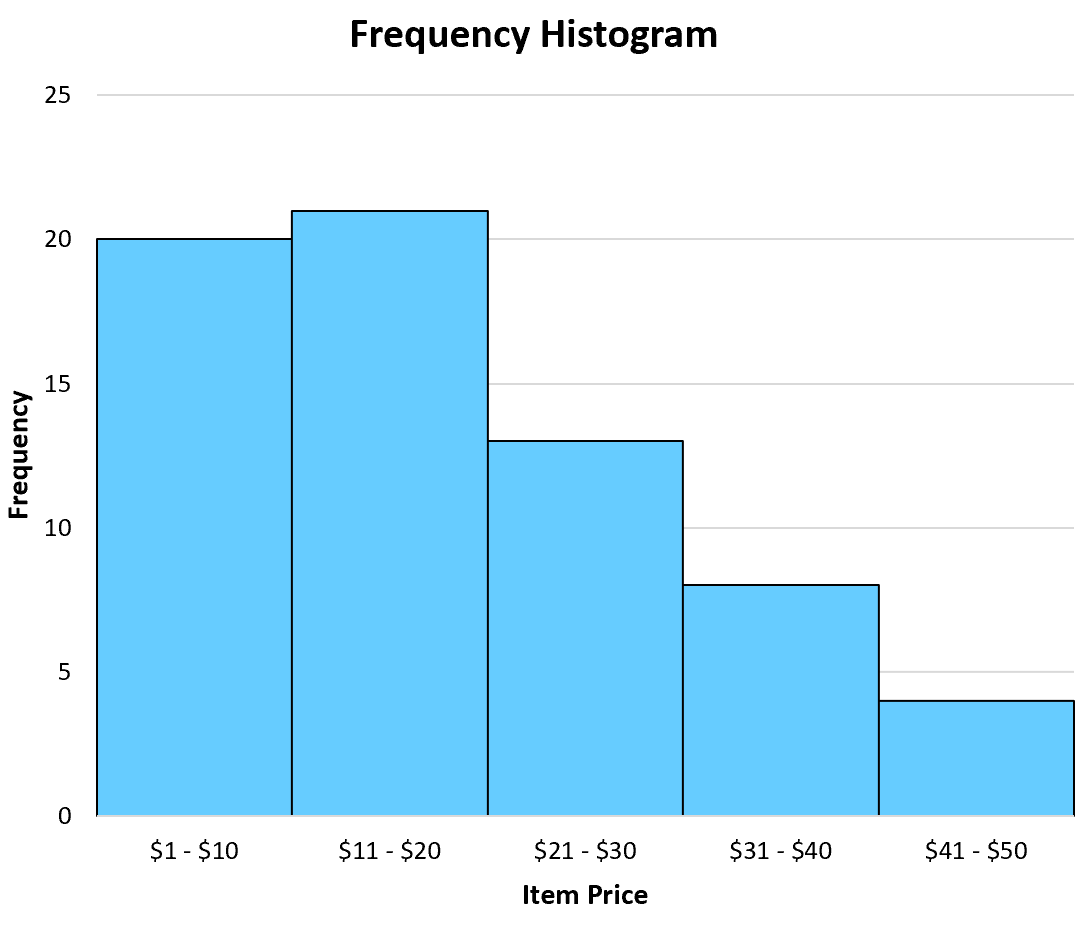
Frequency Histogram
Branches of Numerical Methods
-measures of central tendency
-measures of variability
Measures of Central Tendency
-sample mean
-sample median
-sample mode
Measures of Variability
-range
-interquaratile range (IQR)
-sample variance (S2)
-standard deviation (S)
sample size notation
n (can be m, n1, n2, etc)
value in sample
x
first value in sample
x1
second value in sample
x2
nth value in sample
xn
sample representation
x1, x2, …, xn
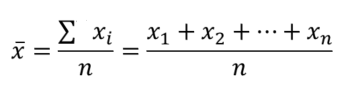
Sample Mean
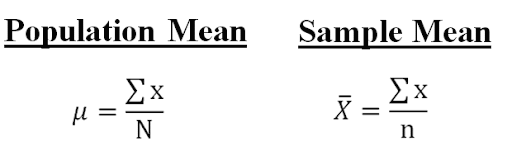
Sample v. Population Mean
Sample Median
*Sample MUST be in order
-the middle
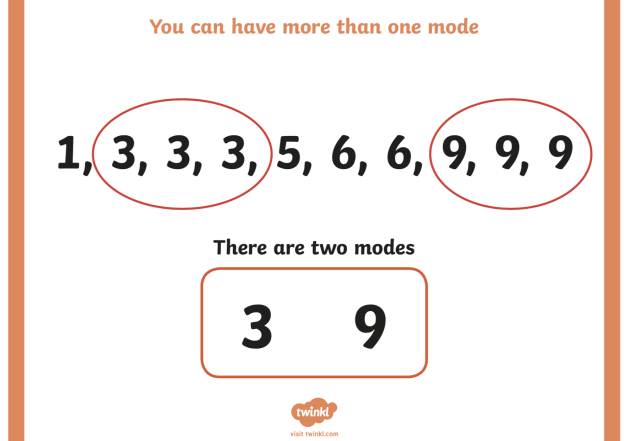
Sample Mode
-the value(s) that appears the most
Sample Range
largest sample value - smallest sample value
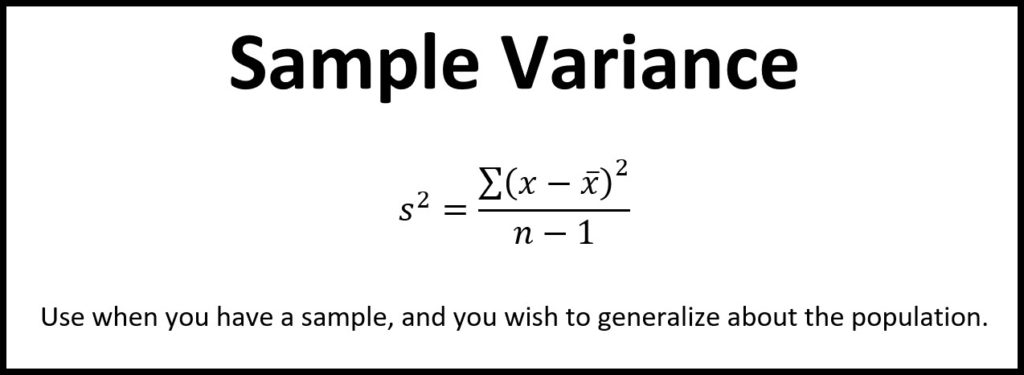
Sample Variance (S2)
Step 1: Find x̄
Step 2: Variance Formula
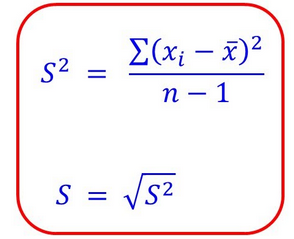
Sample Standard Deviation (S)
Step 1: Find Sample Variance (S2)
Step 2: Square root S2
Box Plots
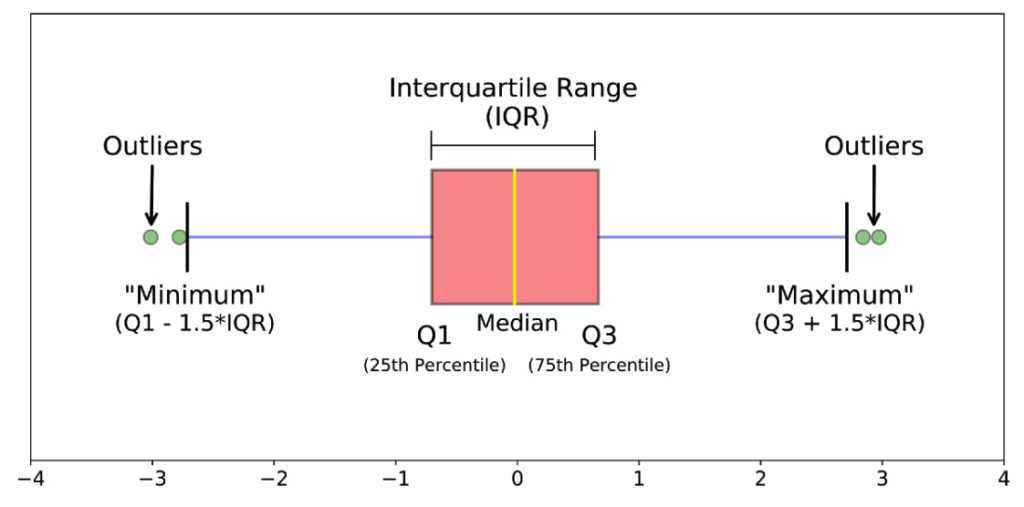
IQR Formula
Q3 - Q1
1.5 x IQR Rule
finds the inner and outer fence to find outliers
partially suspected outlier
*
highly suspected outlier
o
How does changing the min/max affect the box plot?
IQR is not affected, but there may be outliers
Finding min/max for box plot
use smallest/largest value WITHIN the inner fence
Based on a graph, how can you tell if the mean or median is larger?
-if skewed left, the mean is bigger because most of the values are on the higher end, making the average larger
-if skewed right, the median is bigger
-if symmetric, both are the equal
Empirical Rule
-only works for mound-shaped graphs
-approximate rule to interpret standard deviation
First Standard Deviation (Empirical)
~68% of data
Second Standard Deviation (Empirical)
~95% of data
Third Standard Deviation (Empirical)
~99.7%