ap stats unit 1 notes
1/56
There's no tags or description
Looks like no tags are added yet.
Name | Mastery | Learn | Test | Matching | Spaced |
|---|
No study sessions yet.
57 Terms
quantitative data
data that is numerical. the values have an inherent order. examples: income, weight, height # of classes
*can you average the data? YES
categorical data
datat where values are categories or group labels, which often don’t have an inherent order. examples: eye color, relationship status, left or right
*cannot be averaged
misleading graphs may not have axis labels or ___
scale
misleading graphs may __ the x or y axis, or start at a weird place
cut off
misleading graphs may use __ for a bar graph also called what
pictures, also called a pictograph
mean formula
sum of all values / number of all values
median
middle
if it’s odd, use middle value of data set, if even use the value in between
approximating a median in a histogram
label the frequency
add up the frequency
divide by two
find the bins that contain the median, the nth data point
formula for range
range = max - min
why do you think we find the difference between each data point and the mean, standard deviation (Sx) is a measure of spread
it’s a way to measure distance between data values and the mean
Formula of interquartile range (IQR)
Q3 - Q1
resistance
not seriously affected by
Is the median resistant by skew and outliers
yes, the ___ is resistance by skews and outliers (median/mean)
Is the mean resistance to skews and outliers
No, the ___ is NOT resistance by skews and outliers (median/mean)
is the IQR resistant to skews and outlers?
Yes, the ___ is resistant to skews and outliers. (IQR/range and standard deviation)
Is range and standard deviation resistant to outliers
No, the ___ is NOT resistant to skews and outliers (IQR/range and standard deviation)
Why is the mean not resistant to skews and outliers
The mean can drag up or drag down values in calculation
Why is the median and IQR resistant to skews and outliers
Position matters more than the value, the outlier is not given a large weight in calculation
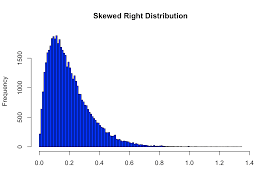
Right skew
mean > median
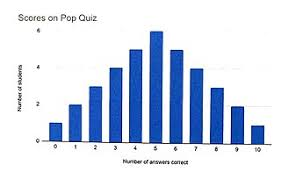
symmetric
mean = median
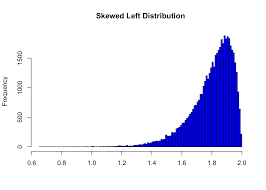
left skew
mean < median
Advantages to using a dotplot to visualize data
see every data point
Disadvantages to using a dotplot to visualize data
can’t always see exact value
not great for large data sets
Advantages to using a stemplot to visualize data
See exact values
Disadvantages to using a stemplot to visualize data
not great for large data sets
Advantages to using a histogram to visualize data
Great for large data sets
Disadvantages to using a histogram to visualize data
Can’t see individual values
when asked to describe the distribution use …
CSOCS
1st C in CSOCS
Context: what variable is being measured. Example: The distribution of payroll for 2002 baseball teams…
1st S in CSOCS
Shape: right/left skew, symmetric modes (unimodal or bimodal)
O in CSOCS
Outliers: unusual points. Examples: No obvious outliers
2nd C in CSOCS
Center: mean, median, general center. Example: The center is approximately $50 million
2nd S in CSOCS
Spread: range, IQR, standard deviation. Example: Has a range of between $20-140 million
outliers
unusually high or low data values
Formulas for outlier boundaries
Upper Limit and Lower Limit
Upper limit
Q3 + 1.5 x IQR
Lower Limit
Q1 - 1.5 x IQR
CSOCS for boxplot
Context: subject of data
Shape: Skew (not modes) shape may not be determined
Outlier: dots/astriecks
Center: median
Spread: IQR
Comparing distirbutions
Use CSOCS and use comparative language for each feature, use AND, not but or howeve.
Percentile
percent of data less than or equal to a certain data value
standardization
a point’s location in the distribution depends on both distance from the center and the distribution’s spread (or variability)
formula for z score
z = (x - mean) / Standard deviation (sx)
If data value > mean
positive z-score
if data value < mean
negative z score
positive z score
the number of standard deviation, ABOVE THE MEAN
negative z score
the number of standard deviations, BELOW the mean
The normal curve
symmetric
mean = median, both located at center
The empirical rule
normal curves 1,2,3 standard deviations away from the mean
Empirical rule: 1 SD from mean
68%
Empirical rule: 2 SD from mean
95%
Empirical rule: 3 SD from mean
99.7%
strategy for normal curves
draw + label curve
perform calculations
answer the question with context
Empirical rule: 3 SD from the mean is statistically significant how
Out of the norm
Percentile will always be shaded to the…
to the left
Empirical rule FORMULA: 1 SD from mean
Mean ± 1(Standard deviation)
Empirical rule FORMULA: 2 SD from mean
Mean ± 2(Standard deviation)
Empirical rule FORMULA: 3 SD from mean
Mean ± 3(Standard deviation)