Chapter 3B - Bivariate Data and Correlations
1/16
There's no tags or description
Looks like no tags are added yet.
Name | Mastery | Learn | Test | Matching | Spaced |
|---|
No study sessions yet.
17 Terms
Scatterplots
Are the most effective way of presenting relationship data
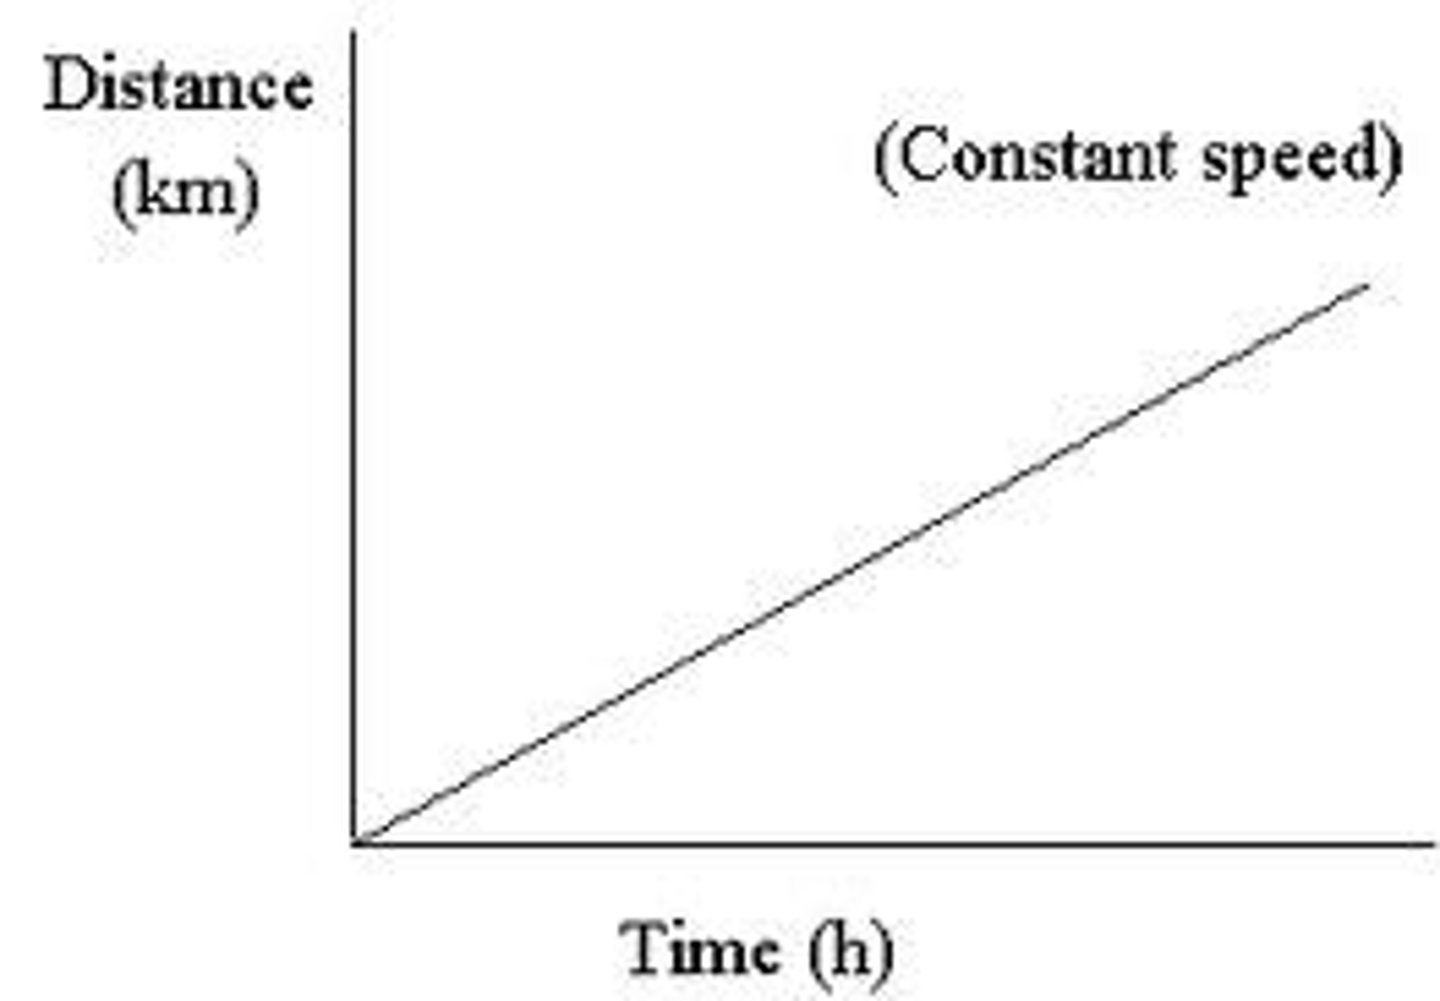
Linear Relationships
Relationships best described lines
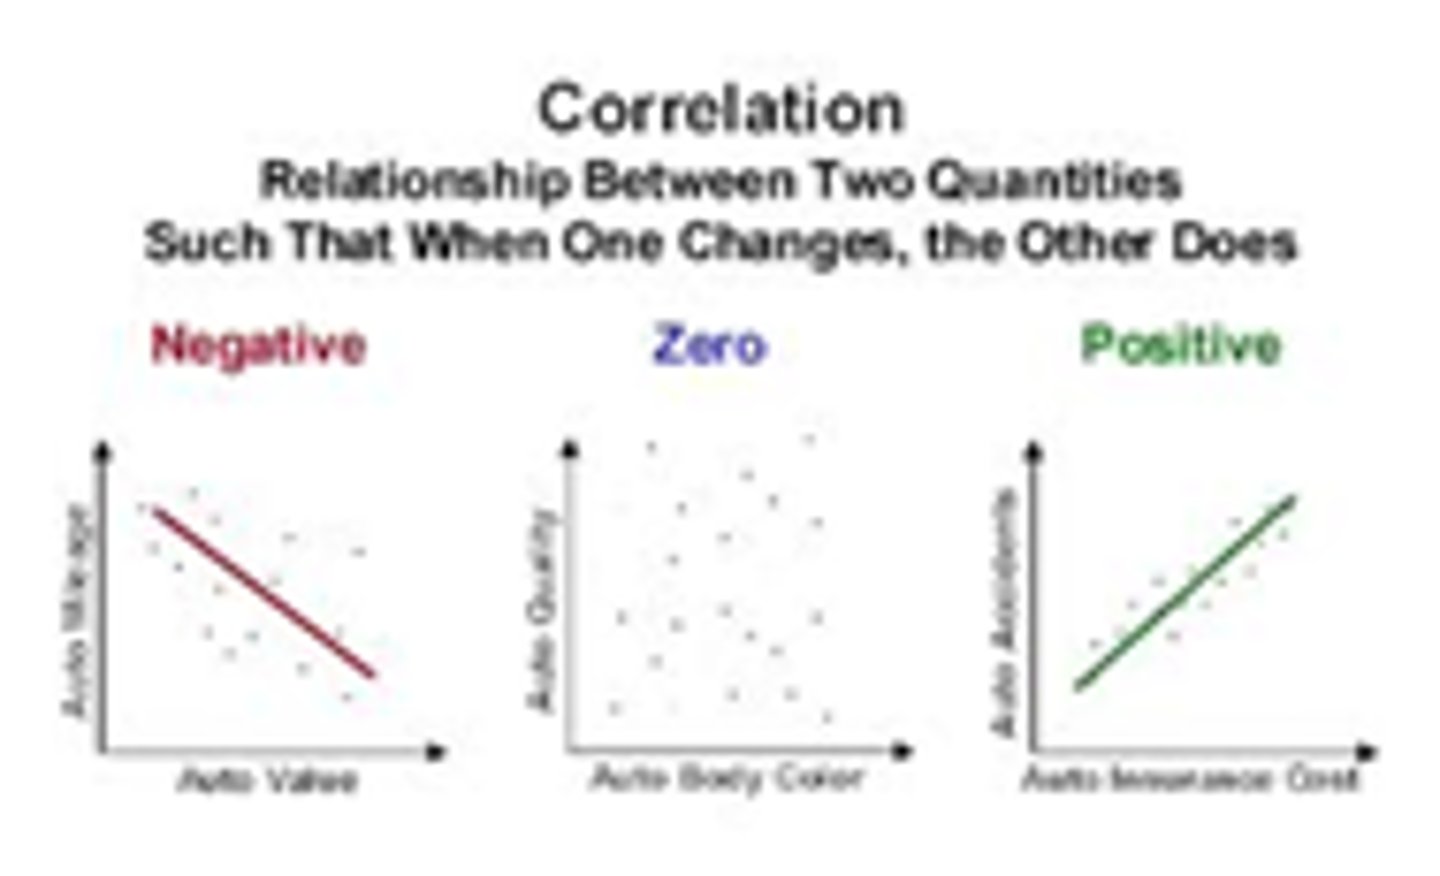
Correlations
-Descriptor of how reliably a change in one variable predicts a change in another variable
-Describe the relationship between two variables
-Can't be used to make a definitive statement about causation
-We can always design an experiment, and then we may be able to make causal judgments
-Can be found for almost anything
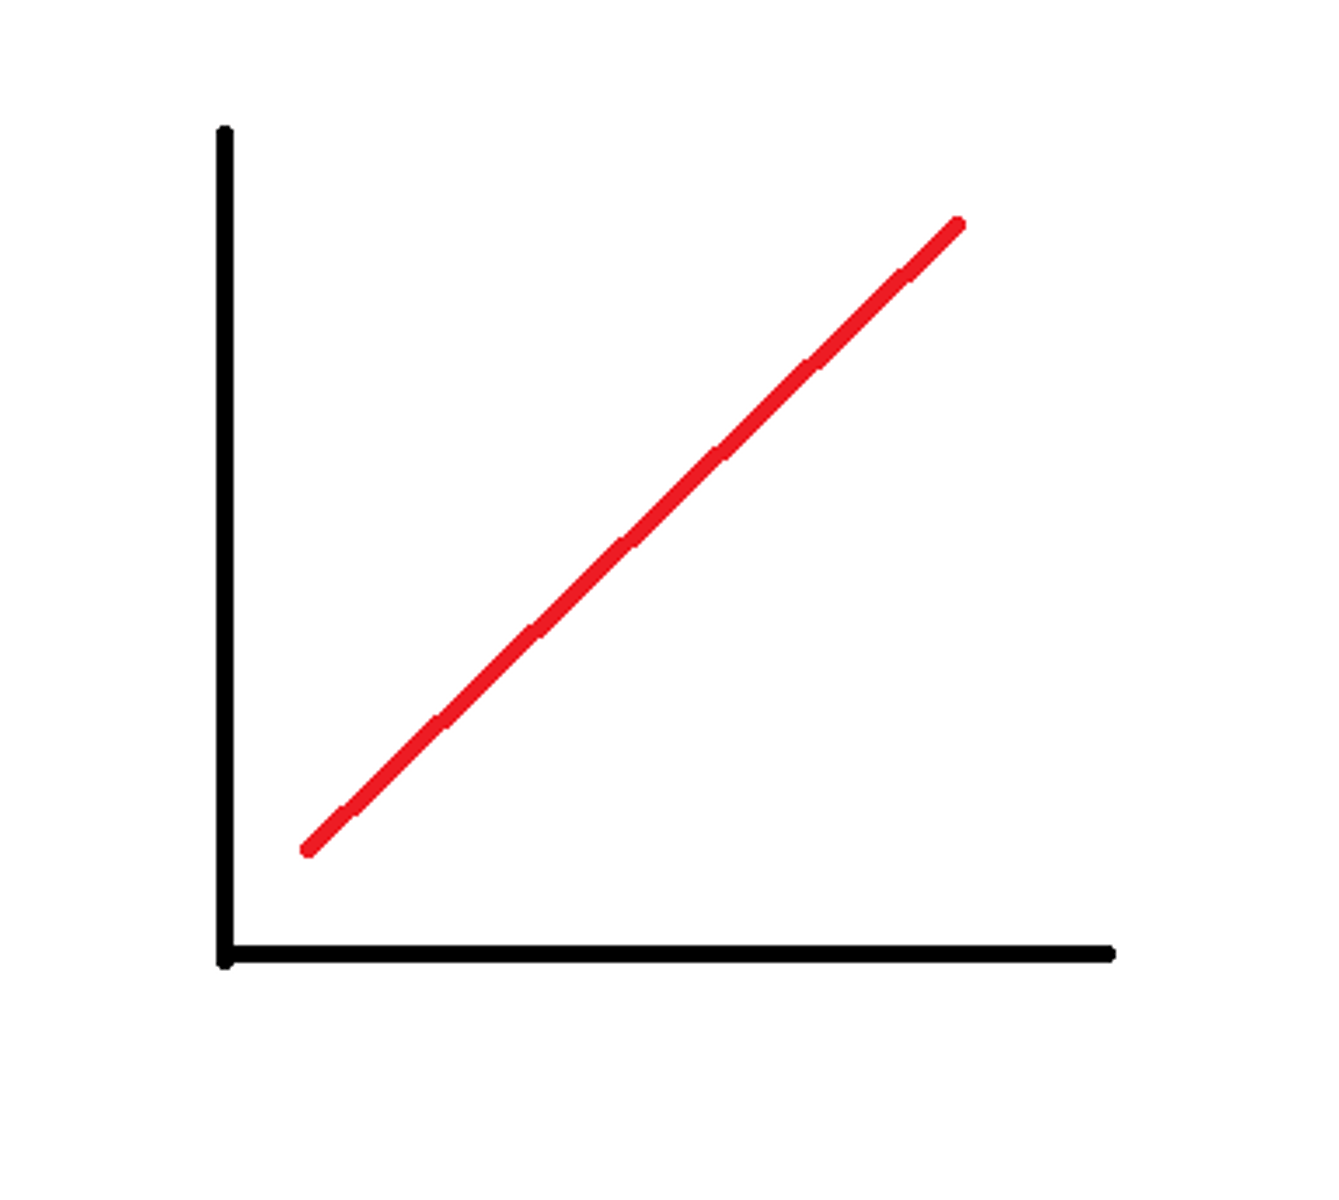
Positive Relationships
An increase in one variable predicts an increase in the other
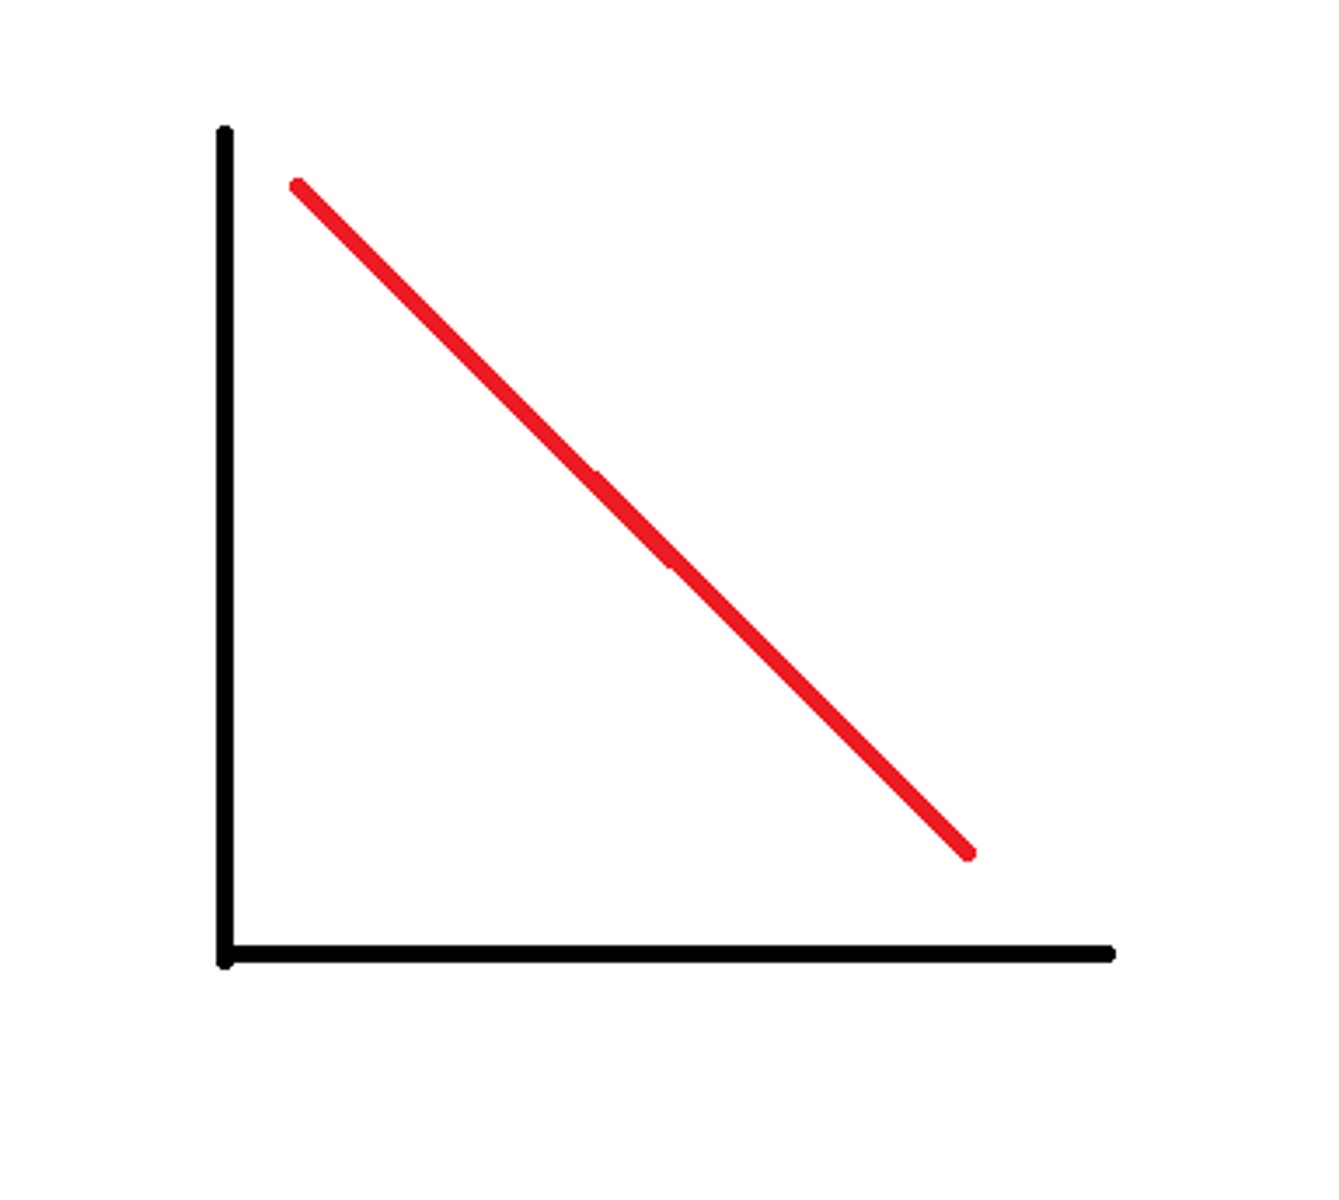
Negative Relationship
An increase in one variable predicts a decrease in the other
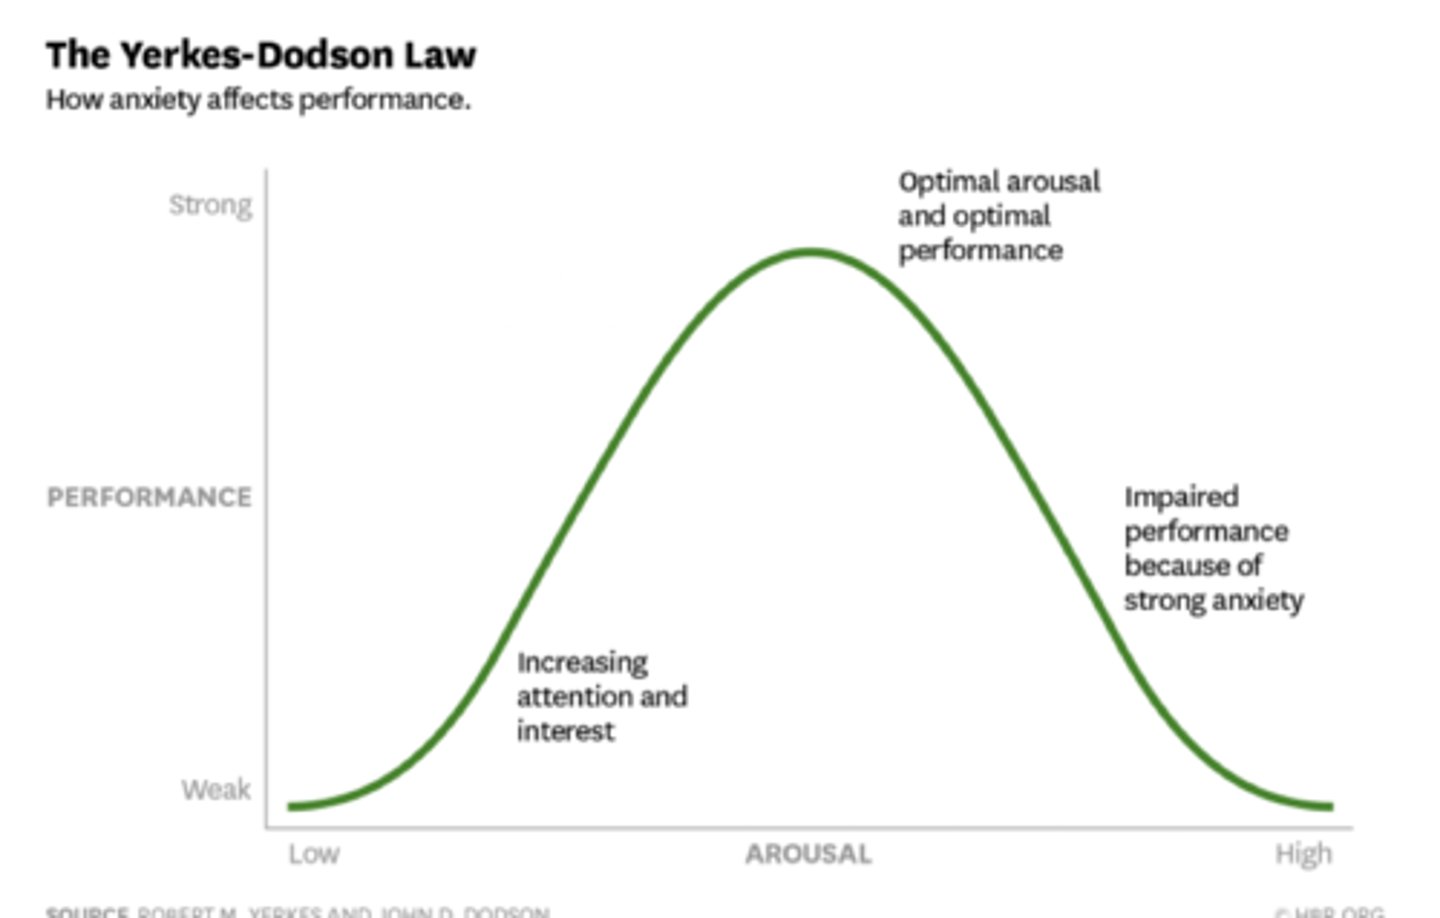
Curvilinear Relationships
Best described with curves
The Pearson Product-Moment Correlation (r)
Varies from -1 to 1
-Weakest/no correlation is 0
-Absolute value of 1 is the strongest correlation
Sign of the coefficient indicates the direction of the correlation
-Positive sign -> positive correlation
-Negative sign -> negative correlation
Assumptions of the Pearson Correlation
-Uses two variables
-Variables are both quantitative
-Variable relationships are linear
-Minimal skew/no large outliers
-Must observe the whole range for each variable
Correlation Setup
Make sure to set variables to scalar measures in SPSS
Compare two different variables for the same set of cases
Significance (P)
p < 0.05 -> significant
p > 0.05 -> not significant
How to write a significant correlation?
There was a significant correlation between a patient's age and the length of hospital stay r(&*&) = .140, p < .000
Parametric Analysis
Pearson: both variables are ratio/interval and normal
Good for linear data
Nonparametric Analysis
-Spearman's rank
-Kendall's tau-b
-ETA
Spearman's Rank
-Appropriate for ordinal and skewed data
-Good for linear data
-Not used often (prefer Kendall's tau-b)
Kendall's Tau-B
-Appropriate for ordinal and skewed data, generally considered superior to Spearman (especially for small groups) and is less affected by error
-Used over Spearman's rank
-Good for linear data
ETA
-A special coefficient used for curvilinear relationships
-Particularly good for nominal by interval analyses
-Good for curved data
Interpreting Correlation Values - Jacob Cohen's 1988 Paper
-Analysis of existing data showed an average correlation in the literature of 0.30
Scale:
-very weak/trivial (0.00-0.10)
-small/minor/weak (0.10-0.30)
-moderate (0.30-0.50)
-large/strong (0.50-0.70)
-very strong (0.70-0.90)
-nearly perfect (0.90-1.00)
-Consider correlation as the variance accounted for (amount of change in 1 variable predicted by another)
-r^2 x 100