Population dynamics
1/76
Earn XP
Description and Tags
Name | Mastery | Learn | Test | Matching | Spaced |
|---|
No study sessions yet.
77 Terms
Population Density
The number of individuals per unit volume or area in a population.
Demography
The study of populations and their measurable characteristics such as size, density, growth rate, and demographic ratios like male to female or old to young.
Population Dispersion
How individuals are spread out within the boundaries of a population, which can be uniform, clumped, or random.
Which one effects how a population grows / impacts an envi: density / dipersion?
Both
Census
A method of determining population density by conducting a complete count of all individuals in an area.
Population Sampling
A method where small subsets of a population are counted and data is extrapolated to estimate the entire population.
Quadrat Method
A population sampling method used for organisms that stay in one place, involving the use of random quadrats to count individuals.
Transect Method
A population sampling method used for organisms that stay in one place, involving the use of transects to count individuals. Uusually comparing 2 sections along a line
Mark and Recapture
A method used to estimate the total population of mobile organisms by capturing, marking, releasing, recapturing, and calculating based on marked individuals in subsequent samples.
Mark and Recapture steps
Steps for Mark and Recapture:
Capture a sample of individuals and mark them.
Release the marked individuals back into the population.
Capture a second sample and note how many are marked.
Use the mark-recapture formula to estimate population size.
Marka dn recpature formula
total population estimate = totoal # marked x total # from 2nd capture / totoal # recapture marked
How to calculate population desity
Population desity = Total # organisms / totoal area
Population Growth
The increase or decrease in the number of individuals in a population over time.
Why do populations grow?
Brith rates
imiigration (negligible)
WHy do population shrink
Deaths
Emigration (negligibe)
Per capita
proportion of the total population size
Per Capita Birth Rate
The average number of births per individual in a population over a specific time period.
Per Capita Death Rate
The average number of deaths per individual in a population over a specific time period.
Growth Rate
The rate at which a population is increasing or decreasing over time.
r=b-d
When is r is positive it means…
when r is positive the population is growing
Logistic Growth
Population growth that is limited by environmental factors and reaches a carrying capacity.
rN (K-N/K) = Delta N / Delta t
Exponential Growth
Population growth that occurs when resources are unlimited, leading to rapid increase in numbers.
rN=delta N / Delta t
As population increases, r increases and growth increases
When does exponential growht happen?
Organisms invading new evi
initial bacteria growht
Survivorship
The number of offspring that survive to adulthood and old age in a population.
What are the 3 Survivorship types?
Type I: High juvenile survisorship, more deaths at old age
Type II: percentage of deaths is consistent
Type III: High mortality early in life, not many survive to reproduce
Fecundity
The average number of offspring produced by a female over her lifetime.
what are the two types of fecundity
Some species produce many young at one time while others produce 1 or 2 several times in their life
Life History
The study of events in an organism's life that impact its growth rate, including birth, reproduction, and death.
Life History Strategies
Different approaches used by species to maximize the survival of offspring to reproductive age.
r selected
k selected
r-Selected Species
Opportunitsts
Reproduce early & produce many, small offspringn
little to no parental care
unpredictable environments where few survive
Used by insects, small sea animals, annual plants, bacteria, rodents
k-Selected Species
Competittors
Species that maximize survivorship of offspringn
Produce few, large offspringn
Often provide parental care to adulthoodn
Do well in competitive conditions when their population is near the carrying capacity of a stable environment.
Most large mammals, birdsn
Are prone to extinction
Why are K-selected strategissts prone to extinction
If the evi changes quickly, the young will likely not survive - small pop
How could K-selected strategistss reqpresetn type 1 survisorship?
If few babaies, but most live to old age
How could r-selected strategistss reqpresetn type 3 survisorship?
If they die early
Population Interactions
The ways in which different species in a community interact with each other, influencing population growth and dynamics.
Density Dependent Limits
Factors that regulate population numbers based on the density of the population, such as food, water, shelter, and disease.
Density Independent Limits
Factors that regulate population numbers regardless of population density, like weather, climate, and floods.
Carrying Capacity
The maximum population size of a species that an environment can sustain indefinitely.
Density-Dependent Population Growth
The concept that population growth rate decreases as the population approaches its carrying capacity.
Regulation
The process by which density-dependent factors limit birth rates or increase death rates in a population.
Examples of desity dependent factors that increase wiht the pop
Dieseas outbreak, stavation, predetion, popuation interactions (very important
Population interactions
Important type of desity dependet regulation that is clasified by its effects (positive, negative, 0)
Competition
Interaction (-,-) where individuals compete for limited resources, leading to effects on population growth.
e.g Lions and hyenes compete for dead animals
Predation
Interaction (+,-) where one species consumes another as food, influencing population dynamics.
prey pop is usually bigger
normaly elads to cycles of both species
Herbivory
Interaction (+,-) similar to predation, but involving plants or algae as prey.
Symbiosis
Interaction where individuals of different species live in direct contact with each other, including mutualism, commensalism, and parasitism.
Population interactions that are symbiotic
Mutalism
Commensalim
Amensalim
Parasitism
Mutualism
Relationship (+,+) where both species benefit from the interaction.
bees and flower
Commensalism
Relationship (+,0) where one species benefits while the other is neither helped nor harmed.
orchids growing on tree for supposrt and access to nutrients
Amensalism
Relationship (-,0) where one species is inhibited while the other is not affected.
blakc walnut tress kills otherplants by secreting chemical from roots
Parasitism
Relationship (+,-) where one organism benefits at the expense of another, harming the host.
tapeworm in intestines (nutrition consumed by tapeworm
Cryptic Coloration
Defense mechanism where an animal is camouflaged by its coloring.
Warning Coloration
Defense mechanism where a poisonous animal is brightly colored as a warning.
How do plants defend themselves?
Plants defend themselves through physical barriers like thorns, chemical defenses like toxins, and signaling compounds to attract predators of herbivores.
What are the two ways pop arpoaches or deals with the k value
smoothly or cycles
Demographic Transition
The transition from high birth and death rates to low birth and death rates in a population.
Industrial Revolution
A period of major industrialization that led to significant advancements in technology and a human population explosion.
Models of Demographic Transition
Developed by demographers to show how changes in birth and death rates alter patterns of population growth.
Age Structure
The distribution of various age groups in a population, which can be determined by demographic transition models.
Stage 1 (Low growth rate)
Characterized by high birth and death rates, slow population growth, and factors like disease and lack of healthcare.
Stage 2 (Early Expanding)
High birth rates, falling death rates, and rapid population growth due to improvements in healthcare and hygiene.
Stage 3 (Late Expanding)
Birth rates start to fall, death rates continue to decline, and population growth slows due to factors like family planning and urbanization.
Stage 4 (Low Fluctuating)
Both birth and death rates are low, leading to a steady population size, typical of developed countries like Canada and Europe.
Population Pyramids
Graphical representations of a population's age and gender distribution, which change as a region goes through demographic transition.
Least economically developed countries
Stage 1
b^:
infant mortality
need workerss
religious beleifes
d^:
desies/famine
dirty water, sanitation
bad healthcare
war/competition
britain 19th centruy, nigeria
Stage 2
B^
D falling:
beater ehalthcaske
cleaner water / sanitation
more food (production/storage)
leess babies die
britain late 19th century, china, brazil
bv and dv:
famil planning available
less abbsies die
mecheanization / urbanization so nonned for that many workers
better standard fo living
women status
Canad , most of europe
B low, D low:
pop steady (higher than ins tage 1)
WHta si frequency
Percentage of quadrats occupies by given speicies
= number of quadrates in which species occure / total number of qutrats *100%
What is relative frequency
comparing the frequency of one species witht he frequency of all species present
frequency of a species / total frequency of al species *100%
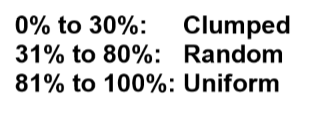
What acnt he frequency tell you about the dispersion pattern?
Abundance is?
number of plants of one species vs al plants
number of plants of a species / total numbe rof plans x 100%
WHta is an indicator of the importance of a plant in a community?
abundance is not an indicator
frequency is
Plants often display clumped dispersion patterns. Other than seed dispersal, what factors are likely at play to create these patterns found in forests and other ecosystems?
Clumped dispersions also happen in habitats that are patchy, with only some patches suitable to live in.
resources are concentrated in small areas within a larger habitat
How do predator prey populations appear on graphs? How are these different than logistic vs exponential growth? Sketch a typical version of each type of graph
Pred and prey apear as acycles compare dot the exponetialy growting or smooth growth and stability graphs of a ligisticor expoenential grwoth.
growht rate in 4 stages of demographic transisiton
1: low growht rate
2: grows fast
3: grwos slowly
4: steady population