Correlation & Regression
1/19
There's no tags or description
Looks like no tags are added yet.
Name | Mastery | Learn | Test | Matching | Spaced |
|---|
No study sessions yet.
20 Terms
Pearson correlation
appropriate for linear relationships
two quantitative variables
normally distributed data
Spearman correlation
monotonic relationships
quantitative/ordinal data
based on the ranks of the data
standard deviation
always positive
normalises the covariance of variables (in Pearsons formula)
correlation
how much and in what direction one variable changes when the other variable changes
regression analysis
aims to create a predictive model
regression line
a mathematical equation that represents the relationship between X and Y
to obtain the equation of the line that best predicts the value of the dependent variable Y based on the values of the independent variable X
main applications
predicting treatment outcomes (prognosis)
identifying risk factors (etiology)
regression line equation
Y=a+bX
a - the predicted value of Y when X is zero (intercept of the Y-axis)
b - the rate of change of Y for a unit increase in X (slope, steepness), direction and magnitude of relationship
least squares method
minimize the sum of the squared vertical distances (residuals) between the observed Y-values and the corresponding values predicted by the regression line
Sum of Squares Total
represents the total variability in the dependent variable (Y) without considering the effect of the independent variable (X)
Sum of Squares Residual Error
represents the unexplained variability in Y, or the variability that is attributed to random error or factors not included in the model
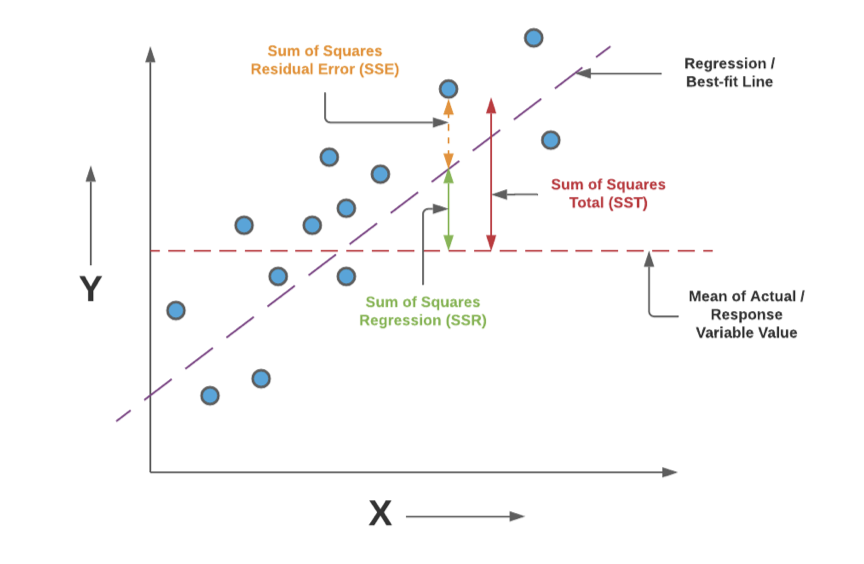
Sum of Squares Regression
measures the variability in Y that can be explained by the regression model, or in other words, the variability due to the independent variable (X)

R2 (the coefficient of determination)
the proportion of total variability explained by the model
higher = better fit
lower = more scattered points
R2=SSR/SST
* SST+SSRegression+SSError
F statistics
the overall significance of the regression model
taking the ratio of the Mean Square for Regression (MSR) to the Mean Square for Residuals (MSE)
If the F-statistic is significantly different from 1, it suggests that the regression model is providing a better fit than a model with no independent variables.
Regression Degrees of Freedom
is equal to the number of independent variables in the regression model
Error Degrees of Freedom
Equal to the total number of observations minus the number of parameters estimated
the b coefficient
b is the estimated coefficient for the independent variable from the regression model
is associated with a t-statistic,
the null hypothesis is that the true population value of the coefficient is equal to zero
H0: b = 0
t value
bx/SE(bx)
SE(bx)
square root of the residual Mean Squares divided by the Degree of Freedom associated with the residuals multiplied by the variance of the independent variable
Confidence interval for the b coefficient
coefficient for the independent variable from the regression model ± the critical value x the standard error of the coefficient