Lecture 8 - Hypothesis Testing & Linear Regression
1/6
There's no tags or description
Looks like no tags are added yet.
Name | Mastery | Learn | Test | Matching | Spaced |
|---|
No study sessions yet.
7 Terms
ANOVA Test
Analysis of Variance, used when there are more than two groups/levels of a cateogorical variable in which we want to compare some sort of quantitative response variable.
The null hypothesis would state that all the groups are the same
The alternative hypothesis would state that there is at least one group that is different from the rest
It uses the F-statisatic, which helps us find the p-value on the F-distribution (it’s just a downwarn curve)
We can use R code to calculate it for us, there are two ways to do it (use the lm function)
lm(response_variable ~ sample_categorical_variable, data = dataset)
anova(lm_object_name)aov(response_variable ~ sample_categorical_variable, data = dataset)
summary(aov_object_name)
The code above also gives us the p-value that we’d use to derive an appropraite conclusion.
With summary(object_name)$coef, we can also see the individual comparisons between groups.
It helps us understand which groups are actually different from one another (if there is a difference)
It’ll compare the group that is alphabetised first to the rest of the groups
Linear Regression
We can infact use a linear model in place of all the other statistical tests as seen with the lm() function. Typically, it’d give us a linear regression which allows us to make point predictions based on a given quantitative explanatory variable.
However, in order to apply a linear regression, it has to fulfill some assumptions:
Data are independent (can’t be checked with R, depends on sampling methods)
Linear relationship between x and y (scale-location plot)
Residuals have constant variance (residual vs. fitted plot)
Residuals are normally distributed (normal QQ plot)
We can check for the last three with some plots generated with the code
gglm: :gglm(lm_object)
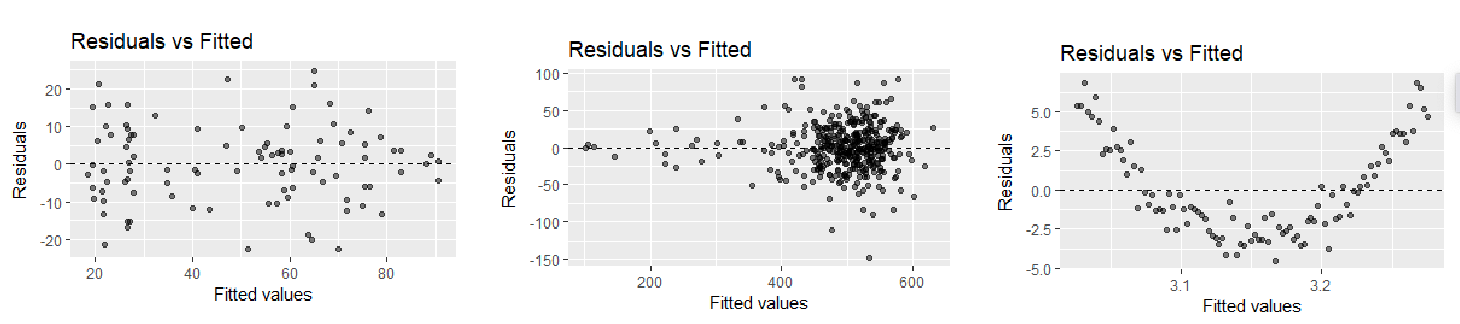
Residual vs. Fitted Plot
Used to detect non-constant variance, the residuals are plotted against its corresponding explanatory value, and we hope to see no pattern
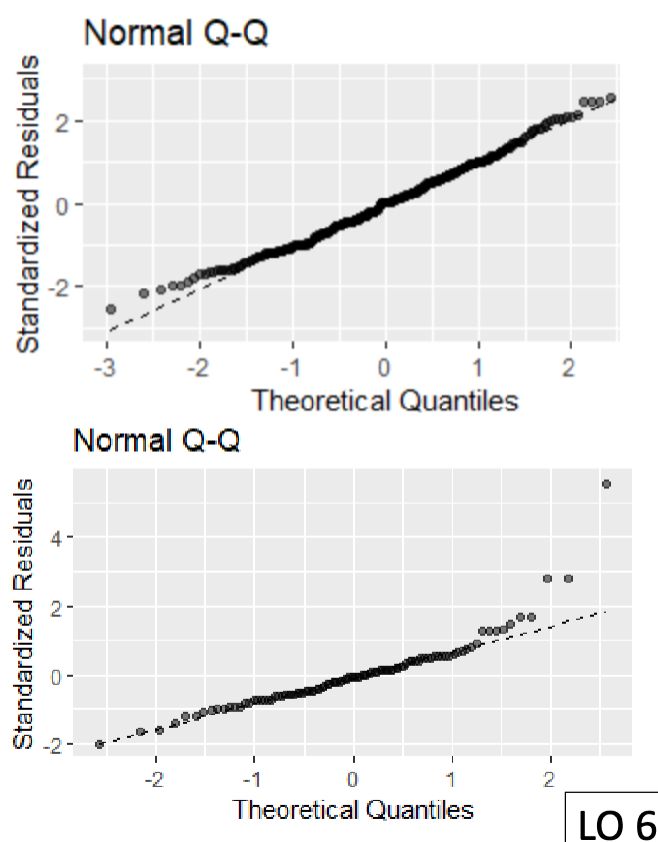
Normal QQ Plot
Used to detect departures from normality, compares each observation to the corresponding quartile expected from the standard normal distribution, we hope to see a roughly diagonal line following the dashed line and no substantial curvature/jumps from the line
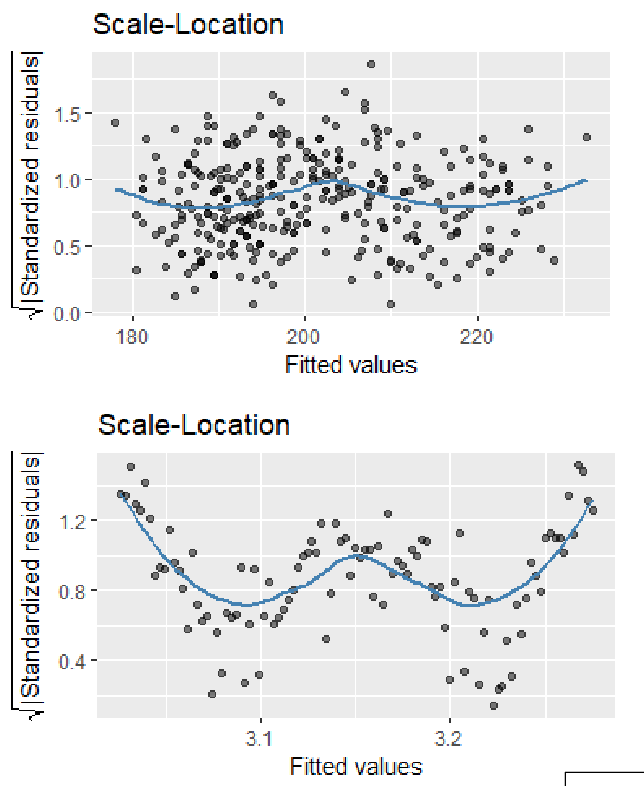
Scale-Location Plot
Used to detect non-linearity and non-stance variance, similar to residuals vs. fitted plot, we hope to see a horizontal line where the spread doesn't vary with fitted values (try to ignore the blue line)
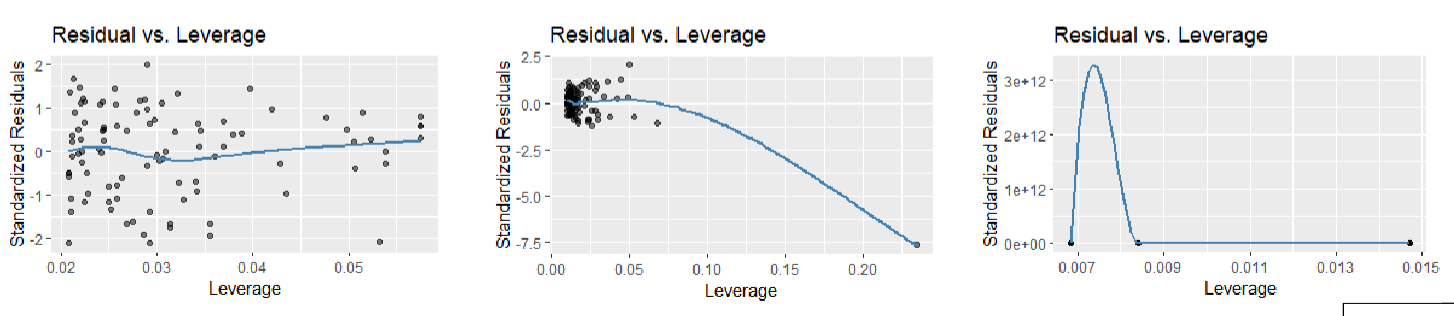
Residual vs. Leverage Plot
Used to detect influential observations (outliers) to our linear regression analysis, we hope to see no outlying values (upper/lower right-hand corner) and no observations outside of dashed line,
Deviations From Assumptions
If the model assumptions aren't met, there are several things we can do to bypass it:
Ignore the violations (when large sample size)
Transform the data (log transform)
Use a non-parametric test (ranks)
Use a permutation/randomisation test
Remember that anytime we use data from a sample, we are always trying to infer onto population parameters