AP Microeconomics Unit 3
1/38
There's no tags or description
Looks like no tags are added yet.
Name | Mastery | Learn | Test | Matching | Spaced | Call with Kai |
|---|
No analytics yet
Send a link to your students to track their progress
39 Terms
The Law of Diminishing Marginal Returns
As variable resources increase, the additional output produced from each unit of input eventually decreases.
Short Run
A period in which at least 1 resource is fixed
Long Run
All resources are variable, none are fixed
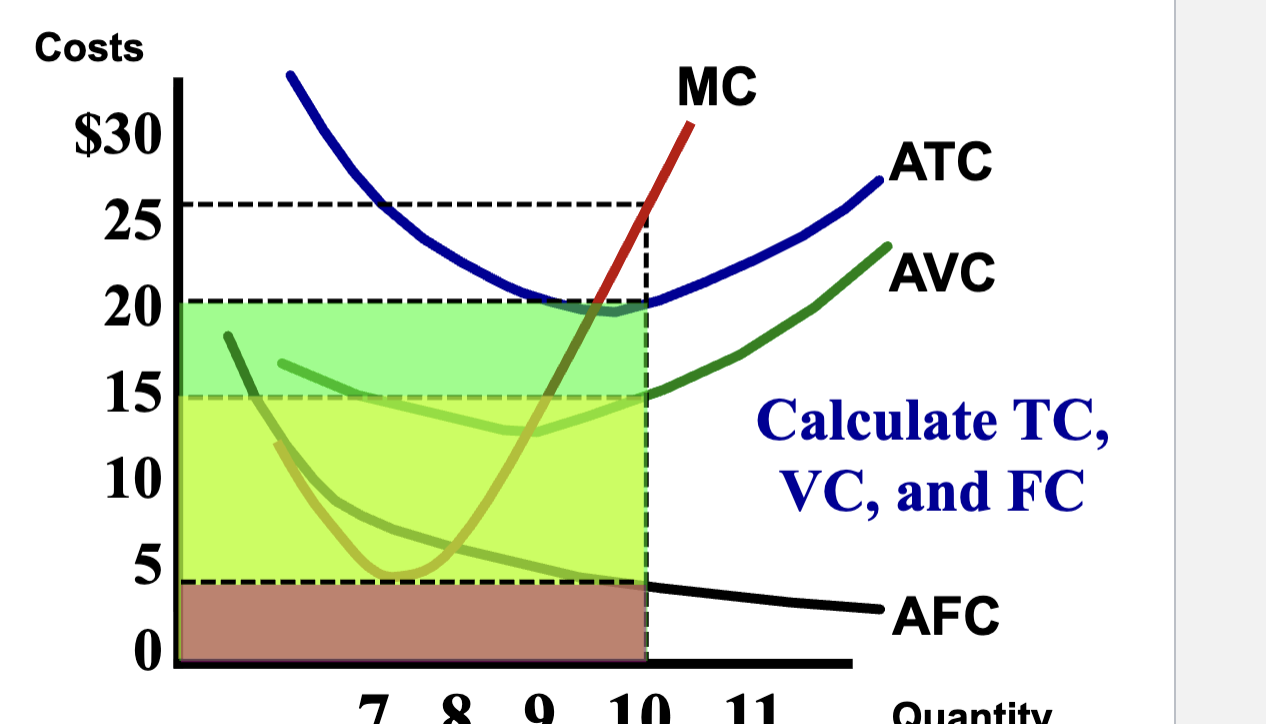
Average Fixed Costs Curve Characteristics
Has a negative slope and is always decreasing, flattens out over quantity produced but will never reach zero
ATC and AVC Will Never intersect
Average Variable Costs Curve Characteristics
Starts decreasing, then when it intersects with MC, it begins increasing.
Becomes closer and closer to the ATC, but will never intersect it
Average Total Costs Curve Characteristics
Has a parabola like shape, intersects with MC at it’s lowest point (like the vertex)
Marginal Cost Curve Characteristics
Strats decreasing due to worker specialization, then like the Nike Swoosh increases again due to Law of Diminishing Marginal Utility
Intersects both ATC and AVC at their lowest points
Effects of Change in Fixed Costs (2)
AFC and ATC Change
Effects of Change in Variable Resource Costs (3)
Changes MC, AVC, and ATC
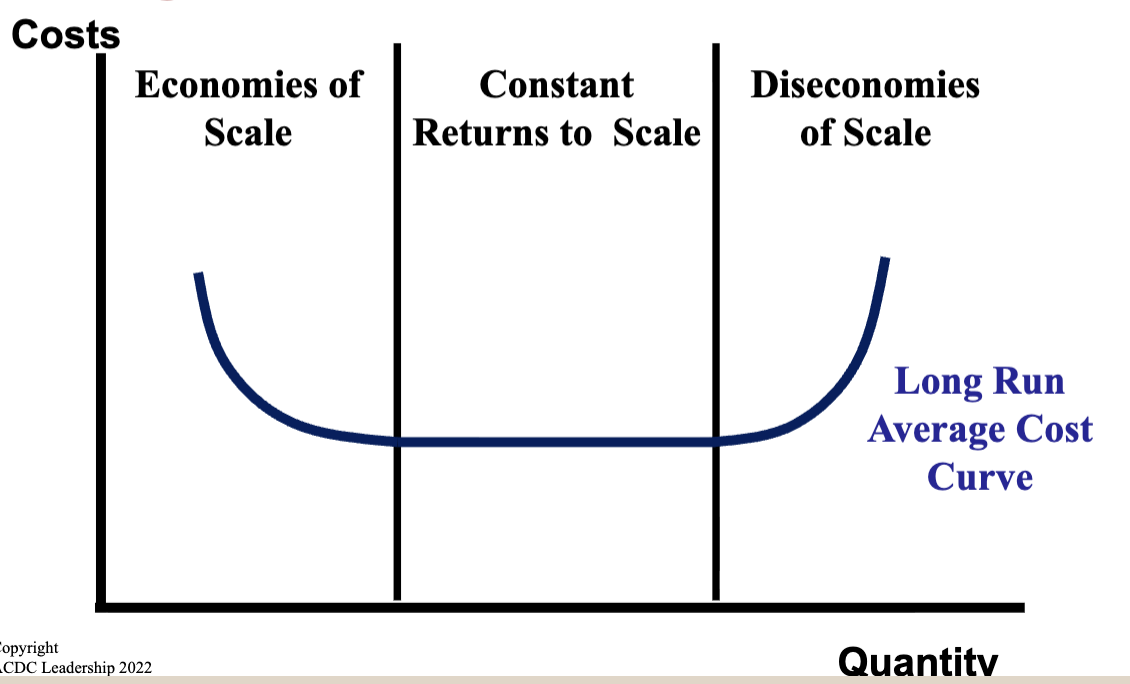
Economies of Scale
Due to mass production techniques and specialization, firms begin having lower per-unit costs
Diseconomies of Scale
Per-unit costs begin increasing as the firm becomes too big and difficult to manage
Long Run Average Cost Curve
Short Run Production Cost Curves (MC, ATC, AVC, AFC)
Accounting Profit
Looks at total revenue minus accounting (explicit) costs, does not include opportunity costs
Economic Profit
Includes opportunity costs that forms pay when using resources, as well as explicit costs
Normal Profit
Price intersects MC and ATC at the same point, with AVC still below ATC
Short-Run Profit Maximization Formula
Firms should continue to produce until the additional revenue from each new output equals the additional cost, in other words, when MR = MC
Shutdown
Is temporary, so firms still have to pay fixed costs
Shutdown Rule
A firm should continue to produce as long as price per unit is above AVC (the minimum of AVC). This means that at least loss is less than the fixed cost
When the point on the MC that is being produced at is above the minimum of the AVC
Short Run Supply Curve
Is equal to the MC line from the point where it intersects the minimum of the AVC and onwardW
When would other firms enter the market in the long-run?
If firms are making profit, then other firms have an incentive to enter
High Barrier to Entry Market Characteristics
Have less competition, and individual firms make more profit
Low Barrier to Entry Markets
Have more competition, and individual firms make less profit
Marginal Revenue Curve
If price is constant, then MR is a horizontal line at the market price
Four Market Structures
Perfect competition, monopolistic competition, oligopoly, monopoly
Characteristics of Perfect Competition
Lots of small firms that sell identical products
Low barriers to enter and exit
Sellers have no need to advertise goods, and they are price-takers with the industry setting the price
Characteristics of a Monopoly
One firm is the market, they have a unqiue product with no substitutes
There are high barriers to entry
The monopolies are the price setters
Perfect Competition Market Supply and Demand Graph
A normal supply and demand curve (X shape)
Perfect Competition Individual Firm Supply and Demand Graph
MR=D=AR=P horizontal line
Where MC intersects MR is where quantity is produced
Whether ATC is below, touching, or above at that line determines what kind of profit the firm is earning
Long Run Equilibrium
No firm has any reason to enter or leave becuaes they are making normal profit (earning zero economic profit)
ATC touches the point where MC=MR
Firms are allocatively and productively efficientPr
Productive Efficiency
Producing at the lowest possible cost (the minimum of the ATC)
Types of Barriers to Entry
Economies of scale (natural monopoly, only one company can utilize resources without needing to shutdown)
2. Superior Technology
3. Geography or Ownership of Raw Materials
4. Government Created Barriers (ex. patents)
Allocatively Efficient
In the short-run, perfectly competitive firms are always allocatively efficient
This means they are producing exactly what society wants, when P = MC
Oligopolies
There are less than 10 large producers and high barriers to entry
The firms control the price
Firms must worry about the decisions of their competitors, there is mutual interdependenceMon
Monopolistic Competition
There is a relatively large number of sellers with differentiated products
Firms have some control over price, and there is a lot of advertisign competition
Low barriers to entry
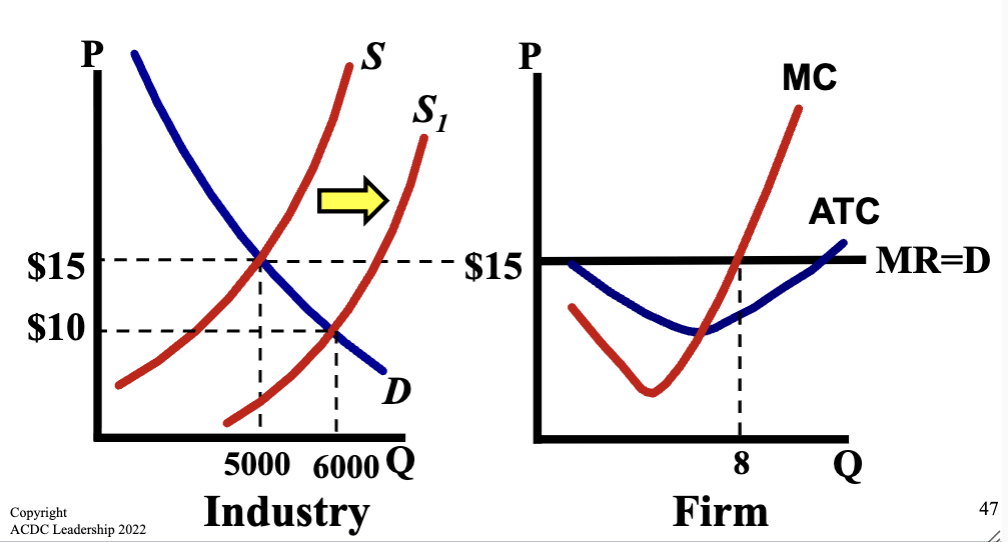
Graph when Profitable Market Moves Short Run → Long Run
Firms enter the market and supply shifts to the right
This causes price to decrease and quantity to increase, creating a new equilibrium price that firms must accept
This new price decreases quantity sold and lowers price, ending up at zero economic profit
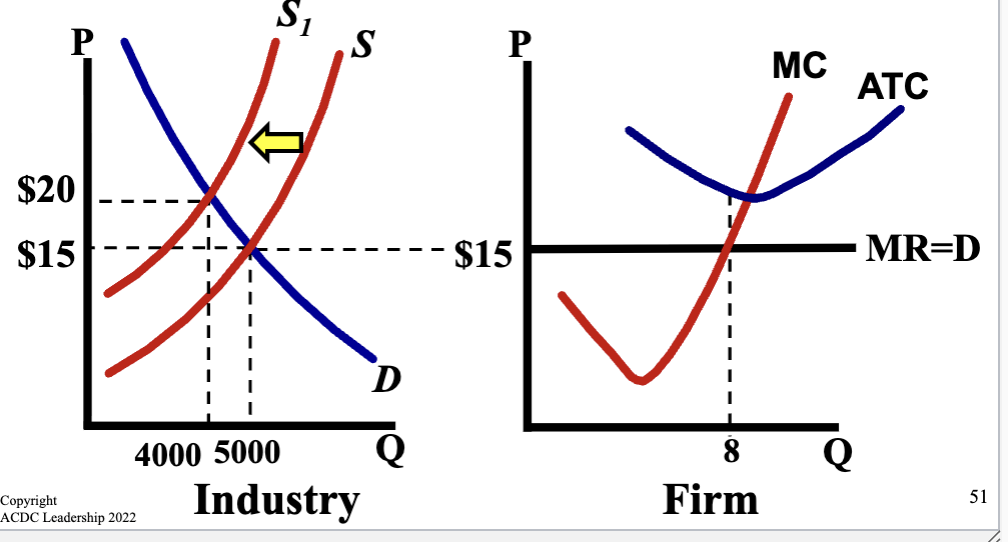
Graph when Unprofitable Market Moves Short Run → Long Run
Firms leave the market so the supply curve shifts to the left
This causes the price to increase and quantity to decrease, creating a new and higher equilibrium price
For firms this leads to higher quantity produced and higher price, ending up at zero economic profit
Constant Cost Industry
When going from the long run to the long run, new firms entering the market does not change input prices
Long-run average cost stays the same and firms keep making normal profit, maintaing allocative and productive efficiency
Long-run market supply (connecting the two equilibriums) is perfectly horizontal
Increasing Cost Industry
The entry of new firms raises input prices, causing long-run ATC to increase
The long run supply (connecting 2 equilibriums) is upward sloping, with the market price not returning back down