Thinking Like an Analyst 1 - Data Analysis Workflow & Measurement Planning
1/25
Earn XP
Description and Tags
Data Analysis Workflow & Measurement Planning
Name | Mastery | Learn | Test | Matching | Spaced |
|---|
No study sessions yet.
26 Terms
What 3 core skills make an Analyst great?
Technical proficiency, Strategic thinking, and good communication skills (The Analytics Trifecta).
What is strategic thinking?
Putting yourself in the mindset of the business owner. Strategic thinking is seeing the big picture, spotting what will drive success or failure, choosing priorities, and mapping actions to hit goals and fix pain points.
What does a Data Visualization Specialist do?
Turns data into clear charts and dashboards that tell a story, highlight the key insight, and guide decisions. Chooses the right visual, checks accuracy, and makes it easy for anyone to read.
What does a Data Engineer do?
Data Engineer: Builds and maintains the pipelines and platforms that move, clean, and store data so others can use it.
What does a Database Administrator (DBA) do?
DBA: Keeps databases healthy, fast, secure, and backed up; controls access and fixes issues.
Why are “Communication Skills” important, and what’s the most effective way to do it?
Stakeholders are more likely to make decisions when insights are communicated through engaging stories and effective visuals, rather than isolated data points.
What objective is at the core of all analytic roles (Many Flavors of Analytics)?
Analize a company’s data to make smart, data-driven decisions that lead to better outcomes.
True or False? Strategic, technical, and communication skills are all equally important (Trifecta).
True
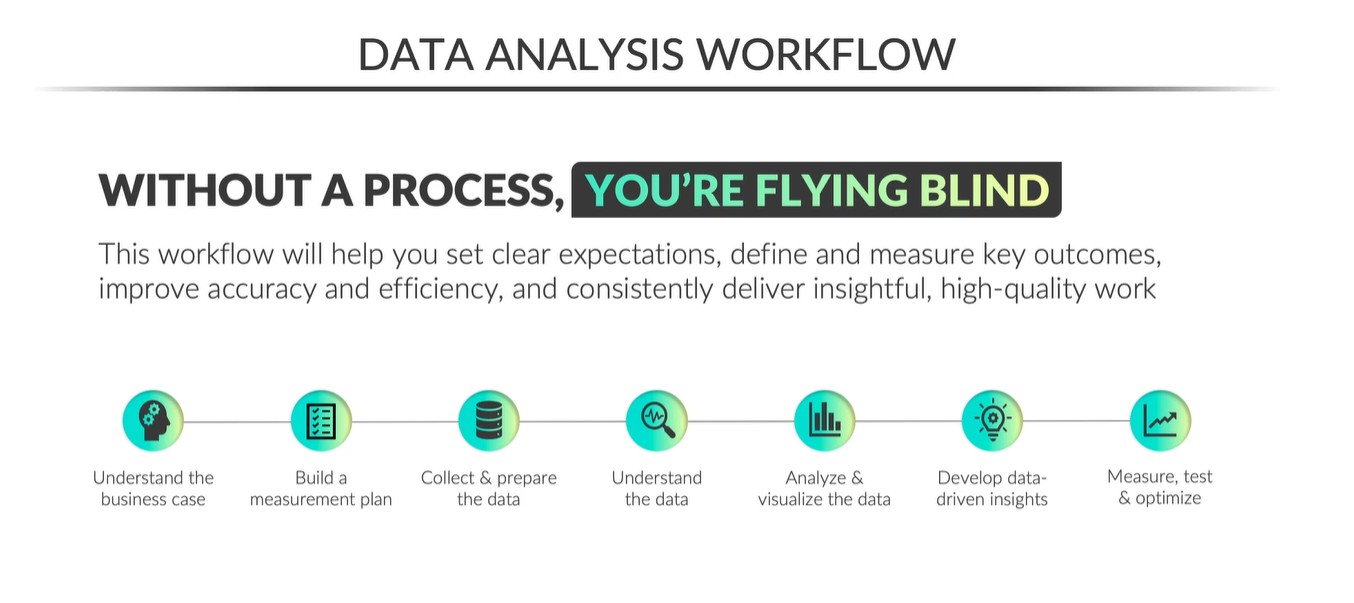
What is a Data Analysis Workflow?
A step-by-step repeatable process/ framework used by analysts to collect, process, and analyze data to derive actionable insights, encompassing stages like understanding the business case, data collection, cleaning, exploration, visualization in order to capitalize off of the insights gained from the analysis (Set expectations, define & measure KPI’s, & Improve accuracy of work).

What does it mean to “understand the business case” (Step 1 of Data Analysis Workflow)?
Think like a business owner understanding which specific outcomes you are trying to target, what motivates the stakeholders, and how your analysis fits into the big picture.

What does it mean to “build a measurement plan” (Step 2 of Data Analysis Workflow)?
Drafting a measurable roadmap for your analysis. Defining exactly what a successful outcome looks like, which key metrics/ KPI’s align with the outcome, and which data to capture to best measure performance against those goals. (Everybody’s on the same page, using the EXACT same metrics and vision to obtain success).

What does it mean to “collect & prepare the data” (Step 3 of Data Analysis Workflow)?
It takes a long time to build trust and only seconds to lose it so data has to be prepped “carefully” by ensuring accuracy, completeness, and relevance. This includes gathering data from various sources, cleaning it to remove errors or inconsistencies, and structuring it for analysis to ensure reliable insights. (Q/A, Data profiling, ETL automation, cleaning data is roughly 80% of the workload).
Key questions:
Where is my data stored and how can I access it?
Are there quality issues that need to be fixed?
Will I need to model or transform the data before analysis?

What does it mean to “understand the data” (Step 4 of Data Analysis Workflow)?
Biggest mistake is making data assumptions. You should have a crystal-clear understanding of the scope, granularity and composition of you source data, especially if your analysis requires some level of industry knowledge or domain expertise.
What exactly does each record represent?
Which fields are most relevant to my analysis?
Are there important nuances or industry-specific metrics?

What does it mean to “analyze & visualize the data” (Step 5 of Data Analysis Workflow)?
The human brain struggles to analyze RAW data, so visualizations help to make patterns, visual cues, and insights clearer. This step involves using various tools and techniques to create charts, graphs, and other visual aids that depict key findings and trends, thereby facilitating more informed decision-making.

What does it mean to “develop data-driven insights” (Step 6 of Data Analysis Workflow)?
Remember that you DON’T get paid to analyze data; you get paid to deliver insights & real, tangible outcomes for the business.
What key takeaways are we able to derive from the data?
How can we use these insights to impact real outcomes?
How can I convince stakeholders to take action?
What does it mean to “Measure, test & optimize” (Step 7 of Data Analysis Workflow)?
This step focuses on assessing the effectiveness of implemented strategies through rigorous testing and measurement (Track pre/post changes to your KPI’s). It involves continually refining and optimizing processes based on data-driven insights, ensuring that decisions lead to improved outcomes and alignment with business objectives.
Did my recommendations produce the desired outcomes?
What value did this analysis generate for the business?
Can this analysis help inform future tests or optimizations?

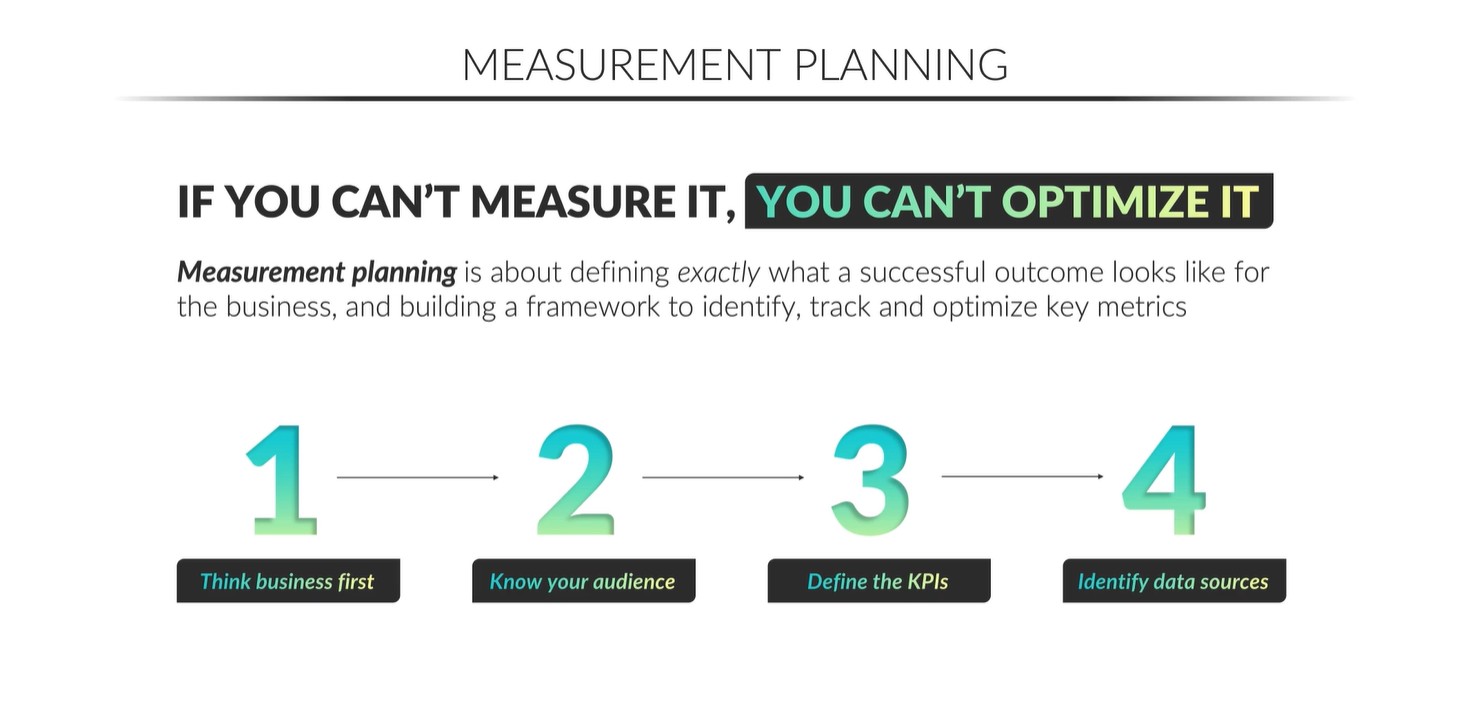
What is “Measurement Planning”?
Measurement planning is about defining exactly what a successful outcome looks like for the business, and building a framework to identify, track, and optimize key metrics.
If you can’t measure it, you can’t optimize it!
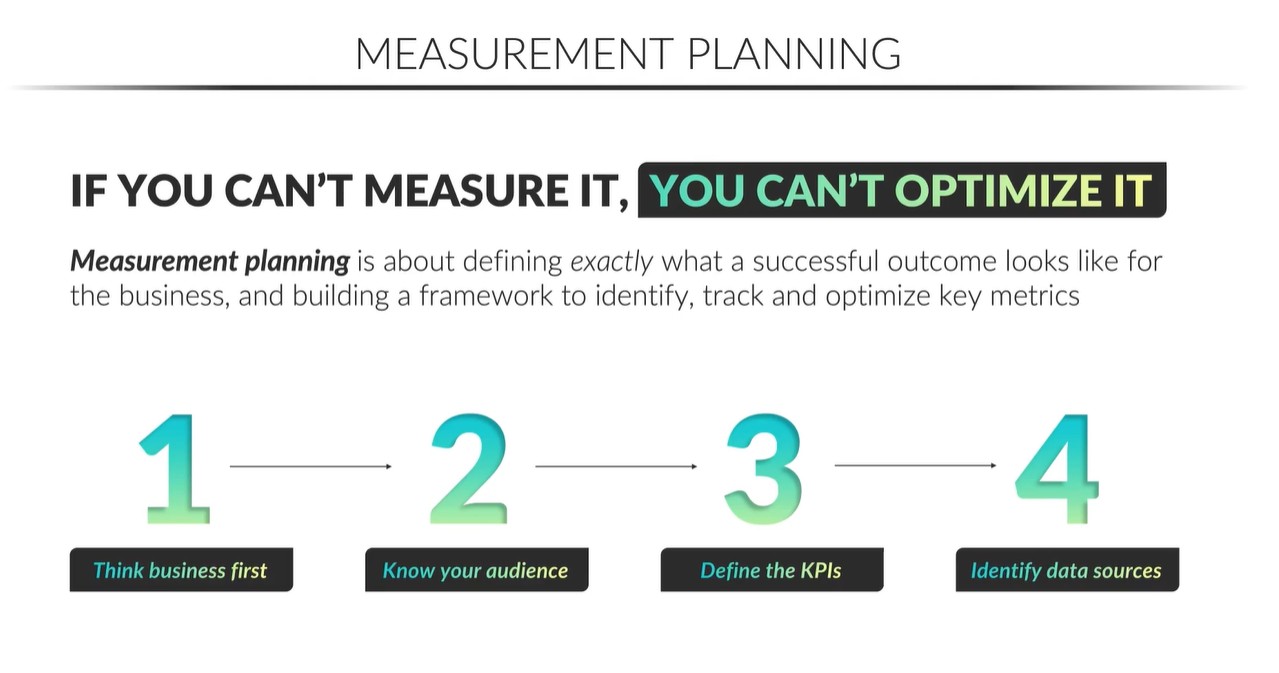
What are the 4 steps of a “Measurement Roadmap”?
Think business first.
Know your audience.
Define the KPI’s.
Identify data sources.

Explain step 1 “Thinking business first” of the (Measurement roadmap).
One of the biggest pitfalls for Analysts is jumping into data too quickly. Before you start thinking like an analyst, you MUST think like a “business owner” first.
What are the key business goals and objectives?
Where does this analysis fit into the overall business?
What are the most important questions stakeholders need answers too?
What types of actions do you want them to take after seeing your analysis?
Reminder: You are NOT getting paid to analyze data, you’re getting paid to drive business outcomes!
STEP 1: THINK BUSINESS FIRST questions you should be asking.
1. What are the high‑level goals of the Maven Muscles business?
2. How does the call center support those business goals?
3. What are the most important goals for the call center?
4. What questions should you try to answer for call center leadership?
5. What actions can you imagine leadership taking based on your data?
STEP 1: THINK BUSINESS FIRST
1. What are the high‑level goals of the Maven Muscles business?
• Revenue, profit, high customer retention, customer satisfaction
2. How does the call center support those business goals?
• Help customers sign up, reduce customer churn, identify and resolve issues quickly
3. What are the most important goals for the call center?
• Sign up new customers, keep existing customers subscribed and happy
4. What questions should you try to answer for call center leadership?
• Signups going up/down? Answering calls quickly? Are we staffed right? Are customers satisfied or churning?
5. What actions can you imagine leadership taking based on your data?
• Changing schedules to match call demand. Incentivizing employees based on performance. Identifying problems.

Explain step 2 “Know your audience” of the Measurement roadmap.
After thinking about the business impact, focus on the key stakeholders next; who are they, what do they need, and how will your analysis support them (people like help in their roles)?
Who is the primary audience you are designing the measurement plan for?
What are their goals and incentives? What do they care most about?
Are there multiple stakeholders who will be impacted by your analysis (affected in a good or bad way)?
What type of information would inspire them to take action?
PRO TIP: It’s okay to ask! After thinking on your own first, run your ideas by stakeholders to make sure you’re on the right track.

STEP 2: KNOW YOUR AUDIENCE questions you should be asking.
1. What is your primary stakeholder most interested in? What are her goals?
2. What information should you provide to help her do her job well?
3. What are the COO and CEO most interested in?
4. What are the call center Managers most interested in?
5. What information do Managers need to make their teams more effective?
STEP 2: KNOW YOUR AUDIENCE questions you should be asking.
1. What is your primary stakeholder most interested in? What are her goals?
• Signups, Close Rates on calls, Customer Retention, Customer Satisfaction, Call Center Efficiency, etc.
2. What information should you provide to help her do her job well?
• Help her monitor the metrics above (trends), highlight areas where she can make impactful changes. Make her look good.
3. What are the COO and CEO most interested in?
• Revenue, Profit, High Customer Retention, Customer Satisfaction
4. What are the call center Managers most interested in?
• Hitting their signup and customer satisfaction goals, improving their team
5. What information do Managers need to make their teams more effective?
• Help them see individual‑level performance and highlight any opportunities for improvement
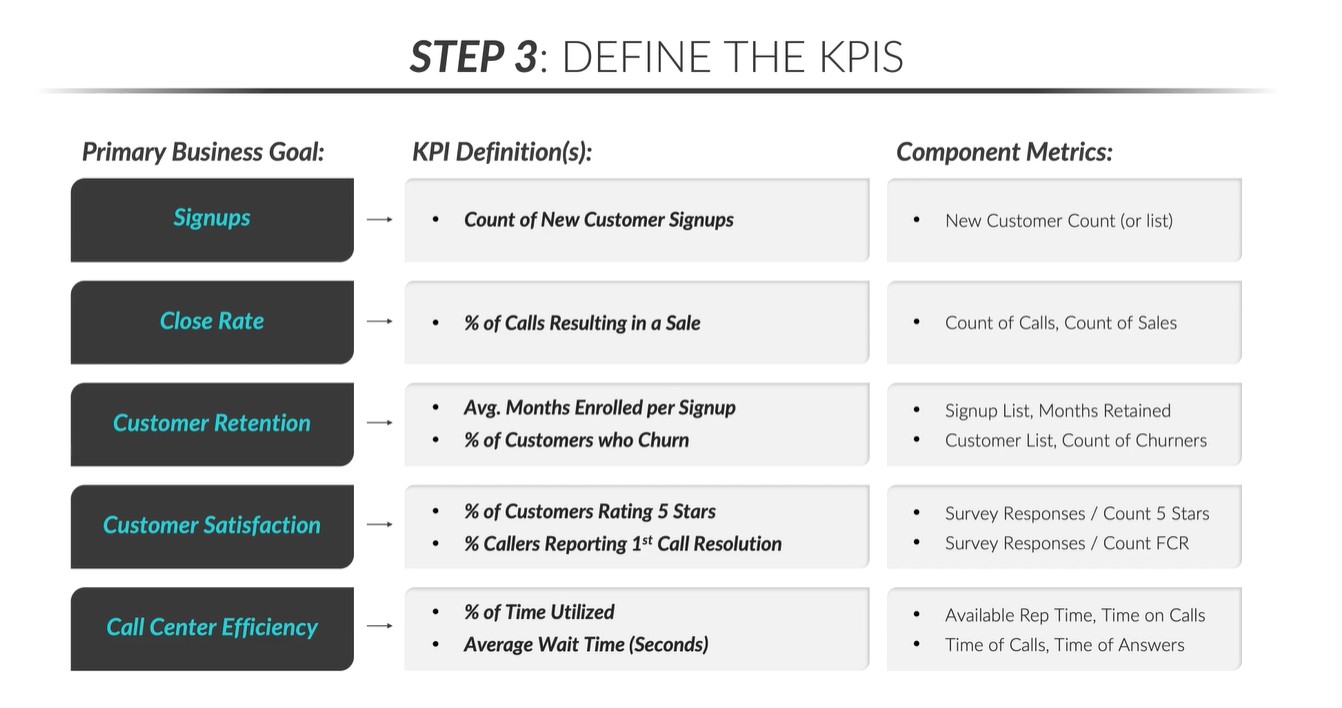
Explain step 3 “Define the KPI’s” of the Measurement roadmap.
Once you understand the business impact and stakeholder needs, you’re ready to start identifying Key Performance Indicators (KPI’s) and supporting metrics.
Which business goals have you already identified?
For each goal, which metrics can be used to accurately measure it?
Which of those are most important for your stakeholders?
Thinking one level deeper, what other supporting metrics might help you optimize or make decisions to improve your KPI’s?
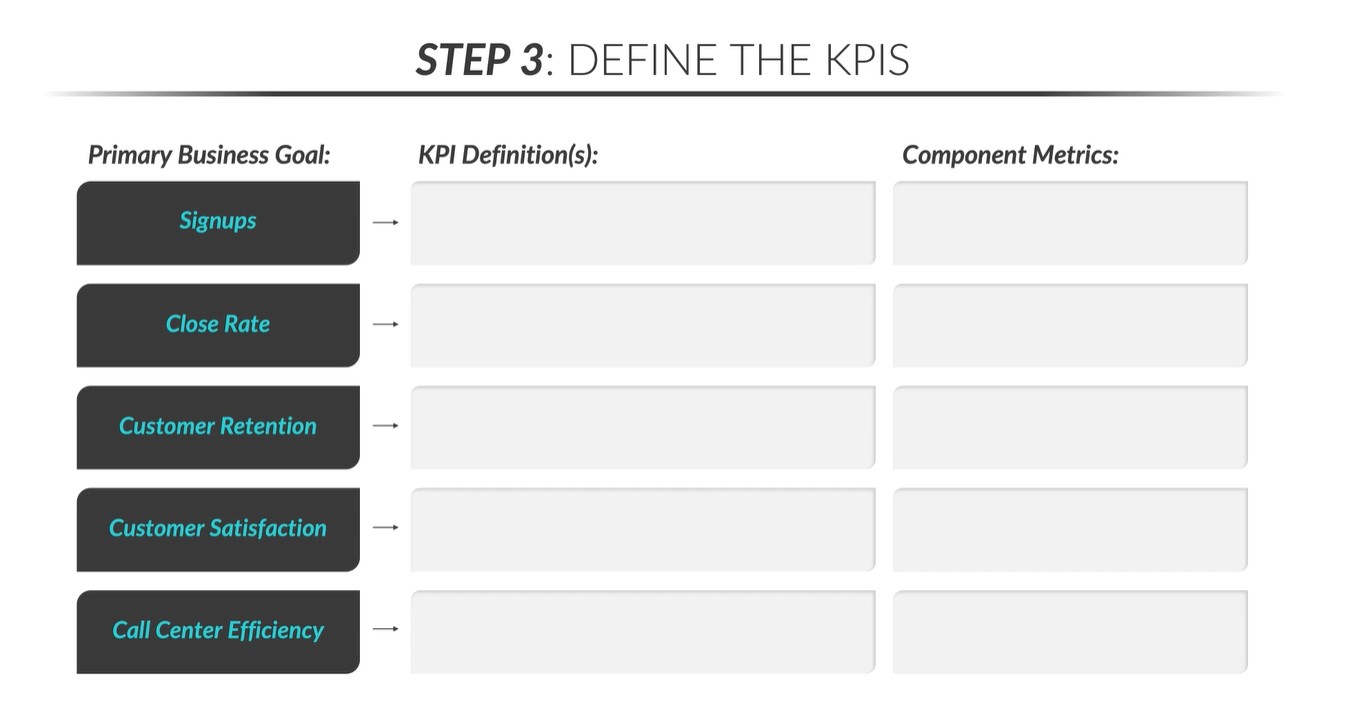
What are some good KPI definitions for Maven customer call center?.
See attached chart.
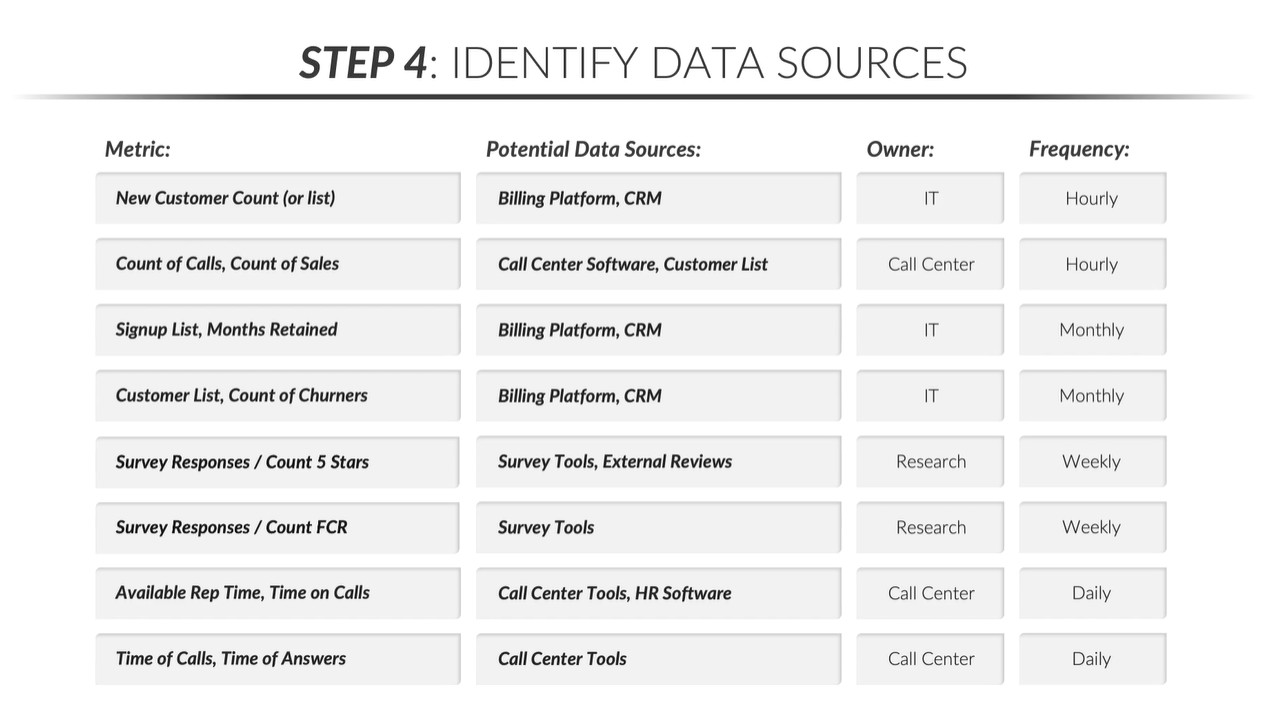
Explain step 4 “Identify data sources” of the Measurement roadmap.
After identifying your KPI”s and supporting metrics, it’s time to think about what data you need, where to source it, and how to prepare it for analysis.
Which sources provide the data you need to track each metric?
Who owns or manages each data source?
How frequently is each data source refreshed?
Can you automate or streamline the data collection process?
PRO TIP: As part of your measurement plan, create a shared document to clearly define all data requirements (metrics, sources, owners, frequency, caveats, etc.).
Example: Consider integrating data from CRM systems, customer feedback tools, and call center software to enhance monitoring and reporting.
Where to gather the data we need (Identifying Data Sources).
See chart attached.