Epigenetic variation between urban and rural populations of Darwins finches
1/13
Earn XP
Name | Mastery | Learn | Test | Matching | Spaced |
|---|
No study sessions yet.
14 Terms

Figure 1
Question: What are the locations and species studied?
Methods: Geographic mapping of study sites on Santa Cruz Island and photographic identification of finches
Results: Study sites include a rural area (El Garrapatero) and an urban area (Academy Bay). Photos depict the studied finch species.
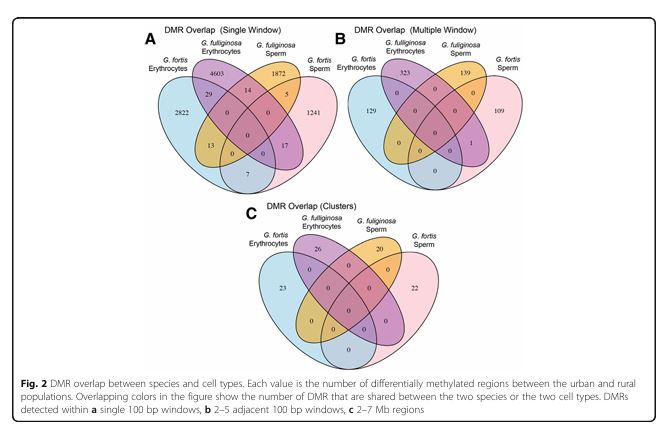
Figure 2
Question: Are there overlaps in DMRs between species and cell types?
Methods: Comparison of DMRs identified in erythrocytes and sperm for both species using statistical clustering.
Results: Minimal overlap was observed in DMRs between species or cell types, indicating species- and cell-specific epigenetic responses.
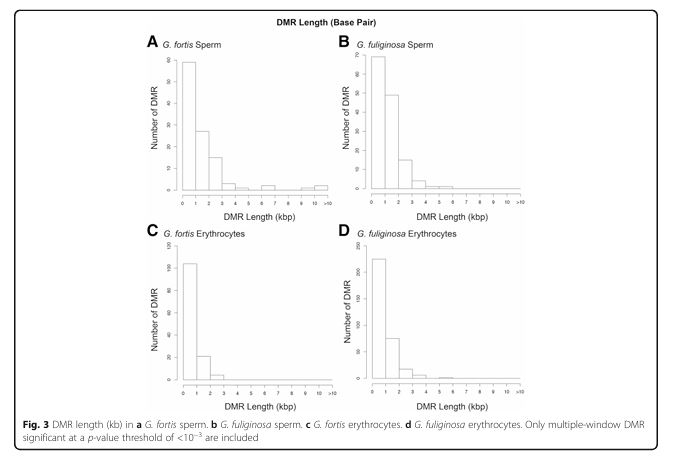
Figure 3
Question: What is the typical length of DMRs?
Methods: Calculation of DMR length based on sequencing data.
Results: Most DMRs were 500–1000 bp long, with differences observed between species and cell types.
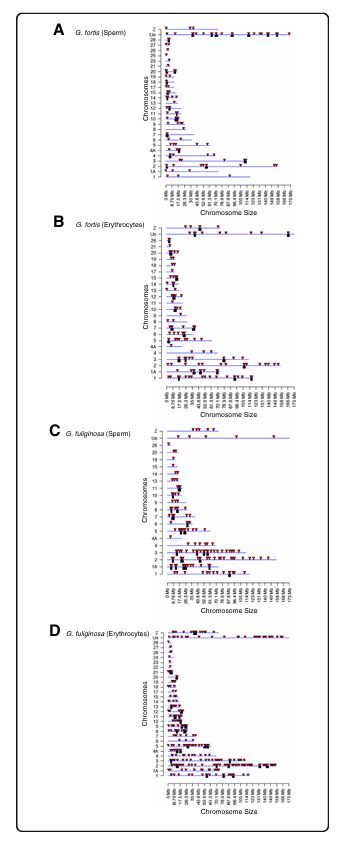
Figure 4
Question: What are the chromosomal locations of DMRs?
Methods: Mapping DMRs to chromosomes based on zebra finch genome alignment.
Results: DMRs were distributed across all chromosomes, with clustering observed in some regions.
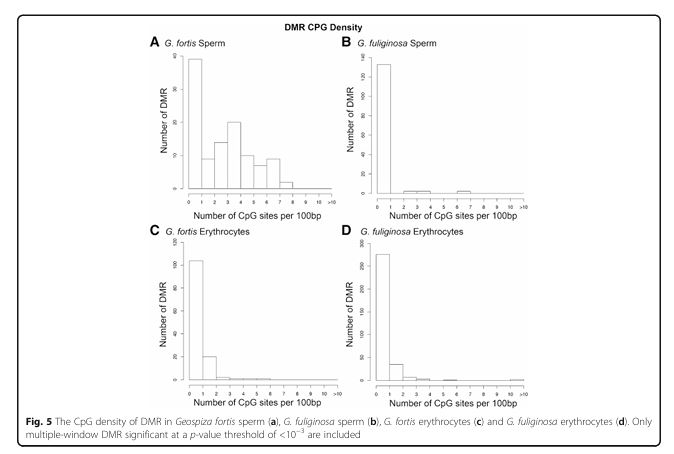
Figure 5
Question: What is the CpG density of DMRs?
Methods: Analysis of CpG site density within DMRs.
Results: DMRs in G. fortis sperm had higher CpG density, while those in other groups were predominantly in CpG-poor regions.
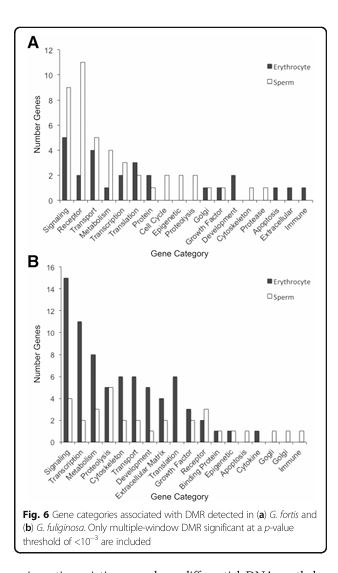
Figure 6
Question: What gene categories are associated with DMRs?
Methods: Annotation of DMR-associated genes and their functional categories.
Results: Genes related to metabolism, cell signaling, and transcription were most commonly associated with DMRs.

Figure 7
Question: Are specific pathways enriched in DMR-associated genes?
Methods: Pathway analysis using KEGG for genes near DMRs.
Results: DMRs were associated with pathways like TGFß/BMP signaling, which is linked to phenotypic traits such as beak morphology.
What is the main question of this paper?
The study aims to determine whether epigenetic variation, specifically DNA methylation, contributes to phenotypic differences between urban and rural populations of Darwin’s finches and to evaluate its potential role in rapid adaptation to new environments.
Main Methods: Morphiological Analysis
Measurements of body and beak traits were taken from finches at rural and urban sites.
Main Methods: Genetic Analysis
Copy Number Variation (CNV) analysis was performed using pooled genomic DNA to assess genetic differences.
Main Methods: Epigenetic Analysis
Differentially Methylated Regions (DMRs) were identified through methylated DNA immunoprecipitation followed by next-generation sequencing.
Key Results: Morphology
Urban populations of Geospiza fortis showed significant morphological differences (larger size) compared to rural populations, whereas G. fuliginosa did not.
Key Results: Genetics
No significant CNV differences were found between urban and rural populations for either species.
Key Results: Epigenetics
Significant DMRs were identified between urban and rural populations in both species and in both cell types (erythrocytes and sperm), suggesting species-specific epigenetic responses.