review for psych ch 1-3
1/59
There's no tags or description
Looks like no tags are added yet.
Name | Mastery | Learn | Test | Matching | Spaced |
|---|
No study sessions yet.
60 Terms
statistics
set of mathematical procedures for organizing, summarizing, and interpreting information
population
set of all the individuals of interest in a particular study
sample
set of individuals selected from a population
variable
characteristic or condition that changes or has different values for different individuals
steps to an experiment
experiment - comparing two studying methods
attain data: test scores for each student in each example
descriptive statistics: organizing and simplifying: average? mode?, it is the procedures used to summarize, organize, and simplify data
inferential : what does this mean? what can we generalize
statistic
value, usually a numerical value, that describes a sample
parameter
value of numbers that describes a population
A characteristic that describes a population— the average score for the population
inferential statistics
techniques that allow us to study samples and then make generalizations about populations
descriptive statistics
it is the procedures used to summarize, organize, and simplify data
sampling error
discrepancy that occurs naturally and exists between a selection statistic and the corresponding population parameter
correlational method
technique wherein two different variables are observed to determine whether they are related
experimental method
technique in which one variable is manipulated while another variable is observed and measured
nonequivalent groups study
research in which collections of participants are formed without the researcher controlling assignment
quasi independent variable
groups of scores that are examined for their influence on a dependent variable
ex. boys vs girls, old vs young
constructs
internal attributes or characteristics that cannot be directly observed
operational definition
explanation describes a construct in terms of how it is measured
discrete variable
scale consisting of separate, indivisible categories
planets around the sun
how many students are in a class
whole, countable numbers—for example, the number of children in a family or the number of students attending class
continuous variable
scale for which there are an infinite number of possible values
height of students in class
amount of stars in the galaxy
weight
can be measured in a continuous line
real limit
boundaries of intervals for scores that are represented on a continuous number line
upper real limit
boundary that separates an interval from the next higher interval
lower real limit
boundary that separates an interval from the next smaller interval
ordinal scale
set of categories that are ranked in terms of size or magnitude
interval scale
ordered categories that are all spaced exactly the same size
data set
is a collection of measurements or observations.
datum
is a single measurement or observation and is commonly called a score or raw score.
what can population refer to ?
it can refer to both people itself, and the population of scores
characteristics
characteristic that describes population: parameter
characteristic that describes sample: as statistic
what is the margin of error
the sampling error
participant variables
These are characteristics such as age, gender, and intelligence that vary from one individual to another
environmental variables
These are characteristics of the environment such as lighting, time of day, and weather conditions
3 basic techniques to control variables
random assignment
matching (equally controlled environments) eg. matching % of ppl under a specific condition
holding them constant, holding gender and age constant so that it doesn’t influence the dependent variable
the independent variable
the variable that is manipulated by the researcher.
usually consists of the two (or more) treatment conditions to which subjects are exposed.
consists of the antecedent conditions that were manipulated prior to observing the dependent variable.
nonexperimental, quasi design
compares preexisting groups, the researcher cannot control the assignment of participants to groups and cannot ensure equivalent groups
in non experimental study design, what is the independent variable also referred to as
the quasi-independent variable.
In a correlational study, how many variables are measured for each individual and how many groups of scores are obtained?
2 variables and 1 group
things to note about continuous variables
very rare to obtain identical measurements for two different individuals. Because a continuous variable has an infinite number of possible values, it should be almost impossible for two people to have exactly the same score
each measurement category is actually an interval that must be defined by boundaries. For example, two people who both claim to weigh 150 pounds are probably not exactly the same weight. However, they are both around 150 pounds. One person may actually weigh 149.6 and the other 150.3
boundaries of intervals for scores that are represented on a continuous number line
real limits: there also exists an upper real limit and a lower real limit
should 150.5 be assigned to the 150 interval or the 151 interval?
either. It is a boundary boundary the two intervals and is not necessarily in one or the other.
placement of 150.5 depends on the rule that you are using for rounding numbers: rounding up, then 150.5 goes in the higher interval
rounding down, then it goes in the lower interval .
what does the term discrete and continuous apply to
the terms continuous and discrete apply to the variables that are being measured and not to the scores that are obtained from the measurement
score
X
N
identifies the number of scores in a population
n
identifies the number of scores in a sample
Descriptive statistics are generally used for
simplifying and summarizing data
doesnt apply only to dependent nor independent variables
real limit precision for precision scale of 0.2
divide 0.2 into 2 → 0.1 so real limit is 0.1 above and below score
real limit precision for precision scale of 0.1
divide 0.1 into 2 → 0.05 so real limit is 0.05 above and below score
frequency distribution
an organized tabulation of disorganized set of scores and places them in order from highest to lowest, grouping together individuals who all have the same score
organizes the number of individuals located in each category on the scale of measurement
goal is to see at a glance
range
distance from the highest score to the lowest score
apparent limits
values of scores that are highest and lowest in an interval
class interval
group of scores in a grouped frequency distribution
histogram
graph showing a bar above each score or interval
grouped frequency distribution
chart wherein scores are collected into intervals rather than as individual values
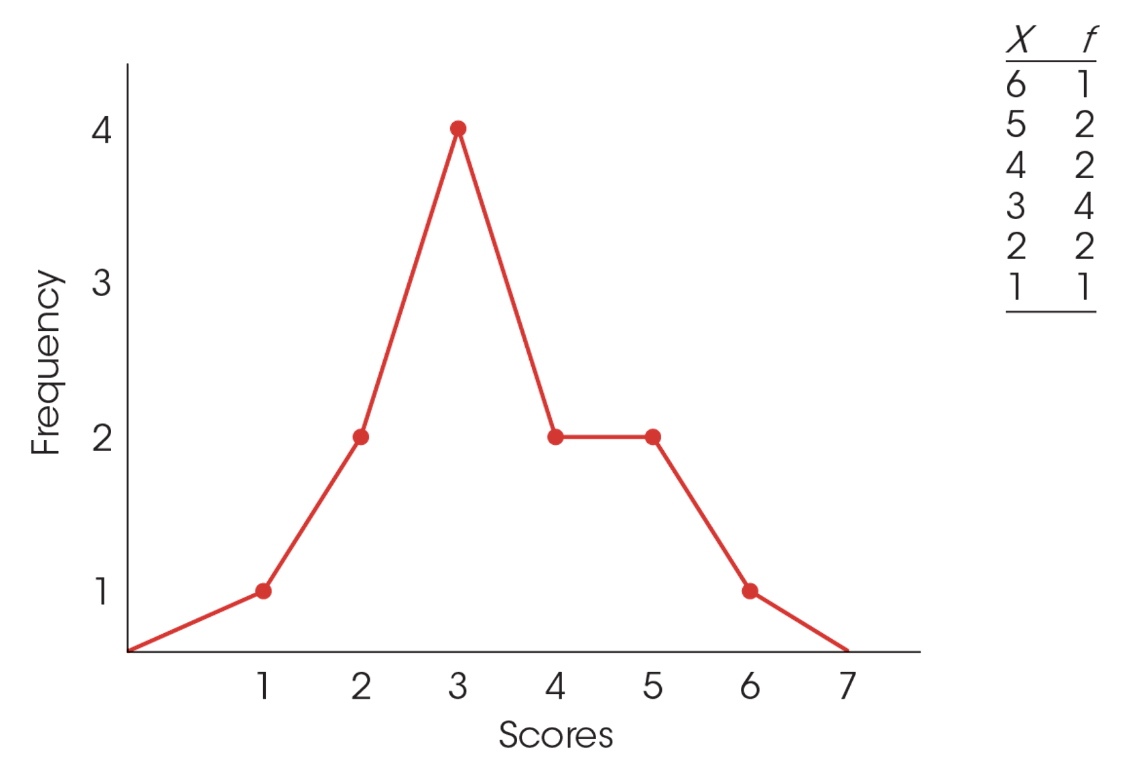
polygon
graph consisting of a line that connects a series of dots
relative frequency
proportion of the total distribution, rather than the total number of times the event occurred
tail
section wherein the scores taper off toward one end of a scale
skewed distribution
occurance of the scores tending to pile up toward one end of a scale
positively skewed: occurance wherein the scores pile up on the left side of a scale
negatively skewed: occurance wherein the scores pile up on the right side of a scale
rank
percentage of individuals in the distribution with scores at or below the particular value
percentile
score that is identified by its relative position in a distribution
repeated measures design
study wherein the scores are all obtained from the same group of participants
mode
most frequent score
weighted mean
average of two averages, handicapped by the number of scores they represent