AP Macro Econ Test #2
1/77
There's no tags or description
Looks like no tags are added yet.
Name | Mastery | Learn | Test | Matching | Spaced |
|---|
No study sessions yet.
78 Terms
GDP
Gross Domestic Product- the total market value of all final goods and services produced annually in an economy
- measures total income of everyone in econ & total expenditure on econs output of goods
Consumption Approach to Calculating GDP
Y = C + I + G + Nₓ
- Y = GDP
- C = Consumption
- I = Investment
- G = Gov Purchases
- Nₓ = Net Exports
Consumption
- spending by households on goods and services, with the exception of purchases of new housing
Investment
- spending on capital equipment, inventories & structures including household purchases of new housing
Gov. Purchases
- spending on goods and services by local, state, and federal governments
Net Exports
- exports - imports
Income Approach to Calculating GDP
GDP = wages + rent + interest + profit
- Interest: interest income & proprietor's income
Value Added Approach to Calculating GDP
- add up the dollar value added at each stage of the production process
Transfer Payments
- payments made by the gov. without any goods or services being exchanged
- ex: welfare, unemployment compensation, subsidies
Factor Payments
- income people receive for supplying factors of production
- wages for labor, rent for land, interest for capital, profits for entrepreneurship
Real GDP
- GDP expressed in constant, or unchanging, prices
- evaluates current prod. using prices fixed at past lvls to show how econ's overall prod of goods has changed
Nominal GDP
- GDP measured in current prices
- prod. of goods & services valued at current prices
GDP Deflator
- measure of the price lvl
- (Nominal GDP / Real GDP) x 100
Inflation
- continuous rise in the price of goods and services
- rise. of price lvl in econ
Calculating Inflation Rate
[(GDP deflator year 2- GDP deflator year 1)/ GDP deflator year 1 ] X 100
Recession
- periods where GDP declines
- large GDP = better life
Intermediate Goods
- goods purchased for further processing/ manufacturing for sale
- not counted towards GDP
Final Good
- a good sold to final users
- taken into account for GDP
Limitations of GDP
- used & intermediate goods don't count
- nonproduction transactions aren't counted (bonds & stocks)
- illegal/non-market transactions excluded
GNP
- Gross National Product - the sum of all goods and services produced WITHIN a nation in a year
- GNP = GDP - net income from abroad
CPI
- consumer price index
- measure of the overall cost of the goods & services bought by a typical consumer
- computed & reported by BLS
CPI Calculation
(price of basket goods & services in current year/price of basket in base year) x 100
PPI
- Producer Price Index
- measure of the cost of basket goods & services bought by firms
Problems Measuring the Cost of Living
- substitution bias, introduction of new goods, unmeasured quality change
GDP Deflator vs CPI
- GDP reflects the prices of all goods and services, but CPI reflects prices of goods and services bought by the typical consumer.
- CPI compares the prices of a fixed basket of goods and services, BLS rarely changes the basket. GDP always changes.
ex: Volvo raises prices. Volvos are made in Sweden, so NOT PART OF GDP, but bought by US consumers, so it's part of CPI
Indirect Business Tax
- raises prices for consumers to make up for the money paid for taxes
Consumption of Fixed Capital/Depreciation of Capital Goods
- value of capital goods decreases as time goes on
NNP
- Net National Product
- GNP - depreciation
NI
- National Income
- [GDP + Nₓ - (indirect business taxes + consumption of fixed capital)]
- estimates of factors of the cost of production
- NNP - I (Indirect business taxes)
PI
- Personal Income
- NI - (corporate income taxes + undistributed corporate profits + social security taxes + transfer payments + interst paid by persons)
- how much $ a household has before taxes
DPI
- Disposable Personal Income
- PI - personal income taxes
- amount of income households have to dispose of as they wish
Personal Outlays
- consumer purchases of durable goods, nondurable goods, and services- consumer expenditures on goods/services + interest paid by persons
Personal Savings
DPI - Personal Outlays
Business Cycle
- fluctuations in economic activity, such as employment and production
- correspond to changes in business
Model of Aggregate Demand & Supply
- model that most economists use to explain short-run fluctuations in economic activity around its long-run trend
Aggregate Demand Curve
- all goods & services that consumers, the gov, & foreign buyers purchase in an econ.
Aggregate Supply Curve
- shows the quantity of goods and services that firms choose to produce and sell at each price level
Natural Rate of Output
- production of goods and services that an economy achieves in the long run when unemployment is at its normal rate
Determinants of Aggregate Supply
- labor force, productivity, expected future price lvl, workers & firms adjusting to incorrest estimation of price, supply shocks, short-run equilibrium
Short Run Aggregate Supply
- the total amount of goods and services that all firms are willing and able to produce within the economy
- econs total output when at least 1 input price (ex: wages) is fixed
Long Run Aggregate Supply
- wages and resource prices will increase as price levels increase
- max sustainable output at full employment, as input prices are fully flexible
- LRAS = PPF
- vertical
Keynesian Economy
- if stimulated, aggregate demand will stimulate the econ & pull a country out of recession
- total demand consumed for all goods & services prod in a yr
Why Demand Curve Slopes Right
1. Wealth Effect: as price lvl inc, society has less $ to spend
2. Interest Rate Effect: ppl will borrow less $ when interest is high
3. Foreign Purchase Effect: if price lvls inc. Americans will buy less US goods & get cheaper foreign goods
Causes of Shifts in AD
- consumers (wealth & expectations), Interest (purchase of capital goods by businesses), G (gov purchases), Nx (net export spending)
Sticky-Wage Theory
- an unexpectedly low price level raises the real wage, which causes firms to hire fewer workers and produce a smaller quantity of goods and services
SRAS to LRAS
Phase 1: lvls of output are less than full employment (recession)
Phase 2: price lvls rise & real GDP inc. (expansionary phase)
Phase 3: GDP remains constant
- unles tech advances, they get more resources, or econ goes into recession, curve won't shift
Hyperinflation
- rapid rise in inflation
- price lvls constantly rise without AD rising to reach that lvl
Stagflation
- slow economic growth and high unemployment
- quick rise in price lvls & dec in real GDP
Stages of Business Cycle
- expansionary stage, peak, recession, trough
Expansionary Stage
- rising unemployment
- SRAS curved (phase 2)
- B

Peak
- max output, full employment, domestic output at max
- price lvl inc but not output (GDP stays same)
- LRAS at peak
- Hyperinflation can occur
- A
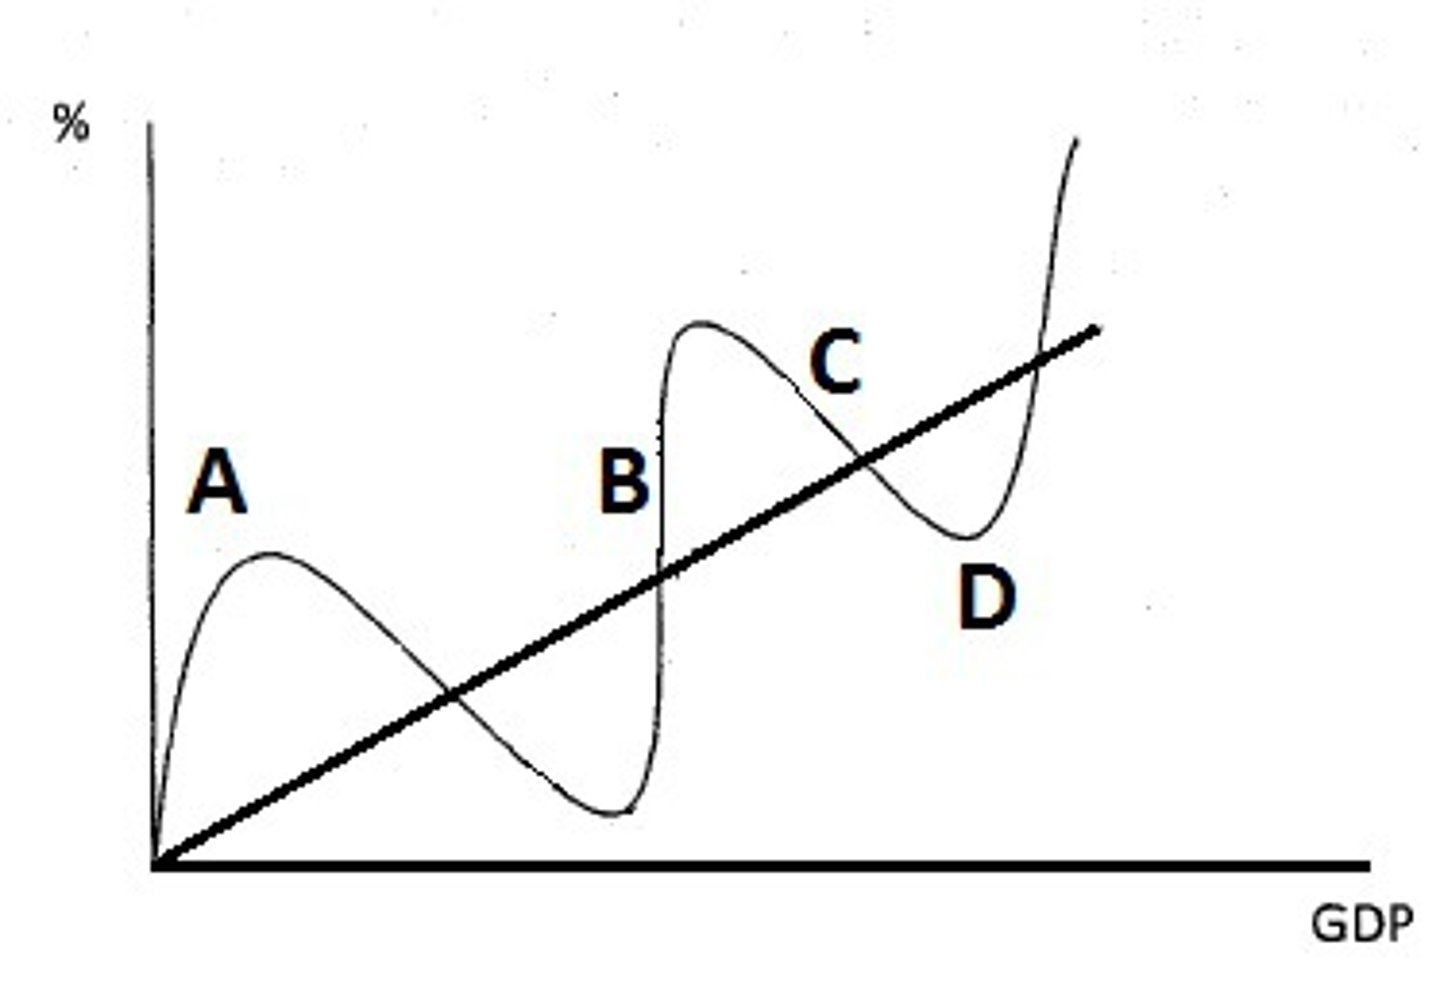
Recession Stage
- decline in total output, income, employment, price lvls, or trade
- lasts 6+ months
- C

Trough
- lowest lvl of output & employment
- D

Business Cycle Causes
1. Tech innovation
2. Political events
Labor Force
- those 16+ who are either employed or actively seeking employment but are currently unemployed, full-time students, homemakers, or otherwise not seeking work
Labor Force Participation Rate
(# of ppl in labor force/working age pop.) x 100
Unemployment Rate
(# of ppl unemployed seeking a job/# of ppl in labor force) x 100
Discouraged Workers
- ppl who would like to work but have given up looking for a job
Types of Unemployment
frictional, structural, cyclical
Frictional Unemployment
- in between jobs
- have skills & available jobs but haven't found a job yet
Structural Unemployment
- no skills & no jobs available bc structure of labor market changed
- some jobs obsolete bc of new tech
- ex: VCR repair
Cyclical Unemployment
- due to recession
- econ is doing poorly so ppl buy less goods
- businesses need less workers & lay of ppl
Seasonal Unemployment
- unemployment linked to seasonal work
Natural Unemployment
- econ will always have some frictional & structural unemployment
Natural Rate of Unemployment
- lvl of unemployment that exists when the econ is at full employment, including frictional & structural unemployment, but not cyclical unemployment
Shortcomings of Calculating Unemployment
- part-time jobs
- discouraged workers
- illegal jobs
Okun's Law
- 1 percent more unemployment results in 2 percent less output
Rate of Inflation
[(GDP Deflator of year x - GDP deflator of base yr)/GDP deflator of base yr] x 100
Rule of 70
- doubling time of inflation
- 70/inflation rate
Types of Inflation
1. Demand Pull
2. Cost Pull
3. Wage Spiral
Demand Pull
- greater demand results in inadequate supply and raised prices
- too many workers & not enough goods being produced
Cost Pull
- demand outpaces supply
output lvls decline, leading to inc unemployment
- not enough consumers to ppl get laid off
Wage Spiral
- higher prices force workers to request higher wages, forcing producers to raise their prices even more and workers to ask for even higher wages in an upward spiral.
Philips Curve
- inverse relationship between inflation and unemployment.
Causes of Phillips Curve
1. inc in prices of factors of production
2. supply shock
Supply Shock
- event that shifts the short-run aggregate supply curve
- a sudden shortage of a good
Effects of Inflation
1. Income Redistribution
2. Savers have less money over time
3. Debtors & creditors: value of debt inc as inflation inc
4. COLA (cost of living adjustment)
Deflation
- decrease in the general level of prices bc not enough goods being made