Correlated Designs
 Call Kai
 Learn
Learn Practice Test
 Spaced Repetition
 Match
Match Flashcards
 Knowt Play
1/16

There's no tags or description
Looks like no tags are added yet.
Name | Mastery | Learn | Test | Matching | Spaced | Call with Kai | Chat |
|---|
No analytics yet
Send a link to your students to track their progress
17 Terms
Independent Data
Each participant contributes one score only. Participants are independent of each other.
Example
Group A = caffeine
Group B = placebo
Different people in each group
There is no relationship between scores in the two groups.
Dependent Data
The same participants are measured multiple times.
Examples:
Before vs. after treatment
Same person measured using two devices
Even though scores are dependent, participants themselves must be independent.
Husband-wife studies
Each couple is independent from other couples.
The husband and wife within a couple are not independent
Why are Dependent Designs More Powerful
People naturally differ from one another. We compare differences within each participant instead of comparing separate groups.
Dependent Design Advantages and Disadvantages
Pros | Cons |
|
If one participant drops out:
|
Dependent designs are more powerful because they reduce variability caused by individual differences.
Signal vs. Noise
Signal - actual treatment effect
Noise - random variation
For Dependent designs:
Same signal
Less noise
This Results:
Larger t-value = stronger evidence against the null hypothesis
Greater statistical power = more likely to detect a real effect if one exists.
Narrower confidence intervals = your estimate is more precise
Controlling Carryover Effects
Instead of everyone doing the conditions in the same order, change the order for different participants.
Half: Condition A -> Condition B
Other Half: Condition B -> Condition A
Also randomize the item order - Mix trials randomly so order does not bias results
Paired t-Test
The test compares the difference within each pair, not between different people.
Calculating the difference means: One participant's second score − their first score.
Each participant has two scores because they are measured twice
Paired t-Test Assumptions
Participants are independent
Difference scores are approximately normally
No extreme outliers in the difference scores
Paired t-tests compare the average difference score to 0.
Randomization Test for Paired t-test
Use a randomization test if the assumptions of the paired t-test are violated.
Calculate each participant's difference score.
Assume H₀ is true (no treatment effect).
Randomly flip each difference score (+ or −).
Calculate a new t-value.
Repeat thousands of times.
Create a distribution of t-values.
Compare your observed t-value to the distribution to get the p-value.
Key difference from an independent randomization t-test:
Independent t-test: Shuffle participants between groups.
Paired t-test: Keep each participant's pair together and flip the sign (+/−) of their difference score.
One-Way Repeated Measures ANOVA
Use when the same participants are measured 3 or more times. It's like a paired t-test, but instead of 2 measurements, there are 3 or more.
Independent Variable (Factor)
One independent variable.
Has 3 or more levels
Time (Before, After, Follow-up)
Conditions (A, B, C)
Dependent Variable
One continuous (interval or ratio) variable.
Measured on the same participants (reaction time, heart rate, etc.)
Four Sources of Variance
Repeated Measures ANOVA separates variability into four parts and wants to figure out where all the variation in the data comes from.
SS = Sum of Square = Square each difference (to make them all positive) and added together
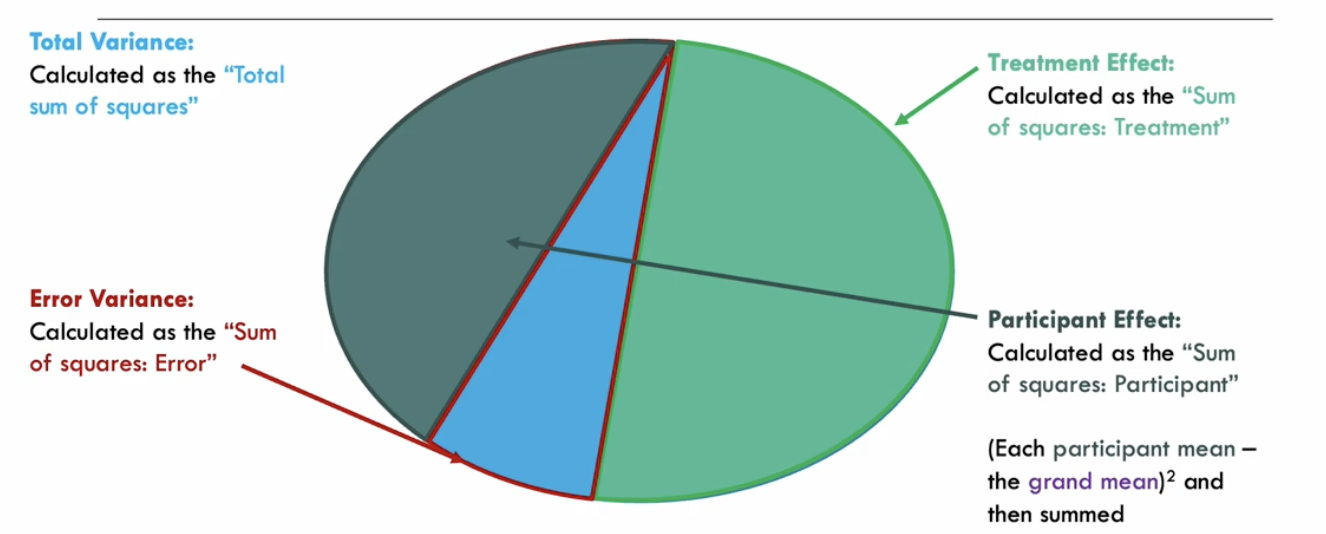
Total Variance (SS Total)
All the differences in the data.
Example: Everyone has different reaction times across all three caffeine conditions.
Treatment Variance (SS Treatment)
Variation caused by the treatment or condition.
Example: Did caffeine change reaction time?
Participant Variance (SS Participants)
Variation because people are naturally different.
Example:
Some people are naturally faster than others.
Repeated measures removes this variability from the error, making the test more powerful.
Error Variance (SS Error)
Variation that cannot be explained by the treatment or participant differences.
This is random error or unexplained variability.
Sphericity
The variance of the difference scores should be about the same for all pairs of conditions (correlation between pairs of groups is the same).