APES Chapters 1-10
1/435
There's no tags or description
Looks like no tags are added yet.
Name | Mastery | Learn | Test | Matching | Spaced |
|---|
No study sessions yet.
436 Terms
Ogallala Aquifer
Big aquifer being drainer faster than replenished.
Saltwater Intrusion
When the pumping of freshwater out of a well is faster than recharge. Near Coastel areas this can cause salt water to infiltrate the aquifer.
Unconfined Aquifers
More prone to change, experience higher rates of pollution
Surface Water
Streams, rivers, ponds, lakes, and wetlands.
Floodplains
River overflows, flooding surrounding land, depositing nutrients and enriching soils (by year).
Lakes
Can be freshwater or saltwater.
-Form in depression where precipitation collects
-Can arise from techtonic activity
Ex. Caspian Sea
-Was part of the ocean, became isolated when the surrounding area rose up
-Higher salt concentration
Flooding and Drought
Drought leads to erosion
-Soil becomes dry and lighter
-Loss of plant life to anchor soil down
-Human Influence (Dust Bowl) poor farmin technique
-Flooding augmented by impermeable surfaces like pavement.
Olgiotrophic Productivity
Low amounts of nutrients such as Phosporous and Nitrogen.
Mesotrophic Productivity
Moderate level of productivity
Eutrophic Productivity
High levels of productivity (lots of algae deadly for fish.)
Levees
An enlarged bank built up on each side of the river
Ex. Mississippi River
Dikes
Similar to a levee built to prevent ocean waters from flooding. Pumps can be used to remove water that bypasses.
Ex. Denmark the past 2,000 years
Levee Effects
- Reduce flood plan fertility and encourage development
- Sediments carried to river mouth
- Redirect floodwater elsewhere
Dams
A barrier that runs across a river or stream to control flow of water.
Reservoir
Area where water is stored behind dam.
Ex. Hoover Dam/Lake Mead, 3 Gorges Dam in China
Dam Effects
Interrupts fish migration so fish ladders were created
Fish Ladders
A set of stairs with water flowing over them that have been added to same dams to help migrating fish.
Ex. Salmon up stream
Aqueducts
Canals and ditches that move waters from one location to another.
- Can fragment landscapes
- Loss of water throught leakage and evaporation
Desalination
Removing salt from salt water
Ex. Distillation or Reverse Osmosis
Water Availability Per Capita
Amount of water available per person varies around the world. North America and Middle East are regions with the lowest amounts of fresh water. These countries represent around 5% of world population, but only have less than 1% of fresh water availability.
Water Footprint
Total daily per capita use of freshwater.
- 3x larger in US than Kenya
- U.S, China, Pakistan, and India account for less than 50% of irrigated lands globally around 43% of population.
Agriculture
The largest user of water around the world.
Furrow Irrigation
Trench flodded with water 65% efficient
Flood Irrigation
Entire field flooded with water 70-80% efficient
Spray Irrigation
Apparatus sprays water across field. 75-95% efficient
Drip Irrigation
Slow dripping hose laid on or beneath soil and controls weed population.
Irrigation
Supply of water to land or crops to help growth. Greatest consumer of freshwater globally. Expand supply of arable land.
Hydroponics
Cultivation under greenhouse conditions.
- Less pesticides
- Grows all year
Roots planted in a nutrient-rich solution, no soil
Water recycled 95% less water than irrigation methods.
More expensive but better results
Industry
2nd largest user of water worldwide
- 50% of water used in US is to generate electricity
- Metal refinement and paper production
Household Use
Accoutns for 10% of US water consumption.
Indoor Use
Drinking water represents only a small portion
- Many people (1 billion) lacks access to clean water
Water Ownership
People can have rights to water use but they don’t own water.
- Right to use vs. ownership
India/Bangladesh River Diversion
Open water market in Chile
Water Conservation
Using techniques such as more efficient water fixtures, faucetsm and washing machines.
- Lower water flush toilets, front loading washer, collect rainwater, wastewater (grey water) for irrigation.
Which of the following factors would most likely contribute to the oxygen conditions observed in the Long Island Sound?
Restricted Circulation
Based on the image, which of the following conclusions can best be drawn to describe the conditions in the Long Island Sound?
The sound has large numbers of phytoplankton blooms that are decomposing and consumed by respiring bacteria.
Which of the following is an expected consequence of runoff and sewage in an aquatic environment?
Decreased oxygen production by seaweed on the seafloor from an increase in turbidity
Turbidity
The quality of being cloudy, opaque, or thick with suspended matter.
Which of the following irrigation methods is most likely to result in salinization of the soil, especially if the agricultural fields are located in a warm climate with consistent sunlight?
Furrow Irrigation
Demography
The study of human population and population trends.
Factors that drive human population growth
( Changes in population size, fertility, life expectancy, age structure, migration)
Immigration
Movement of people into a country.
Emigration
Movement of people out of a country.
Crude Birth Rate (CBR)
Number of births per 1,000 individuals per year.
Crude Death Rate (CDR)
Number of deaths per 1,000 individuals per year
Doubling Time
70/Growth Rate
Ex. Some population doubling
Thomas Malhus Theory
Human population is increasing exponentially, food is increasing linearly, will eventually reach carrying capacity.
Calculating Global Growth Rate
-CBR= 20 births per 1000
-CDR= 8 deaths per 1000
Growth Rate=CBR-CDR= 20/1000-8/1000 =1.2%
(CBR-CDR)/10
Growth Rate of Single Nation
(CBR+ Immigration)-(CDR+ Emigration)/10`
Total Fertility Rate
Est. of an average number of children that each woman in a population will bear.
Replacement Level Fertility
Total fertility rate required to offset average number of deaths in a population fo current population size to be stable.
Developed Countries
Countries with relatively high levels of industrialization and income.
Developing Countries
Countries with low levels of industrialization and income of less than $3 per person per day.
Life Expectancy
Average number of years that an infant born in a particular year in a county can be expected to live, given current average life span and death rate of that country.
Infant Mortality Rate
Number of deaths of children under age 5 per 1000 live births.
Devloped nations have high IMR (Liberia and Bolivia)
Can vary by socioeconomic status (Ex. African Americans vs. Caucasions)
Population Momentum
Continued population growth reduction measures have been implementd.
Ex. War causing boomers to have kids and then their kids have kids.
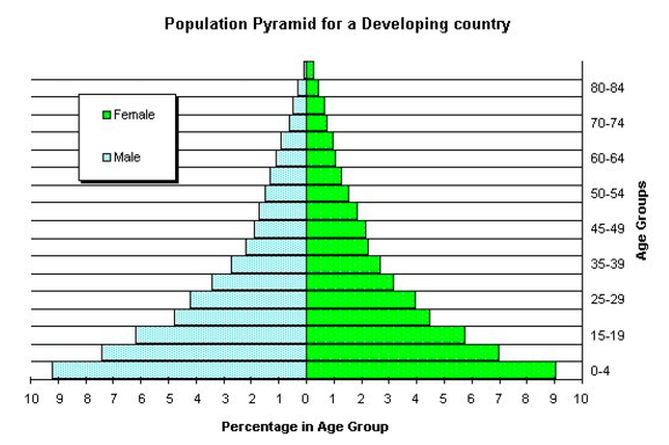
Population Pyramid
Developing Nations
Higher total fertility rates
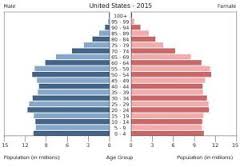
Population Pyramid
Slow Growth
Even distribution of ages
little difference between number of individuals in each group
Slow or zero growth
Higher education and health care
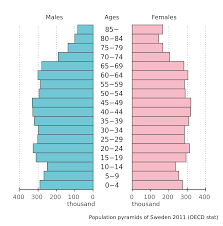
Population Pyramid
Zero Growth or Disease
Inverted Pyramid
Majority of Population past reproductive age
Decrease in population size
Net Migration Rate
Difference between immigration and emigration in a given year per 1000 people in a country.
Theory of demographic transition
As a country moves from a subsistence economy to industrialization and increased affluence it undergoes a predictable shift in population growth.
Affluence
Having stuff
Ex. shoes or health care
Theory of demographic transition Phase 1
Exsisting (high birth rate and high death rate) slow population growth.
Theory of demographic transition Phase 2
Rapid population growth because birth rates remain high but death rates decline due to better snitation, clean drinking waterm increaseed access to food and goods and access to health care.
Theory of demographic transition Phase 4
Choose to have fewer kids population level out. Affluence developes encourages women to delay having kids.
Theory of demographic transition Phase 3
Stable population growth as an economy and education system improves people have fewer kids.
Family Planning
The regulation of the number of or the spacing of offspring through use to to Birth Control.
Studies show education of mothers bring down the average number of births per women.
Ex. Ethiopian women with secondary schooling have a lower total fertility rate compared to a higher fertility rate among uneducated women.
IPAT
Impact= Population x Affluence x Technology
Greater population size= higher enviromental impact
Greater affluence= greater enviromental impact
Technology can degrade the enviroment and provide solutions to protect it. Mostly focuses on destructive technology.
In Urban Areas
½ of the world lives in urban areas but consumes ¾ of the worlds resources.
Gross Domestic Product (GDP)
Measured value of all products and services produced in one country per year.
Four parts: Consumer spending, Investments, Government spending and exports, Imports
Per Capita GDP correlates positively with pollution. Can reach a point where they can regulate pollution.
Increasing GDP could be a solution to environmental damage: greater affluence= a lower birth rate and wealthier nations can afford to protect the environment.
Global and Local Impact
Developing nations typically use land and forest resources. Expanding populations and therefore more land is used for farming and forests and cut down.
Ex. Brazil cutting down tress for farming, but farming sucks in Brazil.
Developed nations use fewer local resources than developing nations and have greater global impacts and greater environmental cost because of more importation.
Sustainability
the need for enviromental change.
Demographic Transition
Transition of a country from undeveloped or developing to a developed country as birth and death rates decrease.
When the fertility goes from 5.9 to 2.3 what has most likely occurred?
Women had increased education opportunities and had children later on.
Replacement level fertility
The total fertility rate exactly replaces previous population.
Lower Deaths=
Acheivement of replacement level fertility.
Population Size
Total number of individuals per unit area at a given time.
Population Density
Number of individuals per unit area at a given time.
Population Distribution
How individuals are distributed with respect to one another. (Random Distribution, Uniform Distribution, and Clumped Distribution.)
Population Sex Ratio
Male to Female
Population Age Structure
How many individuals fit into a particular age categories.
Density Dependant Factors
The size of population will influence on individuals probabliity of survival. Usually resource driven factors like food supply and space.
Limiting Resources
A resource that a population cannot live without and that occurs in a quantity lower than population would require to increase in size.
Carrying Capacity (K)
Limit of how many individuals in a population the environment can sustain. Horizontal line on a population graph. If food becomes scarce the population will experience an overshoot by becoming larger than the spring carrying capacity and will result in a die-off or population crash.
Density Independant Factors
The size of population has no effect on the individuals probability of survival (Ex. natural disasters like wildfires) enviromental factors have no bearing on density of individuals.
Population Growth Models
A mathematical equation that can be used to predict population size at a given time.
Population Growth Rate
Number of offspring an individual can produce in a time period minus the deaths of an individual or its offspring during the same period.
Intrinsic Growth Rate
Maximum potential growth under ideal conditions with unlimited resources.
Exponential Growth
J Shaped Curve- Exponential Growth Model creates J like graph.
Nt=Noert
Logistic Growth Curve
When population whose growth is initially exponential but slows as the population approches the carrying capacity.
K Selected Species
Population of a species that grows slowly until it reaches carrying capacity (Ex. Elephants, Whales, and Humans) K=kangaroos
R Selected Species
Population of a species that grows quickly and is often followed by overshoots and die-offs (Ex. Mosquitoes and Dandelions) R=Rodents
Herbivory
Animals preying on plants
Mutualism
A type of interspecific interaction where both species benefit.
Commensalism
A type of relationship in which one species benefits but the other is neither harmed nor helped.
Keystone Species
A species that plays a role in the community that is far more important than its relative abundance might suggest.
Ecological Succession
The predictable replacement of one group of species by another group of species over time.
Primary Ecological Succession
Can start from sand. Occurs on a surface that is devoid of soil. Ex. Lichen and Moss (Pioneer Species)
Secondary Ecological Succession
Can start where soil is already present due to a forest fire or abandoned land. Plant life that occurs in areas that have been disturbed but have not lost their soil.
Pioneer Species
A species that can colonize new areas rapidly and grow well in full sunlight.
Climax Stage
Late sucession stage of a forest dominated by shade tolerant species. Can be reset at any time by an evennt that opens the canopy.
Aquatic Succession
Coastal areas are constantly being reshaped by storms. Lakes can fill over time.