Ch 7 Migration, Drift, Non-Random mating
1/37
There's no tags or description
Looks like no tags are added yet.
Name | Mastery | Learn | Test | Matching | Spaced |
|---|
No study sessions yet.
38 Terms
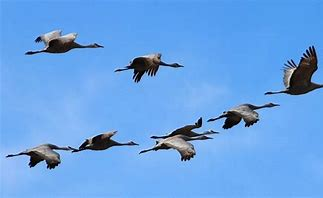
Migration
The movement of alleles among populations
influences gene flow: transfer of alleles from one gene pool to the next

immigration
movement INTO a popuation
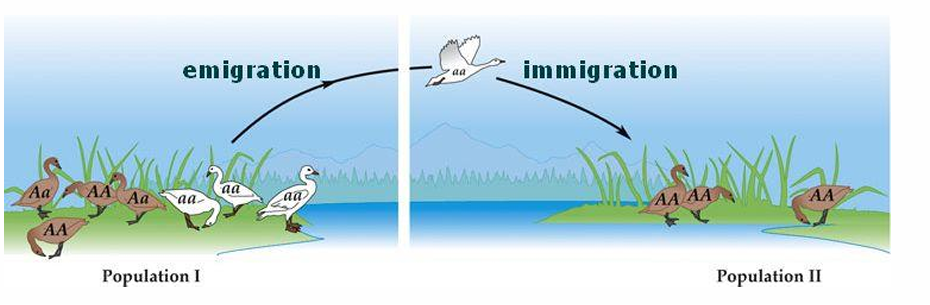
Emigration
movement OUT OF a population
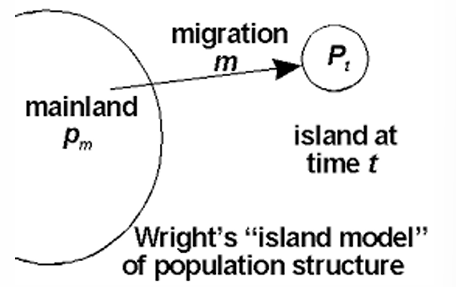
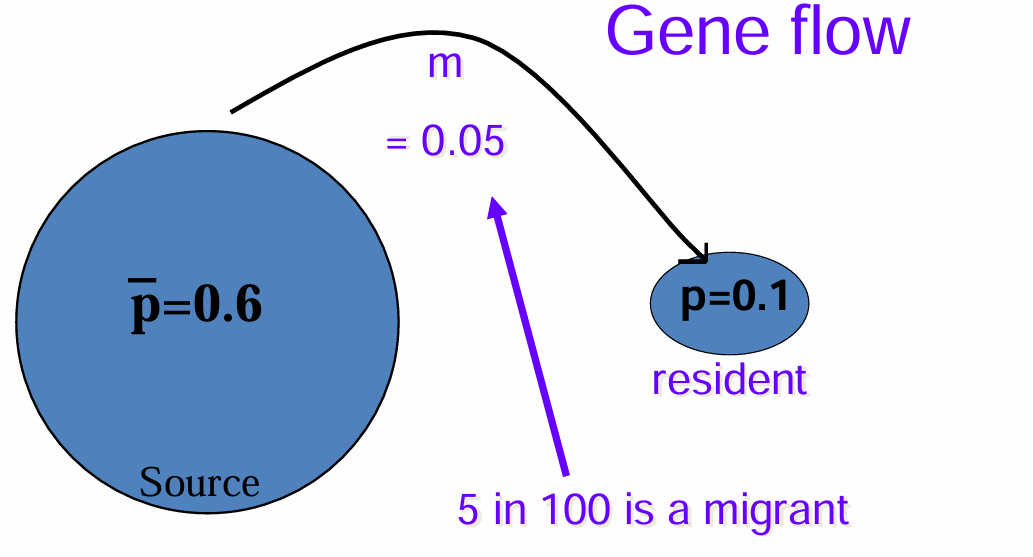
Wright’s One-island model

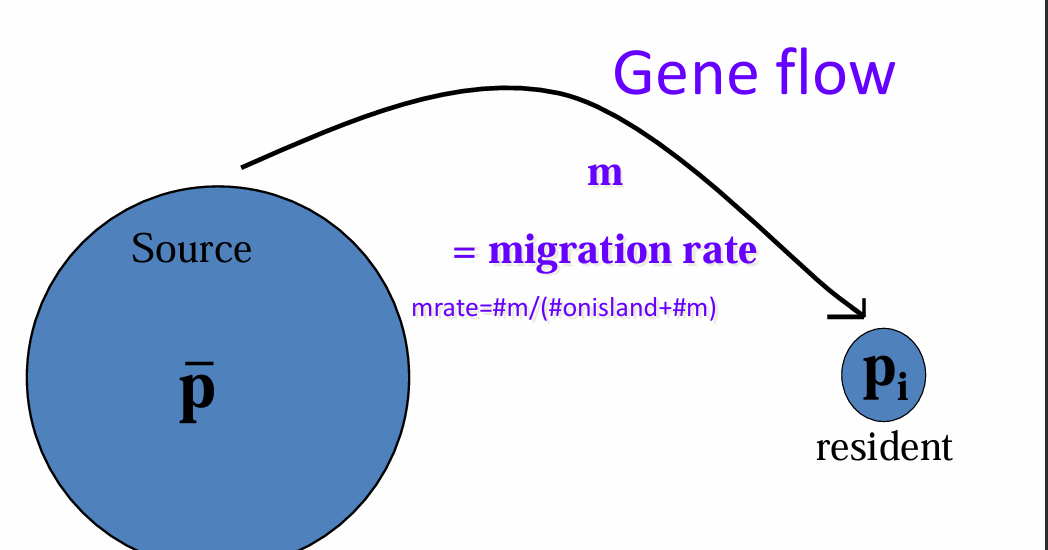
pi = resident
m = rate of gene flow
p = average allele frequency of A1 in source population
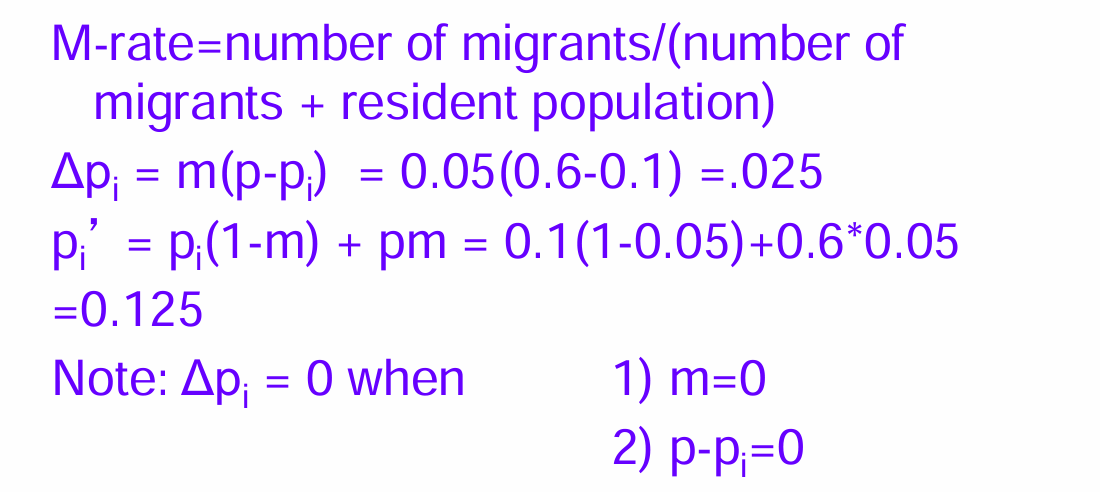
p= m (p-pi)
(1-m) = proportion of gene copies from non-immigrants
pi = frequency
p’ = allele frequency of after 1 generation of population
Example
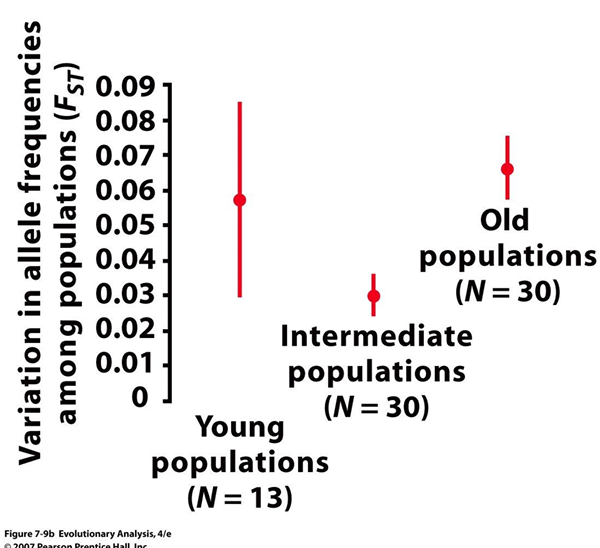
Test Statistic FST
Reflects variation in allele frequencies among populations of the group
ranges from 0 to 1
The larger the range, the more variation in allele frequencies
FIS = the proportion of the variance in the subpopulation contained in an individual
What happens if the assumption of large population size is broken?
evolution can happen by random chance. IT is not adaptive, but does lead to changes in allele frequencies
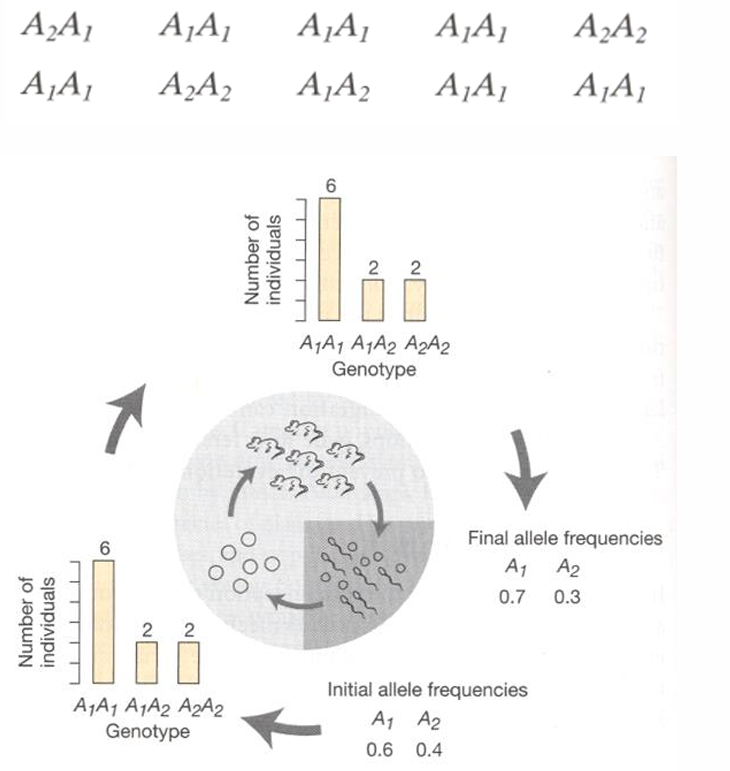
Small population with locus A w/ alleles A1 and A2
A1=0.6 ; A2=0.4
Random mating in gene pool produces 10 zygotes
Due to the small #, by changes, alleles will not unite in the same frequencies
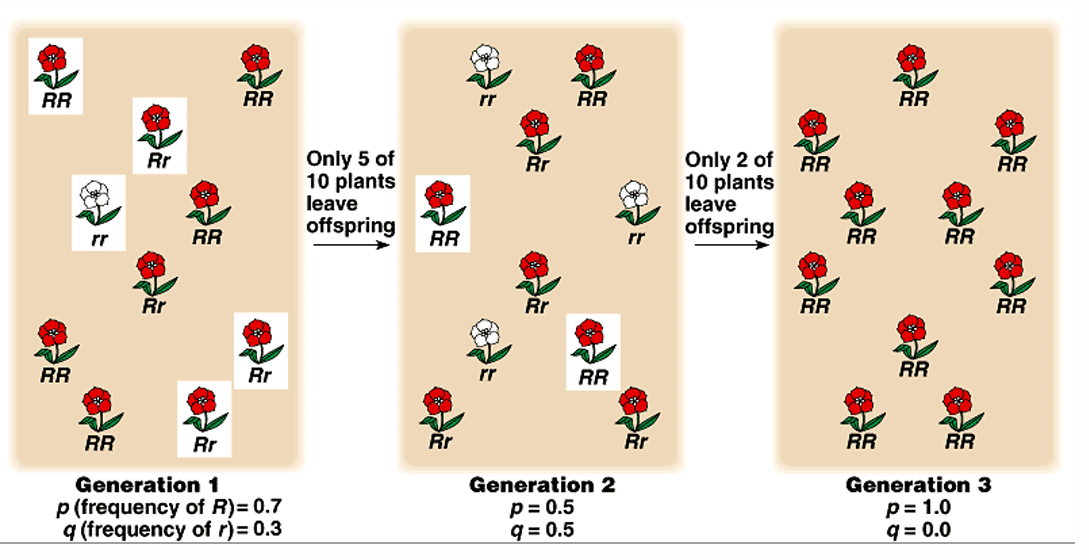
Because of genetic drift, one allele can rise to fixation over time
The smaller the population, the faster the rate of fixation
The larger the population, the more likely It will conform to Hardy-Weinberg
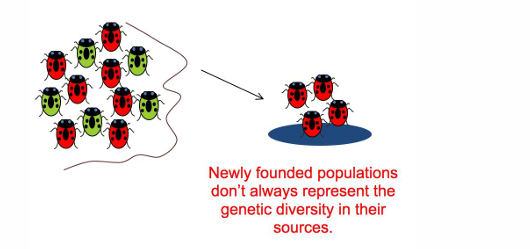
Founder effect
A small group of individuals that starts a new population in a new location
can result in sampling error
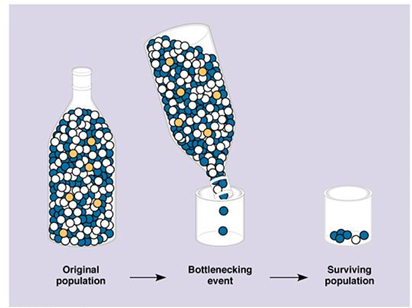
Genetic Bottleneck
(Similar to founder effect)
Random events cause a population to crash into a very low level
a sudden decrease in population size because of extreme natural forces
Loss of heterozygosity
Can decline because of drift
Genetic drift can produce substantial changes in allele frequencies
in terms of migration or selection, the effects of genetic drift can be lessened
What did Sewall Wright demonstrate?
that the probability of fixation for a particular allele is = to the original frequency
if the initial frequency of an allele is 0.8, there is 80% it will drift to fixation
Haplotype
(Think of haploid (1N ) cell)
a group of genes within an organism that is inherited together from a single parent
Young’s study of plants
used literature data
Plotted 2 measures of overall genetic diversity against population size in 4 plant species
Genetic polymorphism
fraction of loci that have at least 2 alleles with frequencies above 0.01
Alellic richness
avg. number of alleles per locus
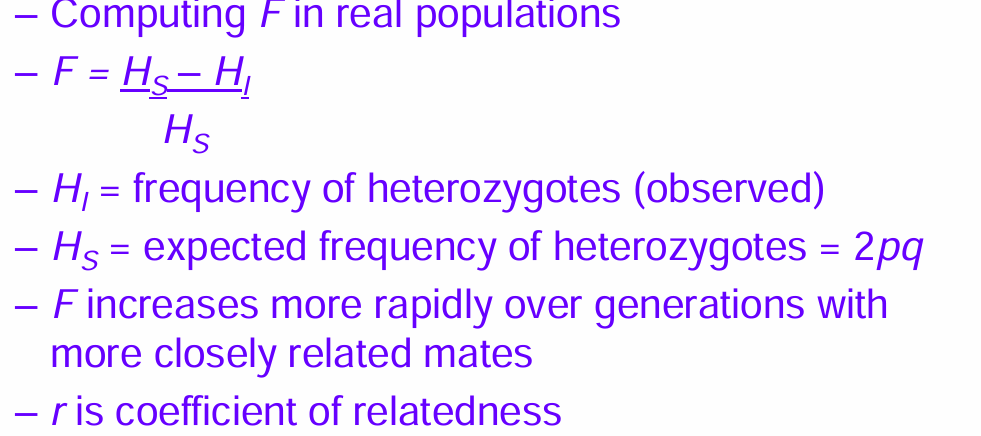
F-statistics : FIS = (Hs-HI)/Hs
HI = Ho = Observed heterozygosity in a population — count # of heterozygotes
Hs = HE = Expected heterozygosity in a population based on HWE — Hs = 2[f(A)][f(a)]
![<ul><li><p>H<sub>I</sub> = H<sub>o</sub> = Observed heterozygosity in a population — count # of heterozygotes</p></li><li><p>H<sub>s</sub> = H<sub>E</sub> = Expected heterozygosity in a population based on HWE — H<sub>s</sub> = 2[f(A)][f(a)]</p></li></ul><p></p>](https://knowt-user-attachments.s3.amazonaws.com/c350a0d9-0bb6-43e5-8c83-932dcbf0dff2.png)
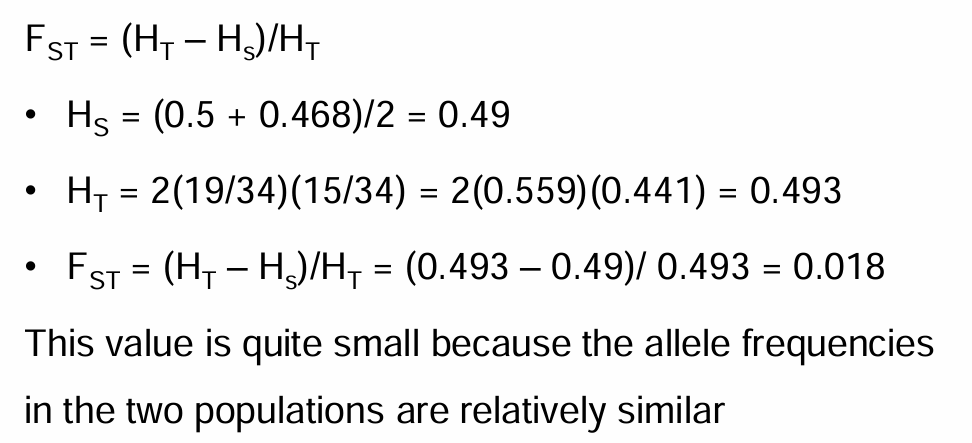
FST = (HT-HS)/HT
Hs = avg. Hs among all populations
HT = Total expected heterozygosity among all populations
FST = the level of differentiation among a set of populations
Effective population size
The size of an idealized population that would lose genetic diversity at the same rate as the actual population
Ne= measure of a population’s genetic behavior
How does effective size differ from census size?
Any characteristic of a real population that deviates from the characteristics of an ideal population
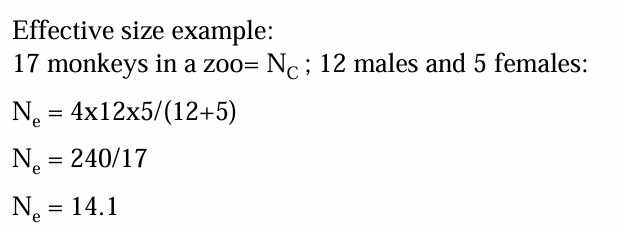
Demographic Method A) Unequal sex-ratio — inbreeding effective size
Ne=4NefNem/(Nef+Nem)
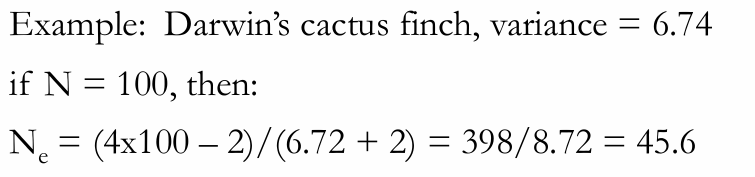
Demographic Method B) Variation in family size
Ne = (4N-2) / (Vk +2)
Vk =variance in family size
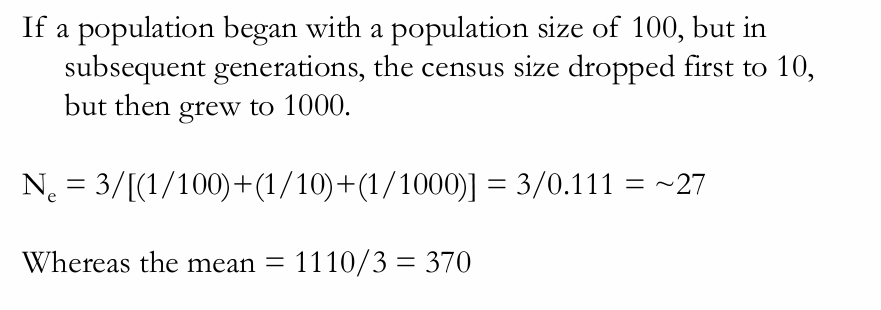
Demographic Method C) Fluctuations in population size
Ne = t/E(1/Nei)
Nei= effective size in the ith generation
t = number of generations
Neutral theory vs. Selectionist theory
Neutral theory
rate of evolution = neutral mutation rate
advantageous mutations are very rare, and most mutations are selectively neutral
Selectionist theory
advantageous mutations are more common
rate of substitution is determined by natural selection on advantageous mutations
Nearly neutral theory of molecular evolution
s is less than or equal to 1/ 2(Ne)
s= selection coefficient
Ne= effective population size
Neutral theory as null hypothesis
Positive selection promoting replacement substitution
MHC proteins
immunoglobulins
plant S-alleles
Loci under positive selection
recently duplicated genes that have attained new functions
loci involved in sex determination
species-specific interactions between sperm and egg
Hitchhiking (selective swap)
can lead to increase in frequency of neutral or even deleterious genes
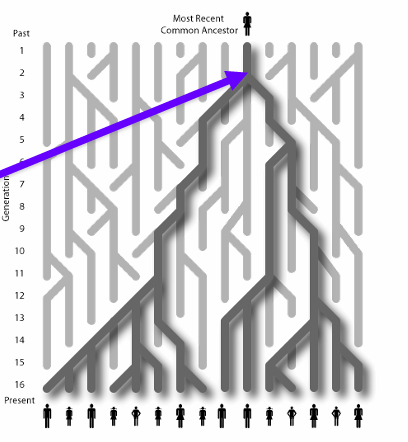
Coalescence
a method that allows the calculation fo effective population size in previous generations
What happens if the assumption about non-random mating is broken?
Nonrandom mating does not cause evolution by itself because it can have great indirect effects on evolution. Mate choices cause nonrandom mating = assortative mating
(ex. females choose males with particular phenotypes)
Positive assortative mating
individuals choose mates similar to themselves
“omg you’re just like me!!”
increases homozygosity and decrease in heterozygosity at all loci
Negative assortative mating
individuals choose mates different from themselves
“you’re into rock and im into pop!! Love that~!”
increases heterozygosity
What is the most common type of nonrandom mating?
inbreeding (dating relatives)
self-fertilization
increases in homozygosity at all loci regardless of what allele frequencies were
Coefficient of Inbreeding, F
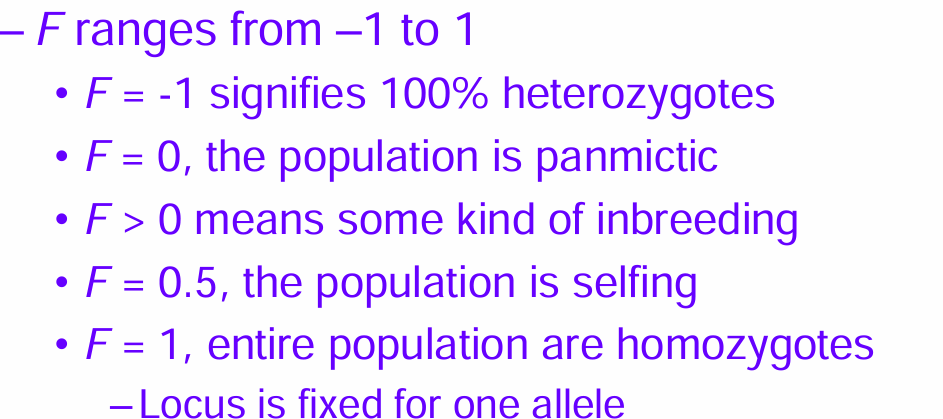
Computing F in real populations
Inbreeding Depression
exposure of deleterious alleles as homozygotes
loss of function mutations are hidden as heterozygotes
increases the frequency at which deleterious alleles affect phenotypes
Can have higher mortality rates because there is a 50% likelihood of a rare disease within inbreeding that are more likely to be expressed for newer generations