Evidence based nursing "exam" 2
1/32
There's no tags or description
Looks like no tags are added yet.
Name | Mastery | Learn | Test | Matching | Spaced |
|---|
No study sessions yet.
33 Terms
Systematic reviews (SR)
Best level 1 evidence. Advantages include larger sample size, more data makes statistical analysis more robust, synthesize findings from multiple small studies. You can write without own data so no IRB approval or funding needed.
Clinical practice guidelines (CPG)
Systematically developed statements to assist practitioners in making health care decisions in specific clinical circumstances. This is created by multidisciplinary panel of experts. Includes systematic reviews, meta-analyses, and individual studies. Appraise literature includes determining level of evidence, quality, and consensus of group experts.
Role of SR in EBN
Provide high quality, synthesized evidence to support clinical decisions.
Role of CPG in EBN
Translate SR findings into practical recommendations for healthcare providers. It is meant to optimize patient care.
Differences vs benefits of SR and CPG
SR: analyze multiple studies, use strict inclusion and exclusion criteria, ensures strong unbiased evidence.
CPG: provides recommendations, combines evidence and expert opinion, helps standardize care.
Evaluate quality systemic reviews
Look for transparency in methodology (PRISMA flowchart), check for bias, peer review, and comprehensive search strategies.
Sampling
Choosing a small group to represent a larger population, helping make conclusions without studying everyone. Homogenous are participants as similar as possible. Heterogenous are participants diverse or different from each other. Sample error is inevitable, it is difference between the population mean and sample mean.
Population vs Sample
Population is a particular group of individuals or elements who are the focus of research. Sample is a group of participants enrolled in the study.
Probability sampling
Random, reduces bias, each person or unit has a chance to be in the sample, may be costly.
Non-probability sampling
Not random, not every person or unit has the opportunity to be selected for a study sample, easier to conduct, may introduce bias.
Simple random sampling (probability)
The most basic of probability sampling plans. Assign numbers and randomly select numbers until desired sample size is achieved. Everyone has an equal chance.
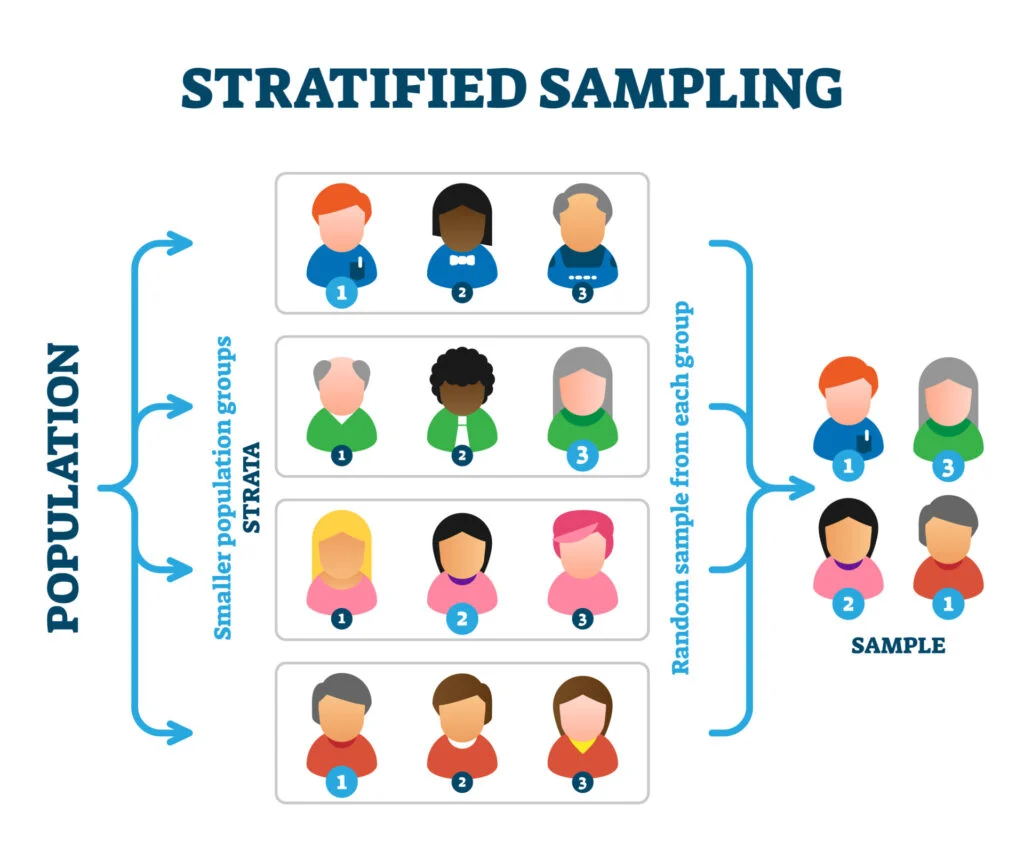
Stratified random sampling (probability)
Researchers know some variables in the population that is critical for achieving representation. Population divided into subgroups and random samples are taken.
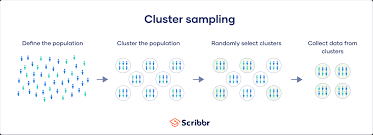
Cluster sampling (probability)
Researchers may develop a sampling framework that includes a list of states, cities, or institutions that can be used in the study. Groups are randomly selected over individuals.
Key eligibility criteria for research participation
Inclusion criteria is characteristics that the subject or element must possess to be part of target population. Exclusion criteria is characteristics that can cause person or element to be excluded from the target population.
Generalization
Extending the findings from the sample under the study to the larger population. This is influenced by quality of the study and eligibility criteria.
Mean → central tendency
Typical score or average.
Median → central tendency
The middle score in ordered set.
Mode → central tendency
Most frequently occurring value.
Standard deviation → variability
Typical deviation from the mean, measures variability or spread of data. Low SD means cluster, high SD means data points are far apart.
Categorical data
Reports counts and percentages together and clearly. Ex: 20% (n=40) of participants were female.
Descriptive vs inferential statistics
Descriptive is summarizing data (mean. median, mode). Inferential testing is evaluating consistency of descriptives against known models of chance, like t-tests and ANOVA.
P-value
p < 0.05 or 5% suggest statistically significant results, meaning the observed effect is unlikely due to chance, groups started out different. We want low p for intervention, high p for our article.
Confidence intervals
Another way to look at p-values, typically set to 95%, if study was repeated the parameter should fall within range.
Null hypothesis
Look for key words like “aims”, “goals”, “purpose”. Assumes no effect/difference.
T-distribution
Unimodal and symmetric, null hypothesis is 0, increasingly distinct means the outcomes are inconsistent with our model of chance. Number should be less than 5% chance that differences are an accident.
F-distribution
Used in ANOVA to compare multiple group means.
Cohens D
Measures the standardized difference between two means.
Eta squared
Measures variance explained in ANOVA.
Correlations
Measures strength and direction of a relationship.
Odds ratio
Likelihood of an event occurring in one group vs another.
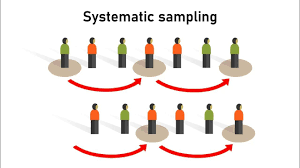
systemic sampling (probability)
the process includes selecting every ?th individual on the list, using a random starting point and pattern.
Non-probability sampling includes
Purposive: efforts made to include typical and atypical subjects.
Snowball: takes advantage of social networks to get the sample.
Connivence: recruit participants that are most conveniently available, inexpensive, accessible, less time.
Quota: like ^, adds strategy to ensure inclusion of participants that are likely underrepresented.
Type 1 vs 2
Type 1 error: false positive, rejecting a true null hypothesis, you think there is an effect when there isn't.
Type 2 error: false negative, failing to reject a false null hypothesis, depends on sample size, you think there is no effect when there is.