Inequality and Poverty
1/12
There's no tags or description
Looks like no tags are added yet.
Name | Mastery | Learn | Test | Matching | Spaced |
|---|
No study sessions yet.
13 Terms
Inequality and Poverty
Inequality: Primarily refers to the uneven or unequal distribution of economic variables like income and wealth among individuals or groups within a society or between countries.
small segment of the population holds a large proportion of the total income and/or wealth, while a much larger segment holds very little.
Poverty: a state where individuals or communities lack the financial resources and essentials for a minimum standard of living
Equality and Equity
Equality: the state of being the same in quantity, measure, value, or status. Often refers to an equal distribution of income or wealth, where each person or household receives the same amount.
Equity: Refers to fairness, impartiality, or justice. Relates to the perceived fairness of the distribution of income, wealth, or opportunities. What is considered 'fair' can vary significantly based on societal values and individual beliefs.
Economic Inequality
Income
● A broad concept referring to the unequal conditions people face in satisfying their economic needs, largely due to differences in monetary factors.
● While influenced by factors like access to education, healthcare, and nutrition, economic inequality analysis often focuses specifically on the distribution of income and wealth.
Income:
● Type: A flow concept – measured over a period of time (e.g., per week, month, year).
● Definition: Represents the earnings or receipts of money by factors of production or individuals/households.
● Sources Include:
○ Wages and salaries (from labor)
○ Rent (from land/property ownership)
○ Interest (from capital, e.g., savings, bonds)
○ Profit (from entrepreneurship)
○ Pensions, dividends from shares (stocks), government benefits (transfer payments).
● Distribution: Income is typically distributed unequally within a population.
Wealth:
● Type: A stock concept – measured at a specific point in time.
● Definition: The total monetary value of assets owned by an entity (individual, household, etc.) minus their liabilities (debts).
● Components Include: Savings, stocks, bonds, real estate (houses, land), valuable objects (art, jewelry), etc.
● Distribution: Wealth is also typically distributed unequally, often showing greater inequality than income distribution because wealth can be accumulated over generations and generates income itself.
Gini coefficient & Lorenz curve
measures the degree of income inequality within a population, based on the Lorenz curve.
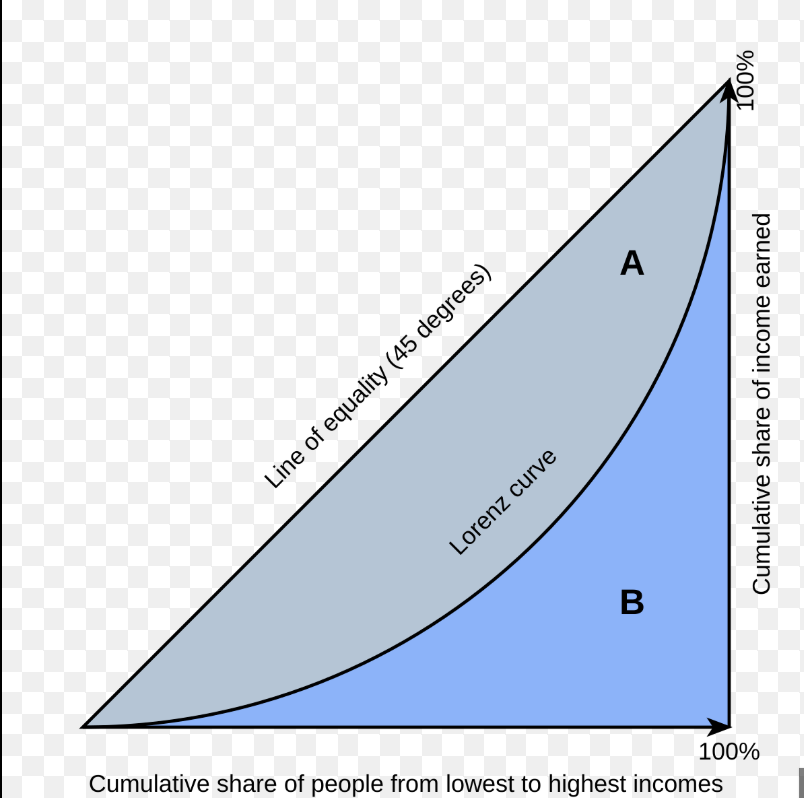
Area A between 1st line and 2nd line, Area B between 2nd line and 3rd line
Gini Coefficient = Area A / (Area A+Area B)
● Gini = 0: Represents perfect equality. In this theoretical case, the Lorenz curve is the line of perfect equality, so Area A is zero.
● Gini = 1: Represents perfect inequality. In this theoretical case, one person or household has all the income, the Lorenz curve hugs the horizontal axis and then shoots up the vertical axis at the very end. Area A becomes equal to the total area (A+B).
● In Practice: Real-world Gini coefficients lie between 0 and 1.
○ A higher Gini coefficient (closer to 1) indicates greater income inequality (the Lorenz curve bows further from the diagonal).
○ A lower Gini coefficient (closer to 0) indicates lesser income inequality (the Lorenz curve is closer to the diagonal).
Poverty
refers to the inability of individuals, families, or households to satisfy their minimum essential consumption needs for survival, well-being, and participation in society.
Two key perspectives:
1. Absolute Poverty: This perspective focuses on the deprivation of basic human needs required for physical survival and functioning. It's about lacking sufficient resources to afford essentials like food, safe drinking water, sanitation, health, shelter, and education.
2. Relative Poverty: This perspective defines poverty in relation to the prevailing living standards within a particular society. It's about having significantly less income or resources than the average person or household, leading to social exclusion.
Absolute poverty
measured using a poverty line- specific minimum threshold of income (or sometimes consumption expenditure) established by an authority.
Individuals or households whose income/consumption falls below this line are officially classified as living in absolute poverty.
Poverty lines are typically based on estimating the cost of acquiring a "minimum basket" of goods and services deemed necessary for basic subsistence in a specific context. This often includes minimal nutritional requirements (food), plus allowances for non-food essentials (like clothing, shelter, fuel).
types of poverty lines:
1. National Poverty Lines: Most countries establish their own domestic poverty lines. These reflect national circumstances, living costs, standards of living, andsocietal views on minimum needs. They vary considerably between countries.
2.International Poverty Line: Developed by international organizations like the World Bank to allow for comparisons of poverty levels across different countries and to track global poverty trends. These lines are typically expressed in US dollars adjusted for Purchasing Power Parity (PPP) to account for differences in the cost of living between countries. World Bank figure in 2024 was less than $2.15 per day.
Relative poverty
defines poverty not based on a fixed standard of basic needs (like absolute poverty), but rather in comparison to the prevailing standard of living and income levels within a specific society.
to the condition of having significantly fewer resources (typically income) than the average or median
person/household in that society.
Inequality: Relative poverty is inherently tied to the distribution of income. The wider the income gap (i.e., the greater the income inequality), the larger the number of people likely to fall below a relative poverty threshold compared to the median income.
Relative poverty is typically measured by setting a relative poverty line based on the country's income distribution.
● This line is usually defined as a certain percentage of the median household income.
● A common international benchmark is 50% of the median disposable household income. (Another frequently used threshold,
especially in Europe, is 60%).
● Example: If a country's median household income after taxes and transfers is $50,000 per year, the 50% relative poverty line
would be $25,000. Households earning below this figure would be considered relatively poor.
Poverty disparities
Uneven Impact: Poverty does not affect all segments of a population equally. National average poverty rates can conceal
significant differences experienced by various demographic and social groups.
Identifying Vulnerable Groups: Analysis often reveals that certain groups consistently face a higher risk of poverty than
others. Depending on the specific country and its social context, these may include:
○ Children (Under 18 years)
○ Elderly / Senior Citizens (65 years and over)
○ Single-parent households (disproportionately female-headed)
○ Women
○ Racial, ethnic, or religious minorities
○ Indigenous populations
○ People with disabilities
○ Individuals with lower levels of education
○ Residents of specific geographic regions (e.g., rural vs. urban, deprived areas)
Wealth Disparities: Beyond income poverty, significant disparities often exist in wealth accumulation among different social groups (e.g., the racial wealth gap). These wealth gaps can exacerbate vulnerability to poverty and limit intergenerational economic mobility. The snippet mentioned projections of a widening racial wealth gap in the US as an example of this ongoing concern.
limitations
Limitations of Income-Based Poverty Measures:
While crucial, poverty lines based solely on income (absolute or relative) may not fully capture the complexity of poverty.
People can suffer from significant non-monetary deprivations (e.g., lack of access to healthcare, education, clean water) even if their income is slightly above a poverty line.
Composite Indicators:
● Definition: These are statistical measures created by combining multiple individual indicators into a single index score.
● Purpose: They aim to measure complex, multidimensional concepts (like poverty, development, or well-being) that cannot be
adequately described by a single indicator. They provide a more holistic assessment.
MPI Multidimensional Poverty Index
The MPI measures poverty by looking directly at multiple deprivations faced by individuals and households simultaneously. It moves beyond just income to consider whether people lack essential things in different aspects of their lives.
3 dimensions:
Health: Capturing aspects of basic health and survival.
Education: Capturing access to basic education and knowledge.
Living Standards: Capturing access to essential services and basic assets.
Difficulties in measuring poverty
Different Meanings, Different Results:
○ Absolute Poverty: Lack of basic subsistence needs (using poverty lines).
○ Relative Poverty: Income/resources compared to societal median (using % of median income).
○ Multidimensional Poverty: Deprivations across health, education, living standards (using MPI).
● These different approaches capture different facets of poverty and often yield significantly different estimates of how many people are considered
poor. They may not present a consistent picture.
Income Focus vs. Broader Resources:
Many poverty measures rely heavily on income. However, this might not fully reflect a household's economic situation:
○ Some households might have low income but possess wealth (savings, assets) they can use during hard times.
○ Conversely, some might own assets (like a house) but have very low current income.
● Income measures alone don't capture this interplay between flows (income) and stocks (wealth).
Limitations of Household Surveys: Much poverty data comes from surveys, which have inherent challenges:
4. Ignoring Cost of Living Differences:
● National poverty lines often apply uniformly across a country, failing to account for substantial variations in the cost of living between regions (e.g.,
expensive major cities vs. lower-cost rural areas).
● This can lead to underestimating poverty in high-cost urban areas, where the national income threshold may be insufficient to cover basic needs.
5. Headcount vs. Depth of Poverty (Poverty Gap):
● Standard poverty rates (the percentage of people below the line, or headcount ratio) tell us how many people are poor, but not how poor they are.
● They don't measure the poverty gap: the average distance separating the poor from the poverty line. Two regions could have identical poverty rates,
but the average poor person might be much further below the line (experiencing deeper poverty) in one region than the other.
6. Potential Bias in Setting National Poverty Lines:
● The specific income level chosen for a national poverty line is not always purely objective and can sometimes be influenced by government objectives:
● Risk of Overestimation: A government might set a relatively high poverty line. This increases the measured poverty rate, which could potentially
support arguments for needing more foreign aid or development assistance (as mentioned in relation to Chapter 20).
● Risk of Underestimation: A government might set a relatively low poverty line. This reduces the measured poverty rate, which could be used
politically to claim success in poverty reduction or to justify reduced government spending on social programs.
Causes of inequality and poverty
Inequality of Opportunity: Lack of equal access for everyone to quality education, healthcare, financial services, and job opportunities from the start.
Unequal Ownership of Resources: Significant differences in the amount of land, property, financial assets (stocks, bonds), and inherited wealth individuals possess.
Variations in Human Capital: Differences in the levels of education, skills, training, experience, and health among individuals, leading to different earning potentials.
Discrimination: Prejudice and unfair treatment directed towards individuals or groups based on characteristics such as race, ethnicity, gender, age, religion, or disability, limiting their economic advancement.
Disparities in Status and Power: Differences in social standing, political influence, and bargaining power (e.g., workers vs. employers) that affect economic outcomes and resource distribution.
Government Tax and Benefit Policies: The design of a country's tax system (e.g., progressive vs. regressive) and the generosity and structure of its social welfare programs (transfer payments, subsidies) significantly influence income and wealth distribution.
Globalisation: The increasing integration of economies through trade, investment, and migration can create winners and losers, potentially widening inequality within countries even as it reduces global inequality in some cases.
Technological Change: Advancements in technology, particularly automation and skill-biased changes, can increase demand and wages for highly skilled workers while reducing opportunities or wages for less-skilled workers.
Market-Based Supply-Side Policies: Government policies focused on deregulation, privatization, reducing the power of labour unions, and promoting free markets can sometimes lead to wider wage gaps and increased inequality, alongside potential efficiency gains.
Consequences of economic growth
Impeded Economic Growth: Reduces potential growth due to lower investment in education/health by the poor, lower overall
consumer demand, and limited opportunities/credit access for disadvantaged groups.
Reduced Living Standards: Leads to psychological stress, poor health outcomes, reduced life expectancy, limited access to essential services (healthcare, quality education), higher crime rates, and overall lower quality of life.
Lowered Social Cohesion: Creates divisions and stratification within society, erodes trust between groups, and can weaken community bonds.
Political Instability: Can lead to social unrest, resentment, political polarisation, and makes finding consensus on national issues more difficult.
Inefficiency and Wasted Potential: Prevents individuals trapped in poverty from fully developing and utilizing their skills and talents,representing a loss for the overall economy.
Unequal Political Influence: Concentration of wealth can translate into disproportionate political power, potentially leading to policies that favour the wealthy and further entrench inequality.