APHUG Unit 2
1/149
There's no tags or description
Looks like no tags are added yet.
Name | Mastery | Learn | Test | Matching | Spaced | Call with Kai | Chat |
|---|
No analytics yet
Send a link to your students to track their progress
150 Terms
population distribution
pattern in how humans are spread out on Earth
Eurasia
large landmass including Europe (10%) and Asia (60%)
ecumene
places that have permanent human inhabitants
anthropocene
period where human activities = dominant influence on environment
population clusters
extremely populated areas that show how uneven population distribution is
metacities
cities w/ more than 20 million residents
megacities
cities w/ more than 10 million residents
developed/industrialized country
advanced economy and high standard of living (e.g. US)
developing/industrializing country
low income or economically poorer than industrialized countries
Snow Belt
U.S. states located in northern and midwestern parts
Sun Belt
U.S. states located in south and southwestern parts
mean center of population
avg center of a country based on popular distribution
population density
avg number of ppl per unit of land
can mask population distribution
physiological density
avg number of ppl per unit area of land suitable for cultivation
indicator of pressure population puts on agriculture and land
arable land
land suitable for cultivation
agricultural density
number of farmers per unit of arable land
reflect labor intensiveness
carrying capacity
number of ppl Earth can sustain
human well-being
state of being comfortable
population composition
makeup of population based on factors like age, sex
age structure
breakdown of population into different groups
affects future population growth, labor supply, dependency ratios, demand for services, economic growth
dependency ratio
number of dependents (too young to work OR retired) in a population that each 100 working ppl must support
youth dependency ratio
dependency ratio based on young dependents
elderly dependency ratio
dependency ratio based on elderly dependents
generations
groups of ppl who were born around the same time and share cultural and social influences
predict economic and social trends
sex ratio
numerical ratio btwn males and females
androcentrism
cultural preference for males
infanticide
practice of killing infants
consequences of unbalanced sex ratios*
men increasingly unable to find female partners
increase in human trafficking
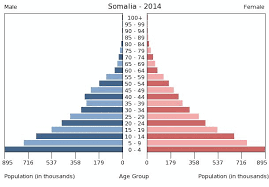
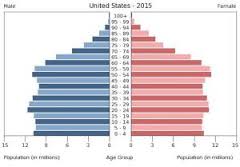
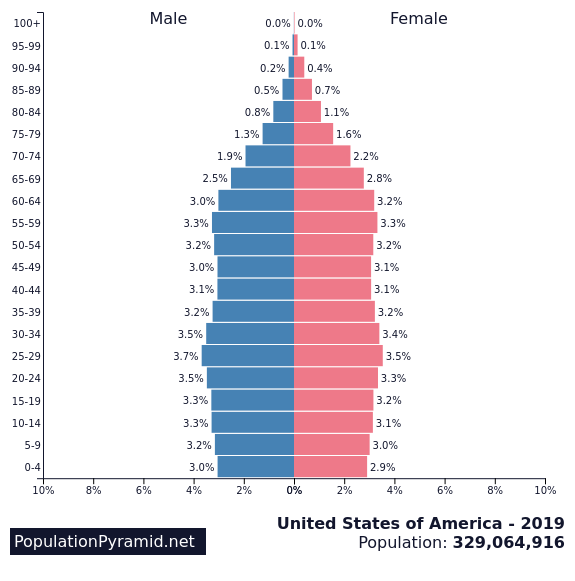
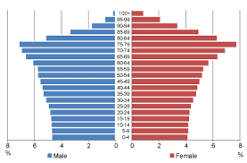
population pyramids
useful graphic device for comparing age and sex structure
*
rapid growth
usually in developing countries (e.g. DRC)
*
slow growth
birth rate is slightly to moderately over death rate
*
stable population growth/zero growth
birth rate and death rate similar
often resemble a pillar
*
decline
elderly ppl increasing
labor shortage, less demand for certain goods
population dynamics*
growth and change of human population on Earth
demographic equation
calculates total population of a place based on natural increase and migration over time
crude birth rate (CBR)
avg number of births per 1000 ppl
relates births to total population without considering age or sex structure
low birth rate
CBR btwn 10 and 20 births per 1000 ppl
transitional birth rate
CBR btwn 20 and 30 per 1000 ppl
high birth rate
CBR more than 30 per 1000 ppl
total fertility rate (TFR)
average number of children born per woman during childbearing years
focuses on females
reveals avg family size
suggest future changes
replacement level fertility
avg number of children needed to replace both parents & stabilize population over time (2.1)
gender roles
societal expectations on what it means to be a certain gender
crude death rate (CDR)
number of deaths per yr per 1000 ppl
relates death without differentiating old or young
infant mortality rate (IMR)
how many infants die within first yr of life per 1000 live births
best indicator of living standards bc of various variables affecting IMR
child mortality
deaths of children under 5
rate of natural increase (RNI)
difference btwn number of births and deaths in a yr and as a percentage
zero population growth (ZPG)
number of births = number of deaths
doubling time
number of yrs it takes for a population to double
rule of 70
tool for calculating doubling time of a population by dividing 70 by country’s RNI
demographic transition model (DTM)
shows how CBR, CDR, and RNI change over time as countries change from agricultural to urban societies
stage 1 of DTM*
high stationary
birth rates and death rates high
before demographic transition
stage 2 of DTM*
early expanding
rapid population growth
death rates drop rapidly
e.g. sub-Saharan Africa
stage 3 of DTM*
late expanding
birth rates drop
birth rates meet death rates
e.g. Mexico, India, Colombia
stage 4 of DTM*
low stationary
birth rates and death rates similar and stabilize
population decrease
e.g. US
stage 5 of DTM*
natural decrease
birth rates = below death rates
population decrease
e.g. Japan, Germany
criticism of the DTM*
based on experiences in northern European countries
nonlinear progression possible (e.g. Afghanistan)
accelerated transition possible (e.g. China)
epidemiology
branch of medicine that studies distribution, causes and control of diseases and other conditions
epidemiological transition theory
causes of human death transition from parasitic/nutritional diseases to chronic, degenerative diseases
seeks to explain how changes in health services & living standards affect patterns of disease
phase 1 of epidemiological transition*
age of pestilence and famine
outbreaks of deadly, infectious disease
population growth: slow to none
phase 2 of epidemiological transition*
age of receding pandemics
rapid declines in death rates bc of sanitation and medicine
population growth speeds up
risk from dying from degenerative diseases increase
degenerative disease
causes deterioration over time
phase 3 of epidemiological transition*
age of degenerative and human-made diseases
death rates decline & then stabilize
chronic and degenerative diseases become main causes of death
phase 4 of epidemiological transition*
age of delayed degenerative diseases
improvement in medical technology for preventing and treating degenerative diseases
Malthusian
relating to Malthusian theory or follower of Malthus
Malthusian theory of population*
humans’ ability to reproduce exceeded ability to produce food
population = exponential growth
food production = linear growth
overpopulation
human population exceeds food supply
Paul Ehrlich*
Neo-Malthusian who warned world will face dire consequences from unrestrained population growth
neo-Malthusians
ppl who today believe in Malthusian theory of population
cornucopians
ppl who disagree w/ Malthusian theory of population
Ester Boserup*
human resourcefulness will invent technology to increase food supply
Boserup effect
increase in food production resulting from use of new farming methods
Julian Simon*
human resourcefulness, new technology, and market forces will solve society’s problems
Karl Marx*
starvation, war, diseases come from unequal distribution of wealth
antinatalist policies
seek to reduce population growth by reducing fertility rates
easier for non-elected gov’ts
consequences of China’s birth control policy*
drastic change in family structure (4-2-1 grandparents-parents-child)
unbalanced sex ratios
aging population growing before developed states
pronatalist policies
seek to boost fertility rates and population growth
increased child allowances, paid maternity leave
increased immigration
women’s status
degree of equality btwn men and women in terms of access and in control of physical and social resources
women’s empowerment
women’s increased freedom to make choices and change their lives
women’s status and effects on mortality*
higher status reduces infant, child and maternal mortality
women’s status and effects on migration*
women may have to take husband’s responsibilities
women may migrate for better jobs in countries w/ more female autonomy
more opportunities for education and exposure to modern ideas
aging population
population that ages as the # or proportion of elderly population increases
median age
age that divides population into 2 halves
indicator of age distribution
factors like migration by young ppl can influence median age
e.g. 14, 18, 20, 24, 29
life expectancy
# of yrs expected to live
consequences of aging population*
labor force shortage
rising elderly dependency ratio
changing economy
population decline
spatial mobility
all forms of geographical movement
social (upward) mobility
change in social hierarchy
e.g. employee gets job promotion
migration
long term/permanent move of ppl
migrant/mover
someone who migrates
non-migrants/stayer
ppl who don’t move
origin
location before relocating
destination
place migrant is going
out-migration
act of someone leaving origin
in-migration
act of someone arriving at destination
out-migrant
someone who leaves origin
in-migrant
someone who arrives at destination
immigration
act of someone arriving at destination
emigration
act of someone leaving origin
migration stream
flow of migrants from origin to destination
counterstream
flow of migrants from destination to origin
net migration
difference btwn in-migrants and out-migrants