FINANCIAL RATIOS
 Call Kai
 Learn
Learn Practice Test
 Spaced Repetition
 Match
Match Flashcards
 Knowt Play
1/41

There's no tags or description
Looks like no tags are added yet.
Name | Mastery | Learn | Test | Matching | Spaced | Call with Kai | Chat |
|---|
No analytics yet
Send a link to your students to track their progress
42 Terms

Current Ratio
is a liquidity ratio that measures a company's ability to pay short-term obligations with its current assets. It is calculated by dividing current assets by current liabilities.

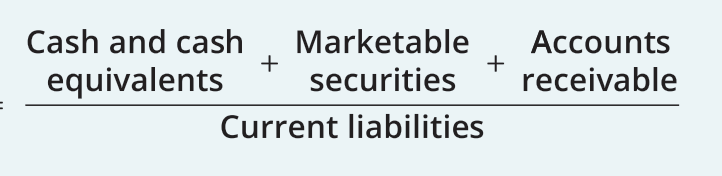
Quick Ratio / Acid-Test Ratio
is another liquidity ratio that measures a company's ability to cover its short-term liabilities without relying on the sale of inventory.
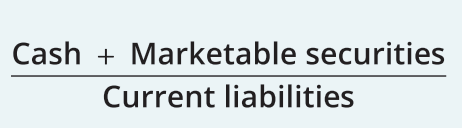
Cash Ratio
is a more conservative liquidity ratio that measures a company's ability to pay off short-term liabilities using only its cash and cash equivalents.

Operating Cash Flow Ratio
is a liquidity ratio that measures the ability of a company to cover its short-term liabilities with its operating cash flow

Net Working Capital Ratio
is a financial metric that evaluates a company's short-term liquidity and indicates the efficiency of a company in managing its working capital.

Degree of Operating Leverage
financial metric that measures how sensitive a company's operating income (or Earnings Before Interest and Taxes, EBIT) is to a percentage change in sales
High: Means a company has a large amount of fixed costs (like rent or machinery) compared to variable costs.
Low: Means a company relies more on variable costs (like raw materials per item sold).
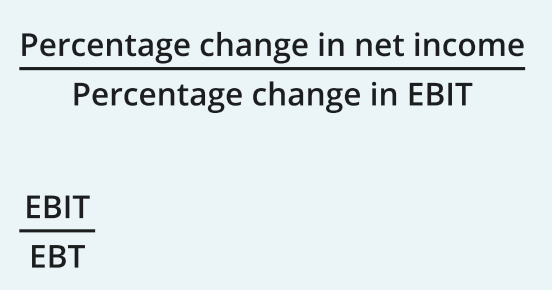
Degree of Financial Leverage
measures how sensitive a company's earnings per share (EPS) or net income are to changes in its operating income, driven by the use of debt
High: A high number means the company uses a large amount of debt. Small shifts in operating profit lead to massive swings in net income. This brings high potential rewards, but also high financial risk during downturns.
Low: A low number (close to 1) means the company uses very little debt. Earnings are much more stable, but profits do not get amplified

Financial Leverage ratio (Equity multiplier)
measures how much debt a company uses to fund its assets and operations compared to its equity or earnings
1.0 (or low): Means the company uses little to no debt and relies mostly on equity. This is safer, but might mean missed growth chances.
Higher numbers: Show heavier reliance on borrowed money. This can boost profits during good times, but creates high risk if earnings drop
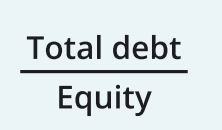
Debt-to-Equity ratio
compares a company’s total liabilities to its shareholder equity to measure how much borrowing is used to finance operations
Lower Ratios (Under 1.0): Generally indicate a stable, conservative business that relies more on owned capital than borrowed funds.
Balanced Ratios (1.0 to 2.0): Often considered a healthy, normal range depending on the specific sector
Higher Ratios (Above 2.0): Signal higher financial risk because the company depends heavily on debt and must pay fixed interest costs regardless of market conditions

Long-Term Debt-to-Equity ratio
divides a company’s long-term debt by its shareholders' equity to measure its financial leverage and long-term risk
Ratio of 1.0: “This indicates that a company's long-term debt is equal to its equity. A company with a 1:1 ratio is considered to be equally financed by debt and equity.”
Below 1.0: “A ratio less than 1.0 means the company has more equity than debt, which is generally seen as a sign of financial strength.”
Above 1.0: “A ratio higher than 1.0 indicates that a company has more debt than equity. This suggests higher leverage and may raise concerns among investors.”
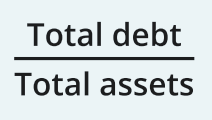
Debt-to-Total-Assets ratio
measures the percentage of a company's assets financed by creditors rather than equity
Below 1.0 (or 100%): The company owns more assets than it has debt, which is normal for healthy businesses.
Above 1.0 (or 100%): The company has more debt than assets, signaling high risk or technical insolvency.
0.3 to 0.6 (30% to 60%): A common range where many investors feel comfortable, though safe levels vary by industry.

Fixed-charge coverage ratio (Earnings to Fixed-Charges ratio)
measures a company's ability to cover its fixed recurring expenses, such as debt payments, interest, and lease obligations, using its earnings or cash flow
Above 2.0x: Indicates strong financial solvency and a high capacity to comfortably handle current debts and potential new borrowing.
1.0x to 2.0x: Shows the company covers its basic obligations, but leaves little margin for economic downturns or revenue drops.
Below 1.0x: Warns that operational earnings fall short of covering fixed expenses, signaling a high risk of financial distress or insolvency.
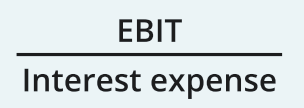
Times Interest Earned ratio
also called the interest coverage ratio, measures a company's ability to pay the interest on its debt using its operating earnings
Above 2.5x: Generally considered a healthy and safe level for meeting debt obligations.
Below 1.0x: A warning sign that the company does not generate enough operating income to pay its interest bills and must use cash reserves or borrow more money.
Too High: An extremely high ratio might mean management is hoarding cash instead of reinvesting in the business for future growth

Cash flow to fixed-charges ratio
measures how easily a company can pay its fixed, recurring expenses (like debt payments, interest, and lease or rent obligations) using its available operating earnings
Above 1.0x: The company generates enough earnings or cash flow to cover its fixed obligations.
Below 1.0x: The business does not generate enough cash from operations to pay its fixed costs, signaling potential financial distress.
2.0x to 3.0x or higher: Considered healthy and ideal by lenders, indicating a strong buffer against drops in revenue or economic downturns.
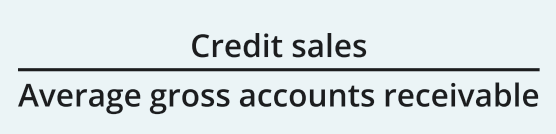
Accounts Receivable Turnover
measures how fast a company collects payments from its customers who buy on credit
High Ratio: Shows efficient collection, strong cash flow, and customers who pay their bills on time.
Low Ratio: Points to a slow collection process, tighter cash flow, or customers who struggle to pay

Inventory turnover
measures how many times a business sells and replaces its stock over a specific period
High Ratio: Shows strong sales, efficient management, and less cash tied up in stock. Very high numbers can mean stock levels are too low, causing missed sales.
Low Ratio: Points to weak demand, poor planning, or overstocking, which increases storage costs and risk of spoiled or obsolete goods

Accounts Payable turnover
short-term liquidity metric that measures how many times a company pays off its suppliers during a specific period
High Ratio: Shows that a business pays its bills quickly, which builds strong supplier trust and signals good creditworthiness. However, a very high ratio might mean you are missing out on favorable early-payment windows or tying up cash too fast
Low Ratio: Shows that a company takes longer to pay its suppliers. This can mean you negotiated great credit terms, but it can also warn of poor cash flow or trouble paying bills on time

Day Sales Outstanding in Accounts Receivable
measures the average number of days it takes a company to collect payment after making a sale
Low DSO: Means customers pay quickly, giving the business fast access to cash for daily operations or growth.
High DSO: Means collections take too long, which can hurt cash flow and cause financial stress.
Benchmarking: A DSO of 45 days or less is often considered good, but ideal numbers vary widely by industry
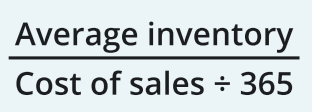
Day Sales in Inventory
average number of days a company takes to turn its inventory into sales
Low DSI: Means fast sales and good inventory optimization, but risks stockouts.
High DSI: Signals excess stock, weak sales, or potential product obsolescence.

Days Purchases in Accounts Payable
measures the average number of days a company takes to pay its suppliers and vendors
High DPO: Indicates that a company holds onto its cash longer, which can free up short-term working capital and liquidity. However, if it is too high, it may signal that the business is struggling to pay bills or straining vendor relationships
Low DPO: Shows that the company pays suppliers promptly, which builds strong trust and credit reputation. Yet, it can mean the business ties up cash too quickly and misses out on short-term investment flexibility

Operating Cycle
the time it takes a business to buy inventory, sell it, and collect cash from customers

Cash Cycle
measures the time in days it takes for a company to convert its investments in inventory and other resources into cash flows from sales

Total Asset Turnover
measures how efficiently a company uses its assets to generate net sales revenue
Higher Ratio: Indicates the company uses its assets very effectively to drive sales.
Lower Ratio: Suggests underutilized equipment, slow operations, or excess inventory.
Industry Differences: Retail and grocery stores usually have high ratios with low margins, while manufacturing and utility companies have low ratios with large asset bases

Fixed Asset Turnover
measures how efficiently a company uses its long-term assets, like property and equipment, to generate net sales
Higher is Better: A high ratio means the company successfully turns its physical investments into strong revenue.
Lower Might Mean Trouble: A low ratio can point to idle equipment, poor management, or overinvestment in heavy machinery.
Industry Context: Manufacturing or utility firms naturally require heavy equipment and have lower ratios than service companies. Always compare peers within the same sector

Book value per share
measures a company's net asset value on a per-share basis, providing the baseline accounting value left for shareholders if the firm were liquidated
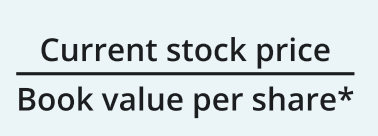
Market-to-book ratio
also known as the price-to-book or P/B ratio) compares a company's market value to its book value to show how much investors are paying for each dollar of the company's net assets

Price-Earnings Ratio
measures a company's share price relative to its earnings per share

Basic EPS
measures a company's profit allocated to each share of common stock

Diluted EPS
financial metric that measures a company's profit per share while accounting for all potential shares that could be created

Earnings Yield
financial percentage return a company generates per share for each dollar invested in its stock

Dividend Yield
measures a company's annual dividend payments as a percentage of its current share price

Dividend Payout Ratio
percentage of a company's net income paid to shareholders as cash dividends
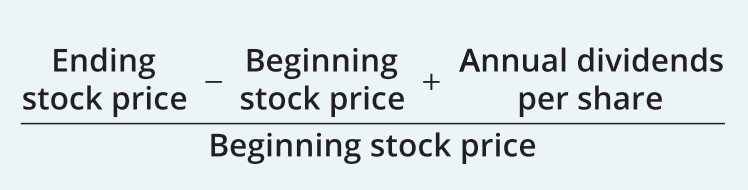
Shareholder Return
measures the overall financial profit or loss an investor receives from a stock over a specific period, factoring in both share price changes and cash dividends

Gross Profit Margin Percentage
fraction of total revenue left over after subtracting the direct costs of making a product or providing a service, expressed as a percentage
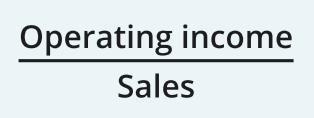
Operating Profit Margin Percentage
share of revenue left over after paying for core operating costs

Net Profit Margin Percentage
shows how much of each dollar earned by a business turns into actual net profit after paying all expenses
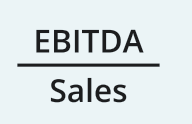
EBITDA margin percentage
measures a company's earnings before interest, taxes, depreciation, and amortization as a percentage of its total revenue
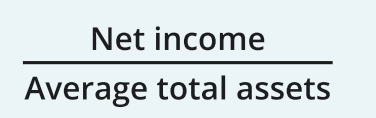
Return on Assets
measures how efficiently a company uses its assets to generate profit
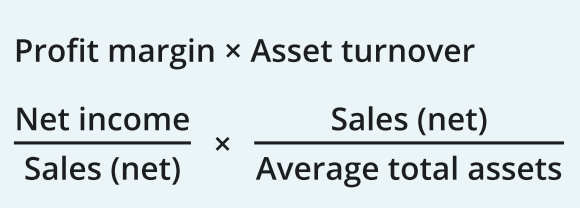
DuPont return on assets

Return on Equity
measures how efficiently a company uses its shareholders' equity to generate net income
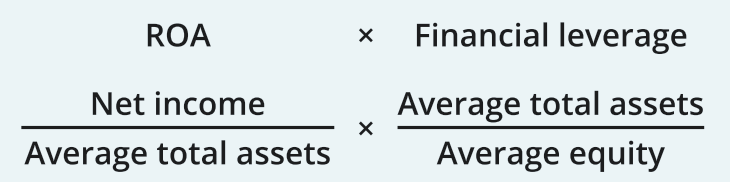
DuPont Return on Equity

Sustainable Growth Rate
maximum annual percentage increase in sales a company can achieve without changing its financial policy or issuing new equity