Ecology Exam 3
 Call Kai
 Learn
Learn Practice Test
 Spaced Repetition
 Match
Match Flashcards
 Knowt Play
1/136

Earn XP
Description and Tags
Chapters 13, 14, 15, 16, 21, and 22
Name | Mastery | Learn | Test | Matching | Spaced | Call with Kai | Chat |
|---|
No analytics yet
Send a link to your students to track their progress
137 Terms
Generalist
Species that interact with many other species.
Specialist
Species that interact with one or a few other species.
Obligate Mutualists
Two species that provide fitness benefits to each other and require each other to persist.
Facultative Mutualists
Two species that provide fitness benefits to each other but whose interaction is not critical to the persistence of either species.
Mycorrhizal Fungi
Fungi that surround plant roots and help plants obtain water and minerals.
Endomycorrhizal Fungi
Fungi characterized by hyphal threads that extend far out into the soil and penetrate root cells between the cell wall and the cell membrane.
Arbuscular Myccorhizal Fungi
A type of endomycorrhizal fungi that infects a tremendous number of plants, including apple trees, peach trees, coffee trees, and grasses.
Ectomycorrhizal Fungi
Fungi characterized by hyphae that surround the roots of plants and enter between root cells but rarely enter the cells.
Microbiome
The community of microorganisms that live in regions of a plant’s or animal’s body - including bacteria, viruses, fungi, and protists.
Endophytic Fungi
Fungi that live inside a plant’s tissue.
Examples of Mutualism for Resources
. Algae and fungi that form lichen
. Corals and zooxanthellae that form coral reefs
. Plants, fungi (endo- and ectomycorrhizal), and Rhizobium bacteria
. Animals and protists for digesting of food
Examples of Defensive Mutualism in Plants
. Pairing with aggressive insects such as ants
. Pairing with endophytic fungi that produce chemicals harmful to herbivores
Examples of Defensive Mutualism in Animals
. Cleaner fish that remove parasites from larger fish
. Oxpecker birds that remove ticks from mammals
Examples of Mutualism Between Plants and Animals
. Pollinators aid in plant fertilization, and some plants have evolved traits that favor specific pollinators; thus, they can coevolve.
. Animals storing plant seeds far from the parent plant help in seed dispersal.
. Animals consuming plant fruits disperse seeds post-digestion in their waste.
Condition Effects on Mutualism
When conditions change (e.g., drought, decline in food source, etc.), positive mutualism can change to a neutral or negative interaction. Sometimes rewards can be rewarded only to individuals that provide benefits, effectively denying “cheaters” in mutualism.
Mutualism’s Effect on Participating Species
Mutualism can increase or decrease the abundance of participating species. For example, an absent mutualist cna cause another species to be completely eliminated.
Mutualism’s Effect on Communities
Mutualism can affect communities either by directly altering the number of species or by initiating a chain of interactions through a community.
Mutualism’s Effect on Ecosystems
Mutualism can cause nutrients to move into producers (e.g., mycorrhizal fungi fixing phosphorus for plants), thereby increasing producers’ total biomass.
Introduced Species
A species that is introduced to a region of the world where it has not historically existed.
Also known as Exotic Species or Non-Native Species.
Invasive Species
An introduced species that spreads rapidly and has negative effects on other species, human recreation, or human economies.
Biological Control
Introductions of one species to help control the abundance of another species.
Mesopredators
Relatively small carnivores that consume herbivores.
Top Predators
Predators that typically consume both herbivores and mesopredators.
Lotka-Volterra Model
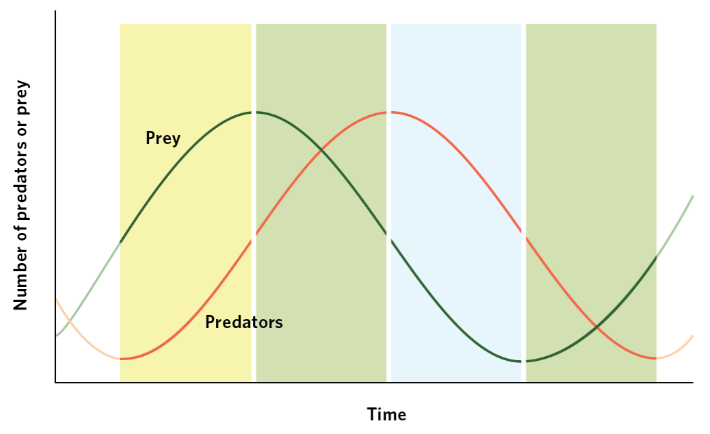
A model of predator-prey interactions that incorporates oscillations in the abundances of predator and prey populations and shows predator numbers lagging behind those of their prey.
Created by Alfred Lotka and Vito Volterra.
Lotka-Volterra Representation of Stable Prey Population
A population is stable when its rate of change is 0. Can be represented as: 0 = rN - cNP
This can be further simplified to: rN = cNP
and even further simplified to: P = r / c .
Lotka-Volterra Representation of Prey Population Increase
The prey population will increase whenever the addition of prey exceeds the consumption of prey, as depicted:
rN > cNP or P < r / c
Lotka-Volterra Representation of Prey Population Decrease
The prey population will decrease whenever the addition of prey is less than the consumption of prey, as depicted:
rN < cNP or P > r / c
Lotka-Volterra Representation of Stable Predator Population
A population is stable when its rate of change is 0. Can be represented as: 0 = acNP - mP
This can be further simplified to: acNP = mP
and even further simplified to: N = m / ac
Lotka-Volterra Representation of Predator Population Increase
The predator population will increase whenever the production of new predators exceeds the mortality of existing predators, as depicted:
acNP > mP or N > m / ac
Lotka-Volterra Representation of Predator Population Decrease
The predator population will decrease whenever the production of new predators is less than the mortality of existing predators, as depicted:
acNP < mP or N < m / ac
Equilibrium Isocline
The population size of one species that causes the population of another species to be stable.
Also known as Zero Growth Isocline.
Joint Population Trajectory
The simultaneous trajectory of predator and prey populations.
Graph Depicting Lotka-Volterra Model
Joint Equilibrium Point
The point at which the equilirbium isoclines for predator and prey populations cross.
Functional Response
The relationship between the density of prey and an individual predator’s rate of food consumption.
Type I Functional Response
A functional response in which a predator’s rate of prey consumption increases in a linear fashion with an increase in prey density until satiation occurs.
Type II Functional Response
A functional response in which a predator’s rate of prey consumption begins to slow down as prey density increases and then plateaus when satiation occurs.
Type III Functional Response
A functional response in which a predator exhibits low prey consumption under low prey densities, rapid consumption under moderate prey densities, and slowing prey consumption under high prey densities.
Search Image
A learned mental image that helps the predator locate and capture food.
Numerical Response
A change in the number of predators through population growth or population movement due to immigration or emigration.
Crypsis
Camouflage that either allows an individual to match its environment or breaks up the outline of an individual to blend in better with the background environment.
Warning Coloration
A strategy in which distastefulness evolves in association with very conspicuous colors and patterns.
Also known as Aposematism.
Batesian Mimicry
When palatable species evolve warning coloration that resembles unpalatable species.
Müllerian Mimicry
When several unpalatable species evolve a similar pattern of warning coloration.
Coevolution
When two or more species affect each other’s evolution.
Predation Hierarchy Effect on Population
Predators commonly limit the abundance of prey
Herbivores commonly limit the abundance of producers
Removal of top predators commonly increases abundance of mesopredators
Biological Control vs. Introduced Species
Introduced species can sometimes be reduced using biological controls, however the new control species often cause their own harm to native species.
Numerical vs. Functional Responses
Functional Responses involve changes in the rate of food consumption as food density changes. Numerical responses involve changes in the population growth or population movement due to immirgration or emigration as the density of food changes.
Prey Defense Types
Behavioral defenses (e.g., alarm calling, spatial avoidance, and reduced activity)
Mechanical defenses (a.k.a., structural defenses, such as a porcupine’s quills)
Chemical defenses
Crypsis
Mimicry
Producer Defenses Against Herbivores
Producers have evolved mechanical defenses, chemical defenses, and tolerance.
Cons of Evolved Defenses
Evolved defenses are commonly costly. They can also be countered by subsequent adaptations in predators.
Infection Resistance
The ability of a host to prevent an infection from occurring.
Infection Tolerance
The ability of a host to minimize the harm once an infection has occurred.
Parasite Load
The number of parasites of a given species that an individual host can harbor.
Common Parasites by Human Body Region
Brain: Prion → Creutzfeldt-Jakob Disease
Scalp: Head Lice (Pediculus humanus)
Liver: Liver Fluke (Fasciola spp.) → Fasciolosis
Lungs: Bacterium (Mycobacterium spp.) → Tuberculosis
Heart and Blood: Protist → Malaria
Multiple Body Systems: Virus (EBOV); Virus (HIV) → Ebola Virus Disease; AIDS
Digestive Tract: Bacterium (Helicobacter pylori); Tapeworms (several genera) → Some stomach ulcers
Genitalia: Fungus (Candida albicans) → Candidal Vulvovaginitis
Many Body Areas: Black-legged Tick (Ixodes scapularis) → Lyme Disease
Skin: Itch Mite (Sarcoptes scabiei); Chigger Mite (Trombicula alfreddugesi) → Scabies; Chiggers
Feet: Fungus (Trichophyton rubrum) → Athlete’s Foot
Ectoparasite
A parasite that lives on the outside of an organism.
Endoparasite
A parasite that lives inside an organism.
Emerging Infectious Disease
A disease that is newly discovered or has been rare and then suddenly increases in occurrence.
Ectoparasite Examples
Nematode
Flea
Tick
Louse
Mite
Endoparasite Examples
Viruses (e.g., H1N1)
Prions (e.g., mad cow disease, chronic wasting disease)
Protozoans (e.g., diarrhea, malaria)
Bacteria (e.g., anthrax, plague, pneumonia, salmonella, leprosy, and many STDs)
Fungi (e.g., Dutch elm disease, rust [not the metal oxidation], chytrid fungus
Helminths (e.g., roundworms, flatworms, hookworms, lungworms, and echinostome worms)
Horizontal Transmission
When a parasite moves between individuals other than parents and their offspring.
Vector
An organism that a parasite uses to disperse from one host to another.
Vertical Transmission
When a parasite is transmitted from a parent to its offspring.
Reservoir Species
Species that can carry a parasite but do not succumb to the disease that the parasite causes in other species.
Modes of Parasites Entering Hosts
Piercing through tissue (leeches)
Reliance on OTHER species to pierce the tissue and use the damaged tissue as entry (some viruses, bacteria, protists)
Ingestion
Susceptible-Infected-Resistant (S-I-R) Model
The simplest model of infectious disease transmission that incorporates immunity.
The fluctuations modeled by SIR occur because of transmission increase from host density and decrease from developed host immunity.
SIR Model Steps
Probability of contact between susceptible (S) and infected (I) individuals = S * I
Rate of infection (b) between susceptible and infected individuals = S * I * b
Rate of recovery (g) of infected individuals = I * g
Reproductive ration of the infection (R0) = Rate of new infections / Rate of recoveries → R0 = (S * I * b) / (I * g) → R0 = S * b / g
R0 Value Interpretation
If your R0 value is greater than 1, the infection will continue to spread and cause an epidemic. If your R0 value is less than 1, the infection fails to take hold in the host population.
SIR Model Assumptions
There are no births of new susceptible individuals
Individuals retain any resistances they develop
t-Test
A statistical test that determines if the distributions of data from two groups are significantly different.
Pathogen
Parasites that cause diseases.
Factors Affecting Host Infection
The parasite’s mode of entering the host
The parasite’s ability to infect reservoir species
The parasite’s ability to jump to new host species
The parasite’s ability to avoid the host’s immune system
Intraspecific Competition
Competition among individuals of the same species.
Interspecific Competition
Competition among individuals of different species.
Resource
Anything an organism consumes or uses that causes an increase in the growth rate of a population when it becomes more available.
Renewable Resources
Resources that are constantly regenerated.
Nonrenewable Resources
Resources that are not regenerated.
Liebig’s Law of the Minimum
Law stating that a population increases until the supply of the most limiting resource prevents it from increasing further.
Competitive Exclusion Principle
The principle that two species cannot coexist indefinitelywhen they are both limited by the same resource.
Competition Coefficients
Variables that convert between the number of individuals of one species and the number of individuals of the other species. Represented by α and β when solving for species 1 and 2, respectively.
Zero Population Growth Isocline
Population sizes at which a population experiences zero growth.
Exploitative Competition
Competition in which individuals consume and drive down the abundance of a resource to the point that other individuals cannot persist.
Interference Competition
When competitors do not immediately consume resources but defend them.
The two types of interference competition are aggressive interactions between species and allelopathy.
Apparent Competition
When two species have a negative effect on each other through an enemy, such as a predator, parasite, or herbivore.
Cases of apparent competition involve another type of interaction such as predation, herbivory, or parasitism.
Allelopathy
A type of interference that occurs when organisms use chemicals to harm their competitors.
Chi-Square Test
A statistical test that determines whether the number of observed events in different categories differs from an expected number of events, which is based on a particular hypothesis.
Realistic Outcomes of Multiple Limiting Resources
In a situation wherein multiple species are limited by resources, coexistence of multiple species of competitors is possible so long as each species is limited by a different resource.
Factors Affecting Competition Outcomes
If a species is competitively superior but intolerant of extreme abiotic conditions, it will not dominate areas with those conditions.
If a species is competitively superior but intolerant of frequent disturbances, it will not dominate.
Superior competitors that are more vulnerable to herbivores or predators cannot outcompete inferior competitors since the former will be preferentially harmed/killed.
Landscape Ecology
The field of study that is focused on the spatial arrangement of habitats at different scales and how this influences individuals, populations, communities, and ecosystems.
Legacy Effects
A long-lasting influence of historical processes on the current ecology of an area.
Local Diversity
The number of species in a relatively small area of homogeneous habitat, such as a stream.
Also known as Alpha Diversity.
Regional Diversity
The number of species in all the habitats that comprise a large geographic area.
Also known as Gamma Diversity.
Beta Diversity
The number of species that differ in occurrence between two habitats.
Regional Species Pool
The collection of species that occurs within a region.
Species Sorting
The process of sorting species in the regional pool among localities according to their adaptations and interactions.
Species-Area Curve
A graphical relationship in which increases in area (A) are associated with increases in the number of species (S). Represented by the following equation:
S = cAz where c and z are constants fitted to the data.For graphing ease, you can also take the logarithm of both sides: log S = log c + z log A
Species Accumulation Curve
A graph of the number of species observed in relation to the number of individuals sampled.
Stepping Stones
Small intervening habitat patches that dispersing organisms can use to move between large favorable habitats.
Equilibrium Theory of Island Biogeography
A theory stating that the number of species on an island reflects a balance between the colonization of new species and the extinction of existing species.
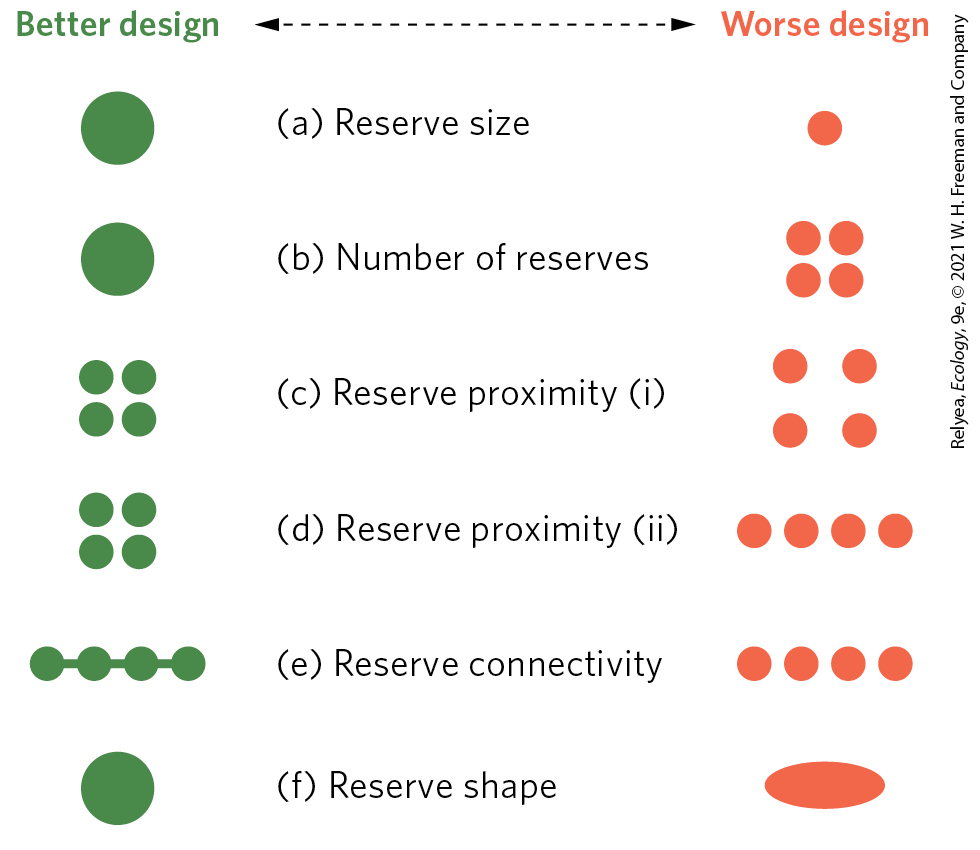
Diagram of Ideal Nature Reserves Design