Working scientifically 1 - 33
1/28
There's no tags or description
Looks like no tags are added yet.
Name | Mastery | Learn | Test | Matching | Spaced | Call with Kai |
|---|
No study sessions yet.
29 Terms
Meanings of prefixes : Pico , nano, micro, milli, kilo, mega, giga, tera
10 to power of : -12, -9, -6, 3, 6, 9, 12
Base quantities and their units
length - meter (m)
temperature - kelvin (k)
current - ampere (a)
time - second (s)
luminous intensity - candela (cd)
mass - kilogram (kg)
amount of subsance - mol
Define accuracy
how close a measured value is to the true value
Define precise
how close repeated measurements are to one another
Define resolution
the smallest measuring interval on a measuring instrument
define valid
a measurement is valid if it measures what it is supposed to be measuring
define repeateable
if measurements are repeated by the same person in the same laboratory with the same equiptment and the repeated results are close to each other
define reproducible
if measurments are repeated by a different person or using different technqiues and the results are close to each other
define true value
the value that would have been obtained in an ideal measruement
define uncertainty
the interval within which the true value can be considered to lie with a given level of confidence
define error
the difference between the measurement result and the true value (NOT A MISTAKE IN THE MEASURMENT)
A student comments that the measurment of 2.40V is more precise than the measurement of 2.4V. Explain why they are incorrect
precision is a measure of the closeness of repeated measurements
both 2.40V and 2.4V are single measurements so we cannot comment on their ‘precision’
the result 3.40V has been measured using a higher resoltuion multimeter
so 2.40V has a lower absoulte uncertatinty (0.005V as compared to 0.05V)
explain why doing repeat measruements increases the likelihood of an accurate measurement
repeating measurments reduces the effect of random error
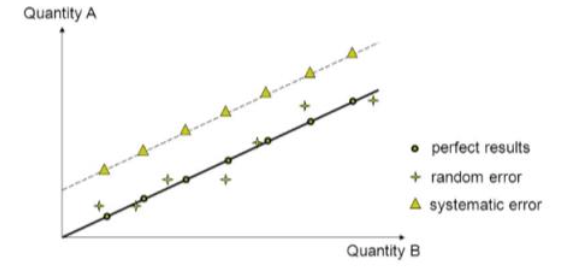
describe how data with a systematic error would affect the appearance of a line of best fit on a praph
it would adjust the value of the y or x intercept a every data point has the same error
describe how data with a random error would affect the appearance of a line of best fit on a graph
it would increase the spead of data around the line of best fit - both above and below the line
how to calculate the absolute uncertainty in a single reading
absolute uncertainty in a single reading = resolution / 2
how to calculate absolute uncertainty in a set of repeated data
exclude anomalies/
calculate range
absolute uncertainty = range / 2
formula for calcuating percentage uncertainty with a single measurment
= absolute uncertainty / measurement x 100
formula for calculating percentage uncertainty with repeats
absolute uncertainty / mean value x 100
experimental choices to make to increase the likelihood of getting an accurate result
aim to reduce the percentage uncertainty in the measurments
to do this choose equiptment with a high resolution - this will have a low absolute uncertainty resulting in a low percentage uncertainty
or if possible, increase the measurement we are taking. for same absolute uncertainty this will reduce percentage uncertainty
why is dropping a ball from an upstairs window instead of a lower one for an experiement more likely to produce an accurate result?
the time taken for the ball to fall will increase. this will reduce the percentage uncertainty in the measurement of time
how to calcualte absolute uncertainty in a measurment when given its percentage uncertainty
absolute uncertainty = (percentage uncertainty / 100) x mean value
state the range of values a measured value can take when given its percentage uncertainty e.g
resistance = 4ohms +- 2%. what is the range of resistance
find absol uncertainty = 2/100 × 4 = 0.08
resistance = 4=- 0.08
min res = 3.92, max res = 4.08
examples of things that may have a caused a result to be inaccurate
parallax error introduces random error (e.g viewer looking at scales from different angles)
systematic error (view consistently looks at scale from wrong angle)
zero error may introduce systematic error
what is zero error and how can we correct it
zero error is a systematic error that occurs when a measuring instrument does not display ecactly zero when no object is being measured. to correct it you should subtract or add the zero error.
why is a digital thermometer a better choice of a device than a glass thermometer to measure tempertature
a digital thermometer has a higher resolution leading to a measurement with a lower absolute uncertainty and therefore lower percentage uncertainty
a digital thermomemter also avoids parallax error
5 things to identify when criticisng a table of results
all data in a colum should be to the same number of deciaml places as the resoltuion of the instrument
all data that has been calculated from raw data should be to the same sf as raw data
repeats should be evident
range of independent variable should be high (and first in column and on x axis)
at least 6 sets of results should be taken
define directly proportional and describe its graphical appearance
two quantities are directly proportional if when one increases by a certain factor the other increases by the same factor. the graph would loook like a straight line going through the origin.
look at questions 28 onwards on doc