Ch 21: Confidence Intervals
1/19
There's no tags or description
Looks like no tags are added yet.
Name | Mastery | Learn | Test | Matching | Spaced | Call with Kai |
|---|
No analytics yet
Send a link to your students to track their progress
20 Terms
a number that describes the population
a statistic (sample)
a parameter (population)
goal of statistical inference
draw conclusions about a population based on sample data
what is the % of all employed men who have a college degree?
In a nationwide survey of n = 23,915 college seniors, 5,038 indicated plans to go to graduate or professional school. What is the sample statistic (p-hat)?
5,038/23,915 = 0.211 or 21.1%
margin of error
represents the range of values computed from our sample data by a process that is designed to capture the true population parameter in C% of all samples we could take
p (population parameter)
mean of the sampling distribution
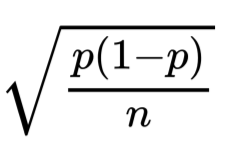
standard error
standard deviation of our sampling distribution since we are doing all of this in the context of estimation
why do we use p-hat instead of just p?
b/c p-hate is an estimate while we don’t know the actual value of p
confidence intervals are frequentist in nature
based on the idea of lots of repeated sampling
the confidence interval (ex. 95%) is a probability
the probability that the method we are using produces an interval that captures the true population parameter in 95% of repeated samples
confidence intervals are approximate
this is because the sampling distribution of p-hate is only approximately normal. it is also because we are using the sample estimate p-hat rather than the true population value [ to compute our standard error
z* or critical value
z-scores with percentiles, for every degree of confidence there is a corresponding z* value
when do critical values apply?
only when using the normal distribution
increasing the confidence level does what to the interval?
makes it wider
greater confidence leads to ______ precision
less (b/c wider interval)
means sample statistic
x-bar
true population mean
mew
central limit theorem
as sample size increases, the sampling distribution of the statistics becomes more and more like the normal distribution
confidence level is a _______________ that says how often in many, many observations the method would produce an interval that does catch the true parameter value
probability
the standard deviation of the sampling distribution of the statistic is called the ____________ ________
standard error
true or false. we can do the process of confidence interval estimation for both means and proportions