MACRO, Theme 2: The UK economy – performance and policies
1/105
There's no tags or description
Looks like no tags are added yet.
Name | Mastery | Learn | Test | Matching | Spaced | Call with Kai |
|---|
No analytics yet
Send a link to your students to track their progress
106 Terms
menu costs
when firms dont change prices bc it is costly to do so. (eg. have to re print all the menues)
what is economic growth. how is it measured, what graph shows a change in economic growth?
the rate of change of output. an increase in the long-term productive potential of the country which means there is an increase in the amount of goods and services that a country produces.
measured by the percentage change in real GDP per year.
show through the shift in PPF.
what does GDP measure and what does it allow us to do?
what is total GDP, GDP per captia, real GDP and nominal GDP
equation
GDP = standard measure of output, total value of goods and services produced in a country within a year. an indicator of the standard of living in a country so allows us to compare countries.
Total GDP = overall GDP of a country
per capita = total GDP/ number of people in a country. shows the value of ouput per person
nominal = the total value of all goods and services produced in a given time period, usually quarterly or annually. includes inflation effects. the value of national income. monetary cost of the basket of goods.
real = is nominal GDP adjusted of inflation. used to measure the actual growth of production without any distorting effects from inflation. the volume of national income, size of the basket of goods.
Value = volume x price
3 ways of measuring GDP
another national income measure
Output, expenditure, income. (they are all equal)
GNI (gross national income)/ GNP (gross national product)
value of goods and services produced by a country over a period of time plus net overseas interest payments + investments. (adds what a country earns overseas investments and subtracts what foreigners earn in a country).
how do we make comparisons about rates of growth between countries over time
use PPP exchange rates
national income level, shows grown or shrunk.
use PER CAPITA figures bc if population grows overtime this may cause a rise in GDP without rise in living standards. ALSO if countries have difference in population use PER CAPITA.
use REAL GDP to strip effect of inflation (rising numbers which give the effect GDP is growing).
data is compared to other similar countries over a set period of time to see if they have done well or not
the data can also make comparisons about economic welfare as growth in national income means a rise in living standards as economy is producing more goods + services so people have more access to more things.
what is Purchasing Power Parities (PPP)
USEFUL WHEN COMPARING COUNTRIES- it is an exchange rate of one currency for another which compares how much a typical basket of goods in one country costs compared to the other.
takes into account cost of living so helps compare living standards.
(provides an alternative to using exchange rates for a comparison of GDP)
low PPP = bad. high PPP = good.
limitation of using GDP to compare living standards
inaccuracy of data. some countries are inefficient at collecting data, different countries use different methods of calculating GDP, errors calculating inflation rate means real GDP might be inaccurate, there is a black market (varys between countries) which people don’t declare their income from to avoid tax, GDP doesn’t count home-produced services like housewives or consuming own crops, transfer payments not taken into account like pocket money.
inequalities. an increase of GDP may be due to the growth of income of just one group of people meaning living standards didn’t increase everywhere like the data suggests.
quality of goods and services. quality isn’t always reflected in the real price so living standards may have increased more than GDP would sugest as the quality has improved.
technology. may have allowed prices to fall sugesting a fall in living standards but this is not the case.
currency issues when comparing. usually converted to US dollars but people say just use PPP.
spending. will not increase the standard of living but will increase GDP so makes comparisons difficult as spending varies.
many other factors help standard of living not just money, eg. education, NHS
…therefore comparisons using GDP can be less effective.
what are the 6 factors effecting welfare + national happiness. which organisation found these factors.
UN happiness report:
percieved freedom (to make choices + from corrupion)
generosity
life expectancy
real GDP per capita
health
having someone to count on
(Promoting Good Literacy + Reading in Happy Homes)
tell me about UK national wellbeing, the report and what it found
in 2010, UK prime minister launched Measuring National Wellbeing report.
found health, relationship status + employment status things that most effect well-being (HER)
people answered 4 questions about their well-being on a scale of 0-10.
in 2012-2016, life satisfaction +| happiness continuted to rise whilst anxiey began to slowly rise- this could be due to concerns over global security
what is the link between real incomes + subjective happiness. is there a link?
the EASTERLIN PARADOX (psychological research) has found that happiness + income are positively related at low incomes (if poor and income increases u will be happier)
high levels of income are not associated with happiness (rich people aren’t necessarily happy)
if basic needs aren’t met (eg. no food/shelter) then these items will increase happiness, but once these needs are met, a increase in consumption wont increase long term happiness.
what is inflation- current rate? what was its peak
a sustained increase in general price level over a given period of time.
current rate- 2.3%
peak- 11.1% in october
deflation definition
a sustained period when the general price level for goods and services is falling. This means that a weighted basket of goods and services is becoming less expensive over time.
disinflation definition
a reduction in the rate of inflation. eg. prices are still rising but not rising by as much.
what is the process of calculating the rate of inflation in the UK using the Consumer Prices Index (CPI)
(new figure/base figure) x100
what is the consumers price index (CPI)
INDICATOR OF INFLATION aims to measure the change in price of a basket of goods by household.
can tell us which items have a bigger impact on the rate of inflation
the ONS (office for National Price Statistics) collects prices on 650 goods + services from 20,000 shops, and the prices are updated monthly. new items such as nail varnish are added to the list every year, whilst others are taken off.
the average household spending is calculated using the living cost and food survey where around 5,500 families keep a diary of what they spend over a fortnight.
using these prices + the average household spending pattern, an overall price index is produced.
it takes into account how much is spent on each item so they are weighted (eg. we spend more on petrol so it will have a bigger impact on the rate of inflation.
CPI is rising it means that consumer prices are also rising so a higher CPI indicates higher inflation.
limitations of CPI
not totally representative. different households spend different amounts on each good, very generalised- only measures average rate of infaltion.
doesn’t include price of housing. this tends to rise more than most goods so data may be lower than it should be.
has only been used since 1996 so hard to make historical comparisons with
BUT
some people say that it overestimates inflation as it omits the fact that goods will inevitably be more expensive as quality has improved over time.
other than the CPI, what is a alternative way to measure the rate of inflation. explain the difference between the two. which is considered better?
RPI, retail price index
RPI includes housing costs (eg. mortage + interest payments), CPI does not
RPI excludes the top 4% of income earners as they are not the ‘average’ household- CPI includes all
CPI takes into account that when prices rise people switch to a product that has gone up by less so CPI is generally lower than RPI
CPI is the best method. RPI has had its national statistic status removed BUT the office for national statistics still calculates it every month
what are the 3 causes of inflation
DEMAND PULL
when there is an increase in aggregate demand for goods and services, but the supply of those goods and services cannot keep up with the demand. This results in an increase in prices. therefore any factor that increases demand, would increase inflation.
COST PUSH
also known as wage-push inflation, occurs when overall prices increase due to increases in the cost of wages and raw materials. Higher costs of production can decrease the aggregate supply, resulting in inflation- an increase in prices.
GROWTH OF THE MONEY SUPPLY
If the money supply grows faster than overall economic growth, inflation will occur eg. printing too much money- Germany 1923. bc people have access to more money so they will want to spend it but there is no increase in goods so prices rise. the value of the currency decreases.
MV = PT. M is money supply, V speed of money circulating in the economy, P is price level and T is the number of transactions- an increase in money supply will lead to an increase in price level; ceteris paribus.
the effect of inflation on consumers
if peoples wages do not rise as well, then they will have less money to spend which could lead to a fall in living standards
can pay off debt at a price which is a cheaper value.
people who are owed money lose because the money they get back is of cheaper value.
pensioners + savers lose as their money is worth less
the effect of inflation/deflation on firms
if UK inflation is higher than other countries, UK goods will be more expensive so will become less competitive. means less exports + will affect BOP
difficult to predict so firms cannot plan for the future
expensive. changing prices means that firms need to redo labels, incur menu costs ect.
DEFLATION causes people to stop purchasing as they wait for the prices to fall further, this leads to a fall in demand, decreasing firms profits.
the effect of inflation on government
pressure to raise the value of state benefits for people
fiscal drag, people wages increase with inflation but the tax boundaries stay the same so people are dragged into higher tax brackets + pay more.
reduce’s value of govs debt, easier to pay off
the effect of inflation/deflation on workers
fiscal drag, people's wages increase with inflation but the tax boundaries stay the same so people are dragged into higher tax brackets + pay more.
if they don't receive a wage increase they are worse off + living standards will decrease.
DEFLATION, bc people are waiting for prices to fall further + there is a lack of demand, some people might loose their job
what is indexation
wages or taxes are increased in line with inflation, this reduces the cost of inflation. eg. workers negotiating with employers for wage rises in line with the predicted CPI or RPI.
BUT makes it difficult to reduce inflation to say 2% if workers are still getting a 10% raise.
what are the 2 measures of unemployment
Claimant count = the number of claimants (people) receiving benefits for being unemployed each month. also the number of people joining + leaving each month.
International Labour Organisation and UK Labour Force Survey.
UK labour force survey is a survey carried out quarterly on 44 000 households which is uses the sample measured to estimate the true level of unemployment.
uses the ILO’s definition of unemployment = anyone over 16, who is out of work but is willing and able to work, has actively sought work in the last 4 weeks and is able to start a job within the next 2 weeks.
ILO considers employed as anyone doing more than 1 hour of paid work a week, does a minimum of 15 hours of unpaid work for their family or is on a gov supported training scheeme.
comparison of the claimant count and labour force survey as a measure of unemployment. why might both underestimate the figure?
people working in the hidden economy (eg. black market) and fraudulently claiming benefits would not be in the LFS but would be in the CC
people who are unemployed but not eligible to claim benefits like if their partner is working or they are full time studying would not be in the LFS but would be in CC
LFS is only a sample, CC is a specific number
CC doesn’t show people looking for work
BUT both don’t show the hidden unemployed:
sick or disabled
on gov training schemes but would like to work full time
working part time but like to work full time
in education but want a job alongside
so both underestimate the unemployment figure.
define underemployment. is it included in unemployment statistics? what happens to underemployment in recessions? why is underemployment bad?
those who are in part time or zero hour contracts when they would PREFER to be in full time.
people who are self-employed but would rather be employees.
those who are in jobs that don’t reflect their skill level eg. uni grad is a bartender
IT IS NOT included in unemployment stats.
in recessions it tends to INCREASE as firms will just reduce staff hours to cut costs.
it is bad bc they have lower incomes so will spend less, reducing aggregate demand + growth in the economy.
what is the employment/unemployment rate
EMPLOYMENT= the percentage of the population of working age who are employed
UNEMPLOYMENT = the percentage of the economically active who are unemployed
what is the activity/participation rate? what is the inactivity rate?
ACTIVE = the percentage of the population of the working age who are economically active (employed).
INACTIVE = the percentage of the population of the working age who are inactive (unemployed)
what are 5 types of unemployment
frictional unemployment , people moving between jobs, take time to locate and gain a new job, short term so not a big issue
structural unemployment, 3 types →
1. regional unemployment, where certain geographical areas suffer from low levels of unemployment due to industry closing, big issue as long term
2. sectoral unemployment, long-term decline in demand in an specific sector of a industry so reduced employment eg. coal miners, long term
3. technological unemployment, a improvement in technology means jobs are replaced.
seasonal unemployment, some employment like tourism, fruit picking or ski instructing is strongly in demand in certain seasons but once that time has passed the labour force is reduced. there is little that can be done to prevent this.
cyclical unemployment or Keynesian ‘demand deficiency’, unemployment caused by a decrease in demand for goods and services, forcing companies to lay or workers to cut costs.
real wage inflexibility, when wages are too high leading to some workers being prepared to work for less than the minimum wage, eg. international competition for low-labour costs, this is illegal and means unemployed workers cannot get a job. BUT there is little evidence for this
how does migration impact employment
it changes the supply of labour.
+ may fill labour gaps, usually take on lower-skilled jobs, due to the circular flow of income immigrants’ spending creates jobs and so total employment increases.
- leads to wage pressures, lower wages particularly for low skilled jobs as employers are able to recruit workers for a lower price (supply has increased so price decreases), increased competition for jobs → UK workers may be competing with more skilled and harder working people. BUT impact of this is small and middle + high income wages are rarely affected
effect of skills on employment
economies progress over time so higher skills are needed to work them. eg. 50 years ago many jobs were available for people that couldn’t read or write but now there are very few.
structural unemployment is caused by lack of/ the wrong skills, people with a lack of skills can become long-term unemployed and the gov has to step in and help which is costly.
migrant workers may fill these shortages if their skills fit
the effect of unemployment on consumers
reduced income, lower consumer spending
less choice as some shops have to close down
quality of goods might decrease
BUT firms might lower their prices and put on sales to try to increase spending
the effect of unemployment on firms
high unemployment leads to a large labour pool BUT long term unemployment means workers have lost their skills and become less employable so there is a smaller pool of SKILLED workers.
decrease in consumer spending and demand for goods so fall in profit
the effect of unemployment on workers
reduced income leads to less disposable income and a decline in living standards.
suffer from the stigma of being unemployed, can lead to bad mental health, mental breakdown even suicide
long term unemployed (more than 12 months) find it more difficult to get another job as they have lost their skills
employed people might suffer find a fall in wages and they can easily be replaced by unemployed people willing to work for less
the effect of unemployment on the government
increased spending on benefits, fall in tax revenue from income tax so might have to increase borrowing or cut spending on public goods like NHS or education
incur an opportunity cost as the money could have been better spent else where
increase spending on benefits + retraining/ skilling workers
the effect of unemployment on society
social deprivation (reduced wellbeing, increased divorce rates, worse health, lower life expectancy, increased crime + violence)
loss of potential national output, damages countries growth, not on your PPF, negative effect on LRAS
income inequality
what is the balance of payments - BOP. what are its 2 components.
a record of all economic transactions between a country and the rest of the world. imports are when goods/services come in, so money goes out (negative sign). exports are when goods/services go out, so money comes in (positive sign).
2 components;
current account - records payments and the value of export and imports.
capital and financial account - records flows of money associated with saving and investment.
what is the current account. explain its 4 different parts.
trade in goods. VISIBLES. you can see them, goods that are traded eg. cars, clothing, coal. the difference between visible exports + visible imports is the balance of trade.
trade in services. INVISIBLES. all services traded in or out of the country eg. holiday of British fam to Spain is import (-), US firm buying from UK firm is export (+).
income. from profits, interest, dividents → includes earnings from abroad and payments made from foreign investors.
transfers. the movement of funds where there is no trade in goods/services. eg. migrants send money to their families abroad or foreign aid
what is a current account deficit and what is a current account surplus. (these are current account imbalances)
DEFICIT = when imports are greater than exports, so current balance is negative. a country is spending more than it is earning internationally. eg. US often has a current account deficit as it imports more than it exports.
SURPLUS = when exports are greater than imports, so current balance is positive. a country is earning more than it is spending internationally. eg. Germany usually has a current account surplus due to its strong export-oriented economy
impact of current account imbalances (deficit or surplus) on exchange rates, growth, employment and inflation
exchange rates → a deficit may lead to depreciation of the country's currency, making exports more competitive and imports more expensive, this can help correct the deficit
economic growth → govs want export led growth meansing a surplus as it can lead to higher savings and investment, boosting economic growth BUT this can lead to inflation. BUT, a deficit can lead to unsustainable borrowing
employment → a surplus may support job creation in export-oriented industries, while a deficit can lead to job losses in internationally competing sectors
inflation → a deficit, leads to a depreciating currency so leads to imported inflation, affecting the domestic price level
how does international trade effect the interconnectedness of economies
fosters interdependence among countries, one countri’s policies/ economic decisions can affect all countries eg. 2008 financial started in US but ended up affecting all countries (they stopped importing from other countries as they couln’’t afford it)
increasing migration between countries
more technology sharing
supply chains, products involve components from multiple countries, disruptions in one country can affect the whole supply chain. eg. covid disrupted supply chains worldwide
countries can specialise in producing what they are best at, more efficient so cheaper prices and better quality products.
what is AD and what is it made up of (it’s components)
aggregate demand (AD) is the total amount of goods and services demanded in the economy at a given time and price level.
AD = C + I + G + (X-M)
C- consumption. consumer spending on goods + services, 60% of AD.
I- investment. spending by businesses on capital goods (buildings, technology) 15-20% of AD. BUT this number changes a lot due to uncertainty and lack of confidence from firms
G- government spending. gov providing goods and services; wages of public sector workers, roads, schools, NHS, benefits eg. 18-20% of AD
(X-M)- exports - imports. UK has large trade deficit (imports greater than exports) 5% of AD.
explain the AD curve + its direction of slope
same as a demand curve but instead of showing the relationship between price + output, it shows the relationship between price level and real GDP.
DOWNWARD SLOPING- indicating that as prices rise (inflation), real GDP falls. this is due to:
income effect: a rise in prices is not instantly matched with a rise in income so people can afford less, leading to less demand.
substitution effect: if prices in UK rise, foreigners don’t buy British goods + UK residents buy imported cheaper goods so net exports decrease + AD contracts
real balance effect: the amount people have saved up will be worth less + offer less security so they will want to save me and reduce spending → contraction in AD
explain movement along the AD and shifts of the AD
movement:
when there is a change in the price level (caused by inflation or deflation) while other factors affecting AD remain constant; a change in P leads to a change in the quantity of Real GDP demanded so there is movement along the curve.
eg. if prices rise (inflation increases) there will be a decrease in real GDP resulting in movement up the AD curve.
shift in entire AD curve:
when factors other than the price level change, for example changes in consumer spending, business investment, government spending, or net exports.
eg. If the government increases its spending on infrastructure projects, it will shift the AD curve to the right, leading to higher Real GDP and potential inflation.
It is important to always look at whether the change is because of price or not.
what is disposable income and its influence on consumer spending (explained by MCP)
the money consumers have left to spend after taxes have been taken away and any state benefits have been added
it is the most important factor in determining the level of consumption- generally as disposable income increases, consumer spending increases. this is explained by MPC (marginal propensity to consume) which measures the degree to which a consumer will spend for every additional dollar eg. MPC is 0.8 then for every additional dollar of disposable income the consumer will spend 80p and save 20p.
do poorer people have a higher or lower MPC
poorer people are more likely to have a higher MPC as they are more likely to spend more of their increased income than richer people who are more likely to save it
the relationship between savings and consumption. include real world example.
savings is what is not spend out of income. INVERSE relationship between savings + consumption → a increase in consumption means a decrease in savings (as will anything that increases consumption eg. a rise in confidence).
eg. during 1920’s economic boom people felt more stable so could reduce their savings and increase spending on luxury items
explain how interest rates influence consumer spending
Lower interest rates increase consumer spending because borrowing costs are reduced. eg. when mortgage interest rates are low, more people may buy homes.
Higher interest rates decrease consumer spending because borrowing is more expensive.
how does consumer confidence influence consumer spending
consumer confidence = what they think will happen in the future
Higher consumer confidence will increase consumer spending, as people are more willing to make major purchases when they believe the economy is doing well. eg. if the economy is booming people will spend more.
lower consumer confidence will decrease consumer spending, as people are scared to make major purchases because people will want to save eg. if the economy is in recession.
explain how wealth effects influence consumer spending
the wealth effect is when the value of assets such as homes or stocks increase so consumers feel wealthier and spend more.
eg. During the housing market bubble in 2007 + 2008 rising home prices made many homeowners feel wealthier. This increase in perceived wealth contributed to higher consumer spending
what is gross investment? what is net investment? what is the difference between them + how much is UK depreciation?
GROSS = the amount of investment carried out over a specific time period and ignores the level of depreciation
NET = is gross investment minus depreciation (the wear and tear on existing capital).
UK depreciation accounts for about 75% of gross investment.
READ- for example, If a company spends $100,000 on new machinery (gross investment) but $20,000 of their existing machinery wears out (depreciation), their net investment is $80,000.
what are 7 influences on investment and explain them
the rate of economic growth (when economy is growing, businesses are more likely to invest in new capital to meet increased demand. when economy is facing a downturn, investment tends to decline)
business expectations and confidence (positive expectations + confidence encourages investment, negative discourages investment)
Keynes and ‘animal spirits’ (refers to the emotional factors that can influence investment decisions even when analysts might suggest otherwise- eg. confidence, fairness, optimism, fear ect.
demand for exports (Strong demand for a country's exports can boost investment- they might invest in expanding production, especially in export-oriented industries)
interest rates (Low interest rates reduce the cost of borrowing for businesses, so investment projects are more attractive, high interest rates discourage investment due to increased borrowing costs)
access to credit (availability of credit, including loans and lines of credit, can impact a firm's ability to finance investment projects)
the influence of gov and regulations (Government policies, such as tax incentives and subsidies for investment, encourage businesses to invest. Regulations can affect the ease of investing.)
what are the 3 main influences on government expenditure
TRADE CYCLE
decisions are made to regulate the trade cycle → in a recession the gov will increase spending to increase demand to reduce unemployment and they will spend more on unemployment benefits ect. in a boom the gov may decrease spending to decrease demand and reduce inflation
FISCAL POLICY
the govs fiscal policy will tell us the decisions they have made on spending and taxes for the year
AGE OF POPULATION
if the population is a higher age then the gov might spend more on pensions + social care but if they are a appealing to a younger population they might increase spending on education. depends on the country
what are the 5 main influences on the net trade balance (total exports - total imports)
real income (high= more imports as people demand more but UK is unable to meet demands so net trade decreases. BUT if increase in income is due to export led growth, then net trade will increase.)
exchange rates (strong pounds makes imports cheap so they will increase and exports decrease bc there expensive for foreigners so net trade will decrease. BUT depends on elasiticity of product….)
state of the world economy (if other countries get richer then exports will increase so net trade will increase. if other countreis we export to get poorer then exports will decrease and net trade will decrease.)
degree of protectionism- trys to prevent domestic producers from compeition abroad (tarriffs and quoats from other countries on UK make it harder to export and if there is high protectionism on imports into UK they will decrease so net trade will increase. )
non-price factors (eg. quality and marketing. if UK goods have higher quality + marketing then exports will increase and imports will decrease as people buy UK goods so net trade will increase.)
what is AS, what does SRAS look like and what does it show. why is the curve upward sloping.
Aggregate supply
the volume of goods and services supplied within the economy at a given price level.
shows the relationship between real GDP and average price levels. so as price level increases, total as the price level increases and you move along the SRAS, the amount of real GDP that will be produced in an economy increases.
upward sloping bc firms are willing to supply more, but only at a higher price.
explain movement along the AS and shifts of the AS
movement:
a change in price level will lead to a movement along the curve (expansion or contraction)
a rise in price level (usually caused by increased AD), leads to expansion of AS so moves you up the AS curve
a fall in price level (usually caused by decreased AD) leads to a contraction of AS so moves you down the AS curve
shifts:
caused by other factors, depends weather long run or short run
a increase in SRAS is show by shift right
a decrease in SRAS is shown by shift left
increase in COST of production is shown by shift left
decrease in COST of production is shown by shift right
difference between SRAS and LRAS
SR- at least one factor of production is fixed (eg. wage rates, state of technology, prices of factors of production are FIXED bc they cant be increases in a short amount of time; a change in one of these would result in a shift of the curve.
LR- all factors of production are variable and can be increased over time.
factors affecting short-run AS
A CHANGE IN THE COST OF PRODUCTION which is caused by:
changes in the cost of materials- raw, energy, technology, a increase in the cost of these would increase the cost of production meaning SRAS shifts left as it costs more to make the same amount of goods. a decrease in cost would decrease cost of production meaning SRAS shifts right as you can produce more for cheaper.
changes in exchange rates- a weaker pound leads to increase in price of imports so production is expensive, SRAS decreases and shifts left. stronger pound means imports are cheaper so SRAS increases and shifts right.
changes in tax/subsidy rates- tax increases increase the cost of production decreasing SRAS so it shifts left. subsidies decrease cost of production so increase SRAS and shift it right.
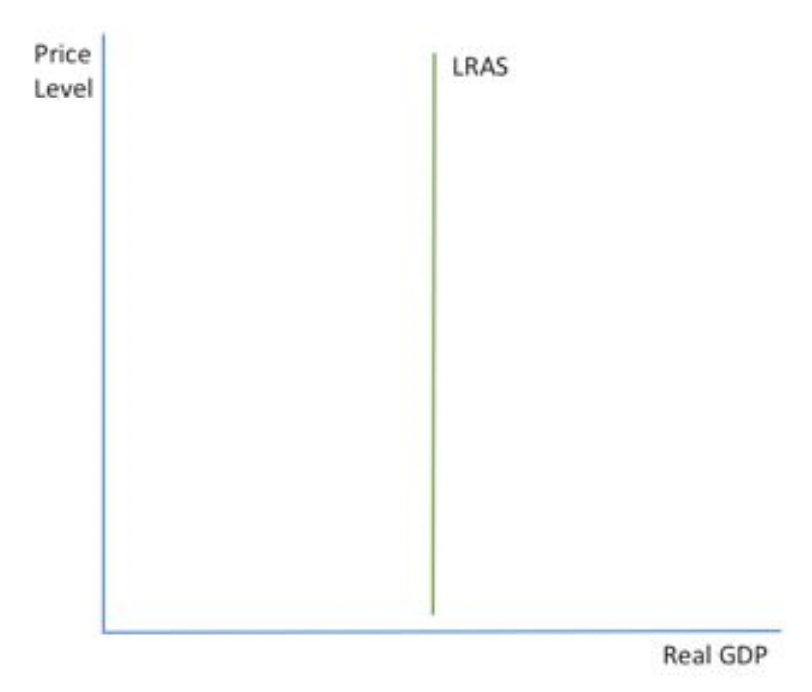
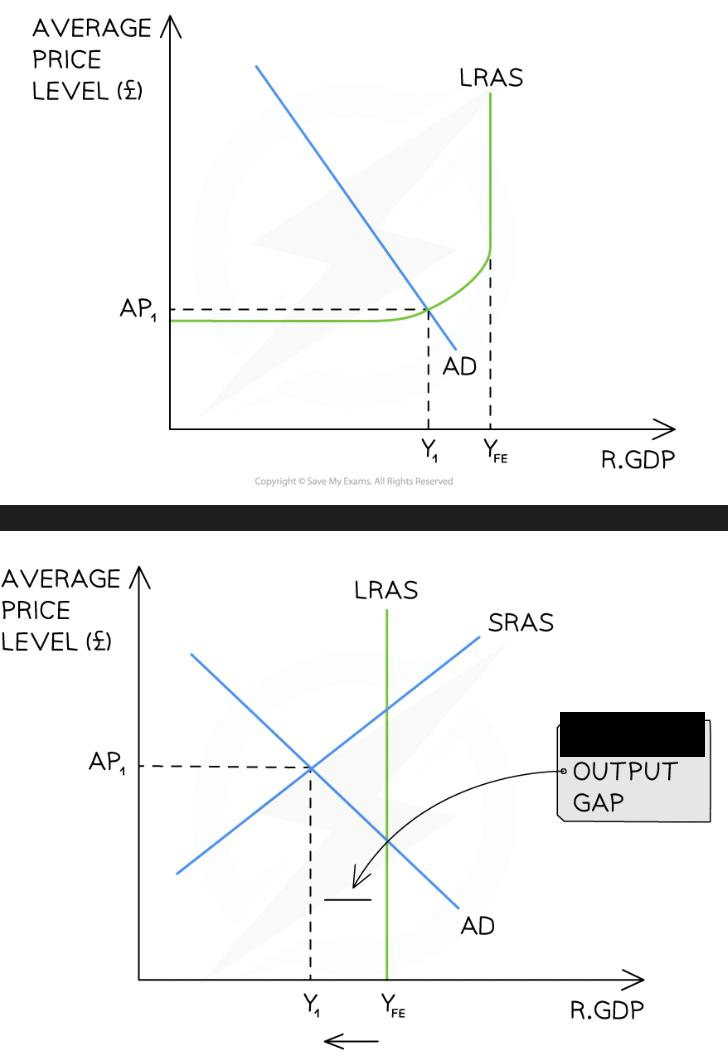
explain the classical shape of the LRAS curve and what it shows (draw it)
shows that in the long run, AS is independent of the price level and is determined by the factors of production. it is a measure of a country's potential output (similar to a PPF) and shows the productive potential of the economy; shows the full capacity output i.e. where all resources are being fully utilised.
SHAPE- vertical AS based on view that markets tend to correct themselves fairly quickly, it will naturally move towards equilibrium position where all resources are using and economy is producing on its PPF. LRAS IS VERTICAL
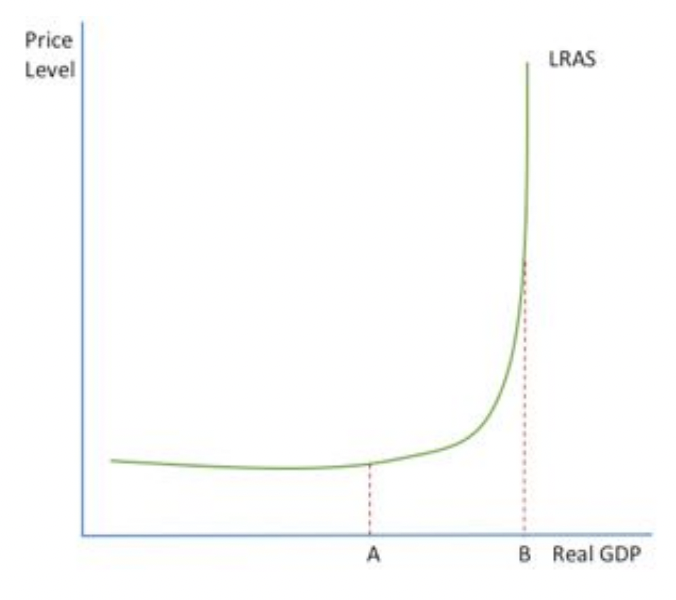
explain the Keynesian shape of the LRAS curve and what it shows (draw it)
Keynsian’s do not think markets work efficiently therefore elasticity varies along the LRAS curve.
As output increases, resources become more scarce and so firms compete for them pushing the prices up and up. these costs are passed onto consumers in high prices.
eg. employment as a resource. at point A when the curve is vertical there is high unemployment and firms want to hier people, between A and B as employment rises there are less people looking for jobs and they are becoming scarce so firms have to offer high wages to attract people, these high wages are passed on to consumers in high price levels.
at B, price no longer affects output as everyone is employed (full employment) and all resources are being used efficiently, PPF has been reached.
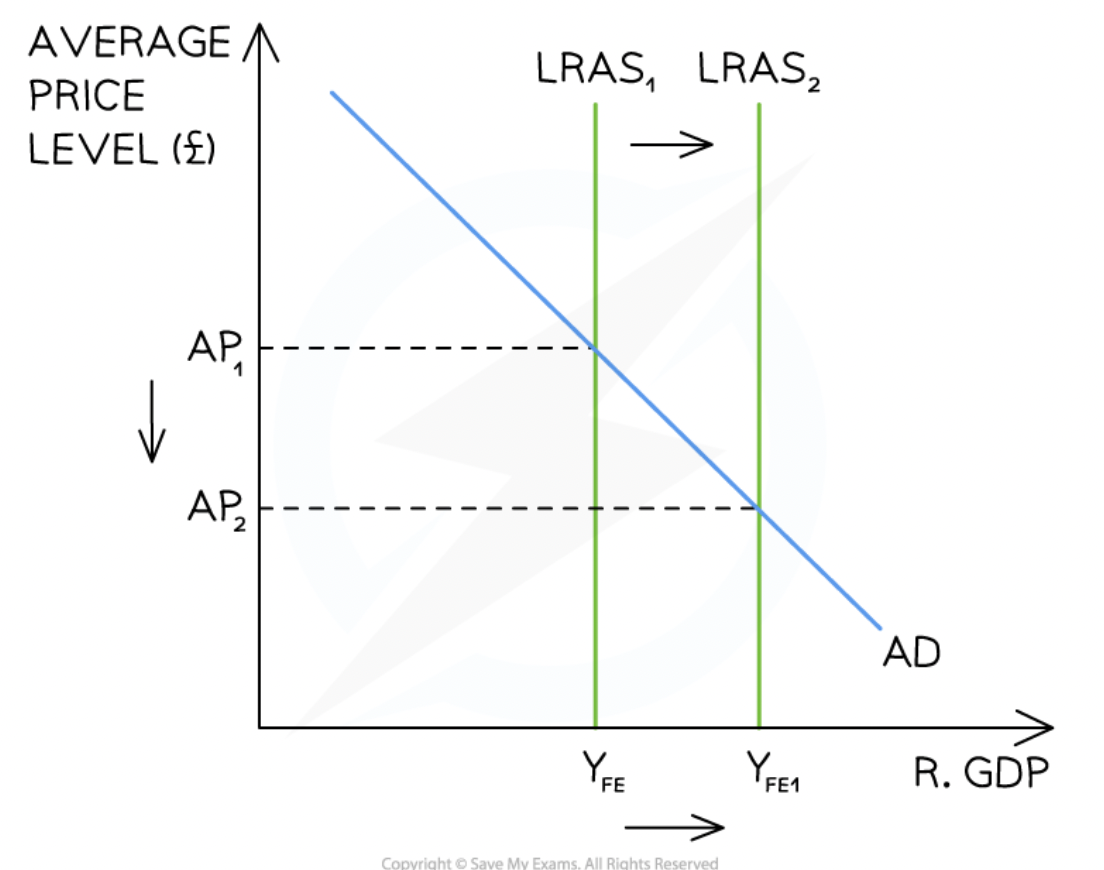
shifting LRAS → how and what does each shift mean
RIGHT- increase in LRAS, economies are able to produce more, same as outward shift in PPF
LEFT- decrease in LRAS, economies producing less, inwards shift of PPF
HOW- increase productivity so more goods can be produced. OR increase the quality and quantity of the 4 factors of production (land, labour, capital, entreprenureship)
6 factors effecting LRAS
technological advances - improvements increase LRAS so shift it right, speeds up production makes it more efficient, acts a investment as it is long term
changes in relative productivity - more productive (increased efficiency, skill, labour, technology) means more produced so increase in LRAS and shift right.
changes in education and skills - more skilled workforce means more efficiant so output per worker increase shifting LRAS right.
changes in government regulations - high regulation will increase costs and time to do tasks in buisnesses so reduce ouput and shift LRAS left eg. can increase working age so increase size of workforce and shift LRAS right. OR lower corporation tax to increase incentives to be an entrepreneur which would increase jobs and therefore shift LRAS right.
demographic changes and migration - if immigration > emmigration, population will grow so more workers so LRAS shifts right. more skilled, educated, younger immigrants shifts LRAS right.
competition policy - gov can promote competition between businesses which forces them to improve quality, efficiency and lower prices which means LRAS will increase + shift right.
VICA VERSA (opposite for all of them eg. decrease in productivity is decrease in LRAS so shift left)
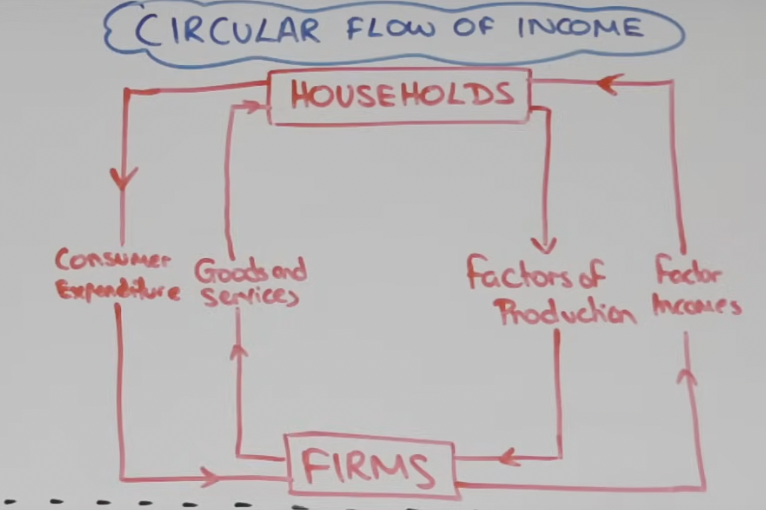
what is the circular flow of income model, explain and draw it, what are 3 ways of measuring it
a economic model that shows how money moves from producers to consumers and back again in a endless loop. shows us how we can look at economic growth and how we can measure economic growht (GDP)
Households provide their 4 factors of production to firms (land, labour, capital + enterprise) firms combine these and make goods + services out of them. households are rewarded with factor incomes (rent, wages, interest and profits) which they use to buy goods and services (consumer expenditure)
in this model there are 3 ways of measuring economic activity-
the national output (value of goods + services flow to households and firms)
the national expenditure (value of spending by housholds on goods + services)
the national income (value of income paid by firms to household for the 4 factors of production)
they all equal eachother; national output = national expenditure = national income
BUT VERY SIMPLIFIED the money does not just stay like this there are INJECTIONS and WITHDRAWALS
injections and withdrawls what are they and name the 3 for each.
the economy is growing if the sum of … is greater than the sum of …
the economy is shrinking if the sum of … is greater than the sum of …
explain injections + withdrawels when the economy is in equilibrium
ADDITIONS TO THE ECONOMY (going in)
G → gov spending
I → investment
X → exports
LEAKAGES FROM ECONOMY (money is removed)
M → imports
T → taxes
S → savings
injections, withdrawals
withdrawals, injections
IN EQUILIBRIUM = injections must be equal to withdrawals so the national income remains the same
difference between income + wealth
WEATH = stock of assets. things people own eg. houses, possessions
INCOME = a flow. the money they receive eg. wages, interest, savings.
explain the concept of equilibrium real national output (short term)
real national output equilibrium occurs where the AD curve intersects with the AS curve. both classical and keynsian economists agree that in short run AD is downwards sloping and AS is upward sloping. if either AD or AS shifts, the equilibrium position will also shift.
explain the concept of equilibrium real national output (long term). how a change in AD effects the equilibrium price level and real national output.
Classical and Keynesian economists have different views on long run equilibrium of national output bc classical’s think that the economy will always return to it’s full potential and keynesian’s believe that the economy can be in long-run equilibrium at any level of output.
THEY HAVE DIFFERENT VEWIS OF LRAS THEREFORE DIFFERENT EQUILIBRIUM VIEWS.
A increase of AD in the Classical model will always increase the average price level and a decrease of AD will decrease price level. BUT a change to AD in the Keynesian model may not change the price level at all bc LRAS curve is elastic.
what is the multiplier effect, how is the size of it determined, what happens to the AD curve
EFFECT- occurs when an initial injection into the circular flow causes a bigger final increase in real national income.
works due to circular flow, the idea that one individual's spending is another individual's income- eg. if gov spends £100m to create jobs, £90m is spent by those who have the jobs and £80m is spend by those who recivied the £90m. the MPC here is 0.9 and the multiplier is 10.
THE SIZE of the multiplier will be determined by how much of an increase in income people will spend, the marginal propensity to consume (MPC). The lower the leakages, the higher the MPC, the bigger the multiplier. BUT it is impossible to know the exact size of the multiplier, cant know exact effect of spending.
The initial injection shifts AD to the right. The result of the multiplier process is that there is then a secondary movement of AD to the right which (if the multiplier were 2) may be double the initial movement.
explain the negative multiplier effect
when a withdrawal from the economy (or injections are reduced) leads to a further fall in income, decreasing economic growth. eg. gov plans to cut spending leads to a further decrease in the economy.
explain the effects of the multiplier on the economy
means growth can occur quicker, any injections lead to a bigger increase in national income. injections can be targeted at things with the biggest MPC to increase the size of the multiplier. eg. gov could give more money to people with the highest MPC→ those on low incomes
time lag between increase in income and full effect as not everyone will spend straightaway, it may take up to 18 months for the full multiplier effect to be seen
depend on change in AS and elasticity of AS
name the 4 marginal propensities and their effect on the multiplier (also what is MPW)
MPC- marginal propensity to consume, the proportion of additional income that is spent. any factor that affects consumption will affect the MPC eg. change in interest rates
MPS- marginal propensity to save, the proportion of additional income that is saved. a increase in people saving will decrease MPC therefore decreasing the multiplier.
MPT- marginal propensity to tax, the proportion of additional income that is paid in tax. an increase in tax will decrease MPC (ceteris paribus) therefore decreasing the multiplier.
MPM- marginal propensity to import, the proportion of additional income due to imports. *******
MPW- marginal propensity to withdraw (MPM+MPT+MPS) the proportion of additional income that is leaked/ taken out of the circular flow
what are the 3 ways to calculate the multiplier
1/(1-MPC)
1/MPW = 1/(MPM+MPT+MPS)
Final change in real GDP / Initial change.
to find the increase in national income take the multiplier and times it by the original injection. eg. multiplier is 10 and gov spending is £50,000 increase in NI is 50,000 × 10 = £500,000
using method 3. If the government increased spending by £5 billion but this caused real GDP to increase by a total of £12 billion, then the multiplier would have a value of 12/5 = 2.4
what is the significance of the multiplier in shifting AD
the multiplier will have a big effect when there is plenty of spare capacity in the economy (can’t be at full output), when the AS curve is more elastic- SRAS.
for LRAS, it is perfectly inelastic (classical veiw) so the only impact of the multiplier will be to increase price, it will not effect output.
4 factors of production which cause economic growth
anything that increases the quantity or quality or efficiency of one of the 4 factors of production
LAND: finding new resources (oil eg. Saudi Arabia grew almost purely to the discovery of oil)
LABOUR: size of the workforce; increases in quantity (immigration, participation rates, raising retirement age, providing free childcare so mothers can work) and increases in quality (more educated + skilled workforce, technology use ect.)
CAPITAL: capital goods or man-made resources like tools + infrastructure that are used in production of goods and services
ENTREPRENEURSHIP: they create jobs and establish innovate ideas, technologies, products + services which increase growth.
anything that increases LRAS will increase the potential level of output for an economy therefore increasing economic growth
difference between actual and potential growth
ACTUAL- the percentage change in GDP, when there is an increase in the quantity of goods and services produced in a economy in a given time.
POTENTIAL- the increase in an economy's productive potential, shown by a outwards shift on the PPF or LRAS curve. the factors of production determine productive potential so potential growth means for example that new resources or labour has been found so we can potentially grow.
the importance of international trade for export-led economic growth
export-led growth is growth as a result of a increase in the sale of goods + services to other countries. it is a important source of income and increases AD. Effective bc it prevents the poor BOP that usually occurs due to economic growth.
what are actual growth rates and long term trends in growth rates. what does the difference between them show
long-term trend of growth rate is the average sustainable rate of economic growth over a period of time, or the ‘underlying trend rate’. determined by AS (productive capacity)
actual growth is the actual change (change in GDP) over time.
the difference between them shows an output gap.
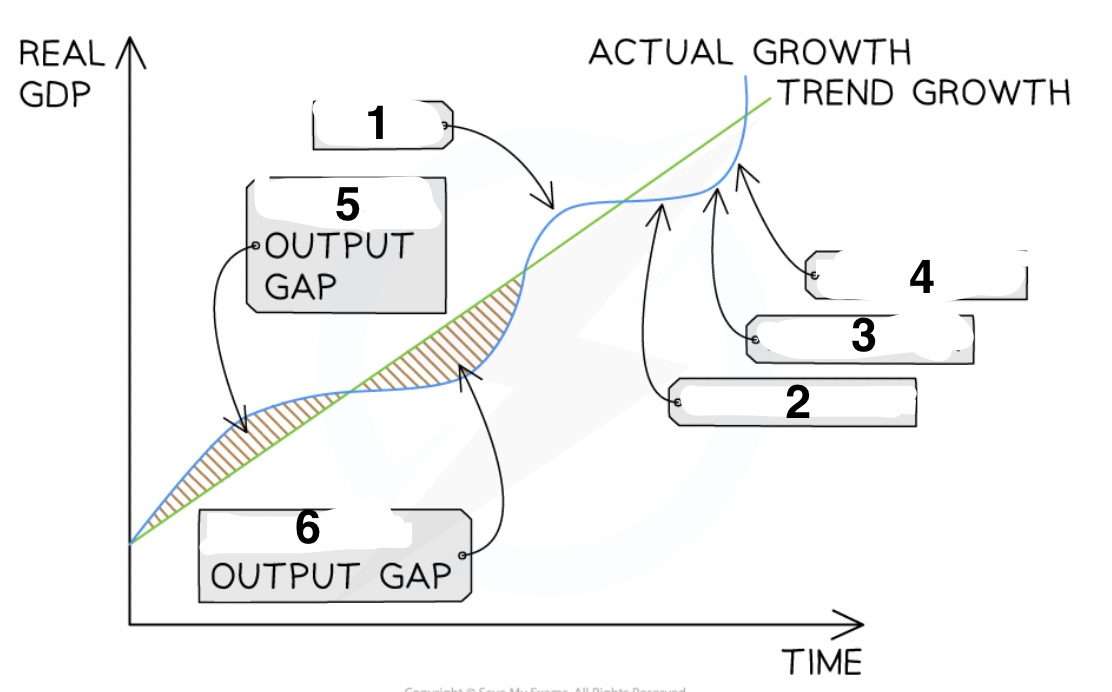
explain output gaps. how are they calculated, what are they 2 different types and the difficulties of measurement?
the difference between the actual level of GDP and the estimated/potential long-term value for GDP. shown on LRAS graphs.
a positive output gap occurs when real GDP is higher than estimated/potential GDP
a negative output gap occurs when real GDP is lower than estimated/potential GDP
→ there is spare capacity in the economy eg. factories and workers to produce more goods and services
difficult to measure because…
the exact position of LRAS is unknown
initial estimates of real GDP are often inaccurate
some economists argue that it’s not possible to measure the productive potential of an economy.
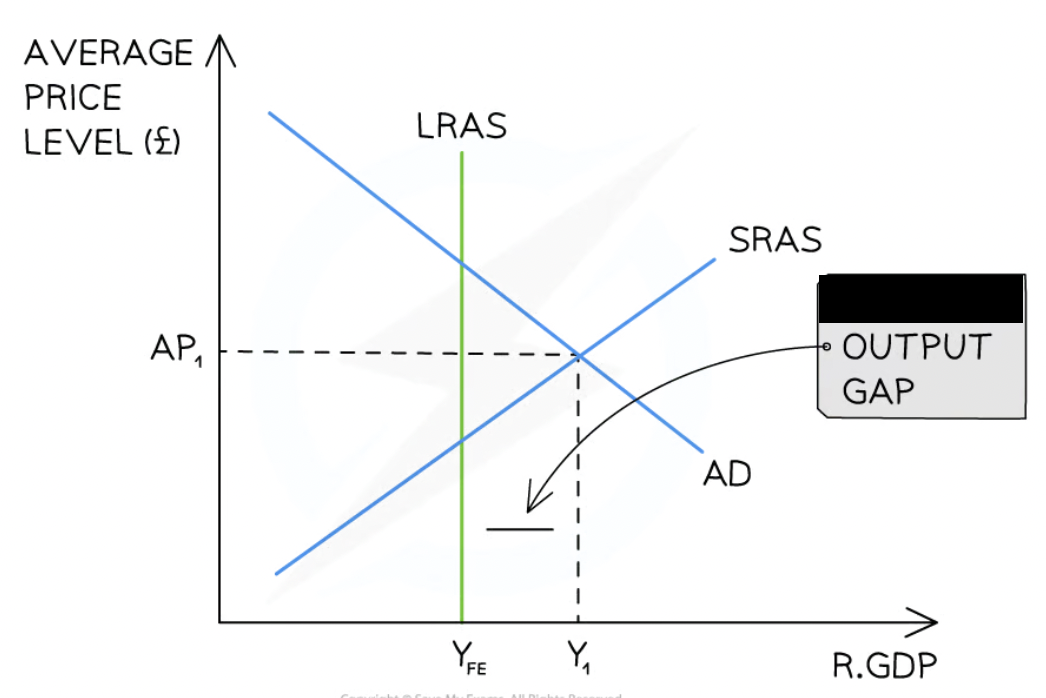
does this graph show a negative or positive output gap?
positive, The potential output of this economy is at YFE, the positive output gap exists at YFE - Y1. real GDP is higher than estimated/potential GDP
does this graph show a negative or positive output gap?
negative, the potential output of this economy is at YFE. the negative output gap exists at Y1 - YFE. real GDP is lower than estimated/potential GDP
The Classical view is that the output will return to YFE in the long-run, but at a lower average price level
The Keynesian view is that an economy may be stuck in a negative output gap for a long period of time
what is the trade cycle. explain the 4 points
the changes in real GDP (actual growth) that occur in an economy over time. The real GDP will fluctuate above and below the long-term trend rate of growth.
positive output gap is the growth of real GDP above the trend
negative output gap is the growth of real GDP below the trend
often natural cycle through these stages BUT this flow can be moderated by gov intervention eg. increasing taxes in boom and increasing spending in recession
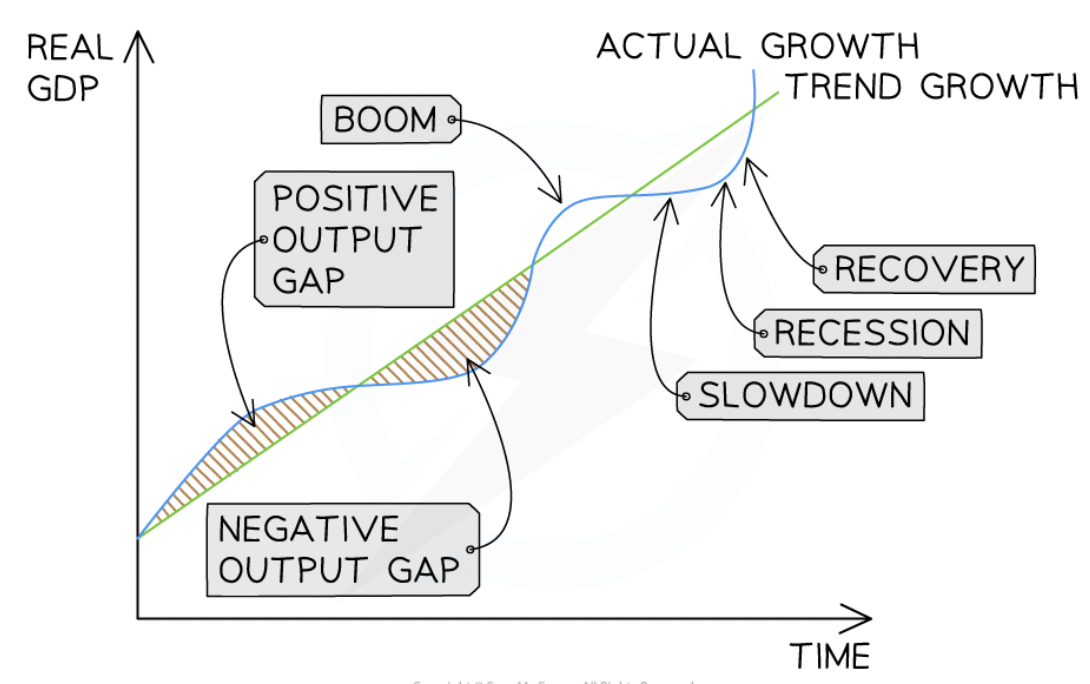
characteristics of boom
high rates of growth
decreasing unemployment
reduction of negative output gap or creation of positive output gap
high confidence from firms + households
increasing inflation
characteristics of recession
DEFINED- 2 consecutive quarters (6m) or more of negative growth
increasing/high unemployment
increasing negative output gap and spare production capacity
low confidence for firms and households
low inflation
increase in gov spending
benefits of economic growth/ why is it good
increased incomes lead to better standards of living → GDP per capita rises so people have more disposable incomes
due to increasing wages, people are pulled into higher tax brackets so increased revenue for gov, more money to spend on healthcare + education
decreased levels of absolute poverty
higher sales revenue + more profits
job creation so increase employment
technological advancement
businesses and firms to have more confidence in the economy so they invest in capital goods like technology, machinery and equipment all which drive productivity.
as a country continues to grow and invest, the multiplier will kick in amplifying the positive impact
costs of economic growth/ why is it bad
balance of payments get’s worse bc when there is more consumer spending means imports exceed exports so BOP worse → means the pound weakens.
increase incomes can lead to overconsumption, wasteful, negative effect on environment, people borrow and get into debt
greater inequality, income disparities and social inequality. this effects health and education further magnifying the discrepancy between rich and poor
environmental costs
can lead to demand pull inflation, when demand exceeds supply, firms raise prices
asset bubbles: excessive investment in one asset eg. housing creates rapid rise of prices for this asset so that when the bubble bursts, financial instability and price collapsation takes place
negative externalities: pollution, strain on resources → leads to climate change with extreme weather conditions which further increases inequality between countries BUT negative externalities are unaviodable, cost-benefit analysis to see if worth it??
reduced gov spending on benefits
what is a macroeconomic objective, what are the 7 key macroeconomic objectives
the goals that governments aim to achieve in order to improve the overall performance of the economy, they do this through monetary and fiscal policy.
economic growth: UK has an annual target rate of 2.5%, govs aim for sustainable long-run growth, growth has positive effects on investment, consumption, living standards ect.
low unemployment: govs aim to have as near to full employment as possible so an unemployment rate of 4%, this leaves room to account for frictional unemployment which makes it impossible to achieve 100% employment.
low and stable inflation: UK gov’s target is 2% measured by CPI to provide stability, if the inflation rate falls 1% outside the target the BOE writes a letter to the Chancellor of the Exchequer to explain why this has happened.
BOP equilibrium on current account: no surplus and no deficit, you want to be in equilibrium so that the country can sustainably finance the current account.
balanced government budget: ensures the gov has controlled borrowing so national debt does not escalate.
protection of the environment: ensures resources are not exploited and that they are used sustainably (oil + gas), controls pollution etc.
greater income equality: aims to minimise the gap between the rich and poor, makes a fairer society.
what is the difference between monetary and fiscal policy
MONETARY - adjusting interest rates and money supply to influence AD, BOE sets monetary policy, they meet 8 times a year to set the policy
FISCAL - involves gov spending, borrowing and taxation to influence AD, gov sets fiscal policy and they present it every year in the gov budget.
what are the 2 main monetary policy instruments
incremental adjustments to interest rates- (usually no more than 0.25%) to tackle inflation, called the repo rate: the short-term interest rate which the BOE lends to other banks.
DECREASING official rate by 0.25% - loans are cheaper, consumers borrow more, consumption increases, AD increase, inflation increases.
INCREASING rate by 0.25%-cost of borrowing increases, fall in consumption and confidence so AD reduces. also makes savings more attractive as the interest earnt on them will be higher.
Quantitive easing- the central bank buys assets (or gov bonds) to increase money supply and stimulate activity in times of low demand.
demand for assets increase as the banks buy them :. prices rise (causing a + wealth effect bc shares are worth more), and yields/interest rates fall so borrowing is cheaper and there is more consumption and investment.
‘quantitive’ means a set amount of money is created, ‘easing’ means reducing pressure on banks. it prevents a ‘liquidity trap’- when interest rates are v low so consumers prefer to hold cash rather than spend or invest it.
problems with quantitive easing (QE)
Very risky - if not controlled properly could cause hyperinflation eg. Germany 1923
Limited effect on demand - QE may only increase demand for second-hand goods (eg. existing houses), pushing up prices without boosting new production (eg. building new houses)
Wealth effect uncertainty - Higher asset prices don’t always lead to more consumption, especially if confidence remains low.
Dependency risk - QE is meant to be temporary, but some economies (eg. the Eurozone) have become reliant on it, raising concerns about long-term stability.
explain the role of the bank of england
controls monetary policy. the MPC is a committee of the Bank of England (NOT the gov). made up of 9 people (5 from BOE and 4 are independent outside experts).
It decides:
the base rate (the rate the BOE charges other banks)
actions over quantitive easing
it’s aim is to keep the rate of inflation at 2%, if it goes under 1% or above 3% govenor of BOE has to write to Chancellor of the Exchequer explaining why it’s happened and they are doing to bring it back to target. (use CPI to get number)
what are the 2 main fiscal policy instruments
gov spending (increase will increase AD)
tax (tax cuts will increase AD)
eval of demand side policies
-Effectiveness depends on economic conditions – Demand-side policies work well in recessions but may cause inflation if the economy is near full capacity.
Time lags – Fiscal policy takes time to implement, and monetary policy effects are delayed.
Crowding out – Higher government spending may reduce private sector investment.
Inflation vs. growth trade-off – Stimulating demand can boost growth but risks higher inflation.
Long-term vs. short-term impact – Demand-side policies may provide short-term relief but do not always address structural issues like productivity and labour market inefficiencies.
explain the great depression and how it effected the UK
Set off by the Wall Street Crash of 1929 when there was a sharp fall in share prices on the New York Stock Exchange.
shareholders lost money in the crash so lost confidence and stopped investing
Banks had lent too much during the 1920s, which had created an unsustainable boom. The gov allowed banks to fail after the crash, which decreased confidence further and reduced loans to businesses and consumers, causing a fall in AD.
The UK was tied to the gold standard, meaning its currency was fixed to the value of gold and other currencies. (the UK had left in 1914 due to WW1 but rejoined in 1925) this made the pound too strong so exports fell and weakened the UK economy exacerbating the great depression effects
in the UK, unemployment was over 15% and in the US it was almost 25%
what were policies the UK and US used to respond to the great depression
UK Response:
Austerity measures – Cut public wages & benefits by 10%, raised taxes (22.5% → 25%), reducing AD.
Left the gold standard (1931) – Pound fell 25%, allowing interest rate cuts (↓2.5%), boosting exports & AD.
Uneven recovery – London & South East recovered faster; Wales, North, and Scotland took until 1941.
USA Response:
Initially focused on balancing the budget like the UK.
Franklin Roosevelt elected (1932) for his New Deal plan which promised public sector investment, work schemes for the unemployed and fiscal stimulus. was an example of Keynesian expansionary fiscal policy and meant full employment was reached in 1943.
explain the 2008 global financial crisis and how it effected the UK
Caused by risky mortgage lending in the US- Banks gave loans to people who couldn’t afford repayments (moral hazard) bc the bank workers got higher bonuses.
High demand pushed house prices up (created a housing bubble).
Interest rates rose and loan repayments became too expensive for many homeowners.
Bubble burst – People couldn’t pay, houses were repossessed, and prices crashed.
Negative equity – Homes were worth less than the loans people owed.
banks had sold these ‘risky’ mortgage owners as ‘safe’ to other banks, so they stopped trusting/lending money to each other and there was a fall in confidence (PANIC)
Northern Rock Building Society was the first affected in the UK in 2007 with too many loans not being repaid, and savers beginning to withdraw their money.
what were policies the UK and US used to respond to the 2008 crash
Both governments were forced to nationalise banks and building societies and guarantee savers their money to prevent the chaos of a collapsed banking system and restore confidence. eg. the British government bought Northern Rock and most of Royal Bank of Scotland and Lloyds Bank.
UK used expansionary monetary policies with record-low interest rates and quantitative easing. this led to lower unemployment and higher growth
USA used expansionary fiscal policy which is why it recovered faster. In 2010, the UK prioritised reducing National Debt over providing a fiscal stimulus, but the USA did not make this decision until 2013.
what are supply side policies, what graph shows it working (and the two types)
gov policies aimed at increasing the productivity and efficiency of the economy (so it can supply more goods and services) and shift LRAS right.
free market based policies
aim to remove anything that prevents the free market system working efficiently, causing lower output and higher prices (stoping LR growth)
-interventionist policies
aim to correct market failiures. require direct gov intervention to increase the full employment level of output. (eg. free market under provides education and so the government provides it)
provide some examples of supply side policies that increase incentives
Reducing income/corporation tax rates and cutting unemployment benefits, incentivises the unemployed to seek work (makes sure people are better of in work than out of it) BUT would worsen equality.
offer free childcare/flexible hours to encourage women to go back to work quicker
A reduction/removal of the minimum wage would increase the incentive for firms to employ.
all 1
provide some examples of supply side policies that promote competition
privatisation- Selling state-owned firms to the private sector to boost efficiency. (1)
deregulation- Removing business restrictions to encourage new firms to enter markets. (1)
trade liberalisation (removing barriers to trade internationally like tariffs) (1)
Competition Policy – Preventing monopolies, price-fixing, and cartels (enforced by the CMA in the UK). (1)
gov spend on innovation (2)
BUT privatisation/deregulation could lower quality of goods and lead to - externalities (eg. harm environment)
provide some examples of supply-side policies that reform the labour market
increase retirement age → More workers available = More goods & services produced.
Increasing labour market flexibility → Helps firms respond to demand & population changes. (eg. have flexible 0h contracts)
Decreasing trade union power so wages can be decreased
Decreasing minimum wages to lower costs of production
all (1)