Unit 6 - Sampling distributions
1/7
There's no tags or description
Looks like no tags are added yet.
Name | Mastery | Learn | Test | Matching | Spaced | Call with Kai |
|---|
No analytics yet
Send a link to your students to track their progress
8 Terms
Parameter vs. statistic
Population = numerical descriptive measure of a population
Statistic = numerical descriptive measure of a sample
Parameters of population vs. statistics of sample
Parameters
\mu = mean
\sigma = standard deviation
p = proportion
Statistics
x̄ = mean
s = standard deviation
p̂ = proportion
What is the sampling distribution
The sampling distribution of a statistic is the distribution of values taken by the statistic in all possible samples of the same size from the sample population
The idea: take many samples from the sample population, collect the means from all the samples, display the distribution of means on a graph; the histogram will be bell-shaped, symmetric, centered at the population mean; it will be approx. normal
Does sampling distribution or population have larger spread
Sampling distribution always has lower spread bc standard deviation is lower
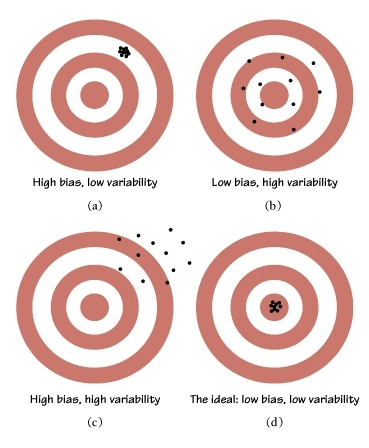
Variability of a statistic
3 conditions to check for sampling distributions
1. Normality (shape)
If population is approx normal, then sampling distribution is too
If population isn’t normal → Central Limit Theorem
If sample size is large (n ≥ 30), the sampling distribution is approx. normal
Or, use a normal probability plot and check if it’s linear
2. Unbiased
Check if it’s an random sample
If so, μ = μx
If it’s not obvious, say “verify a random sample was taken”
3. Independent
Independent if population ≥ 10n (sample size)
σx = σ/√n
Z score of sampling distribution
z = (x̄ - μ) / σx
zx = (x̄ - μx) / σ/√n
Conditions for proportions / variables
Unbiased - random sample
Independence - population ≥ 10n
Normality:
np ≥ 10
n(1-p) ≥ 10
μp̂ = p
σp̂ = √p(1-p)/n
z = (p̂ - μp̂) / σp̂ = (p̂ - p) / σp̂
Note:
p = true value; use for np ≥ 10, n(1-p) ≥ 10
p̂ = sample; only use for z-score