Unit 0 AP Psychology Vocabulary Terms 2025 Exam
1/75
There's no tags or description
Looks like no tags are added yet.
Name | Mastery | Learn | Test | Matching | Spaced | Call with Kai |
|---|
No analytics yet
Send a link to your students to track their progress
76 Terms
The Scientific Attitude
A scientific attitude means being curious, careful, and open-minded when learning or solving problems. It involves three main parts:
Curiosity: Wanting to learn and ask questions about how things work.
Example: "Why do plants grow faster in sunlight?"
Skepticism: Not believing everything right away; instead, checking if it makes sense or has proof.
Example: "Is this medicine really effective, or should I see the research first?"
Humility: Accepting that you could be wrong and being willing to change your ideas if new evidence shows otherwise.
Example: "I thought this theory was correct, but new data shows it’s not."
Critical Thinking
carefully and logically examining things before believing or making a decision. It involves asking good questions, looking at evidence, and avoiding being tricked by emotions or opinions.
Hindsight Bias
the tendency to believe, after learning an outcome, that one would have foreseen it "I knew it all along"
Overconfidence
the tendency to be more confident than correct
Peer reviewers
scientific experts who evaluate a research article's theory, originality, and accuracy
Theory
an explanation using an integrated set of principles that organizes observations and predicts behaviors or events
Hypothesis
A testable prediction, often implied by a theory
falsifiable
an idea or theory can be tested to see if it's wrong. If it can't be proven wrong, it's not scientific.
Operational Definition
a carefully worded statement of the exact procedures used in a research study. explains how a concept is measured or tested in a specific study.
Example: Instead of saying "happiness," you define it as "how many times someone smiles in an hour."
Replication
repeating a study or experiment to see if the results are the same. It helps confirm the findings are reliable.
Case Study
an observation technique in which one person is studied in depth in the hope of revealing universal principles
Naturalistic Observation
a descriptive technique of observing and recording behavior in naturally occurring situations without trying to manipulate and control the situation
Survey
A survey is a non-experimental method where psychologists ask a large group of people questions to learn about their attitudes, opinions, or behaviors.
Social Desirability Bias
A tendency to give socially approved answers to questions about oneself.
Self-Report Bias
happens when people give answers that are not true or accurate, often to look better or because they don't remember correctly.
Sampling Bias
happens when a study's sample (the group being studied) doesn't fairly represent the whole population. This can lead to incorrect results.
Random Sample
is when everyone in a population has an equal chance of being chosen for a study. This helps make the results more fair and accurate.
Population
the entire group of people a researcher wants to study or learn about.
Correlation
shows how two things are related. It tells if one thing goes up or down when the other changes.
Correlation Coefficient
The correlation coefficient is a number that shows how strong the relationship between two things is. It ranges from -1 to +1.
+1: Strong positive relationship (both increase together).
-1: Strong negative relationship (one goes up, the other goes down).
0: No relationship.
Variable
A variable is anything that can change or vary in a study.
Scatterplot
is a graph that shows dots to represent data. Each dot shows how two things are related.
illusory correlation
the perception of a relationship where none exists
regression toward the mean
the tendency for extreme or unusual scores to fall back (regress) toward their average.
Experiment
A research method in which an investigator manipulates one or more factors to observe the effect on some behavior or mental process
Experimental Group
the group in an experiment that receives the variable being tested
Control Group
In an experiment, the group that is not exposed to the treatment; contrasts with the experimental group and serves as a comparison for evaluating the effect of the treatment.
Random Assignment
assigning participants to experimental and control conditions by chance, thus minimizing preexisting differences between those assigned to the different groups
Single-blind procedure
the subjects do not know to what group they belong
Double-blind procedure
an experimental procedure in which both the research participants and the research staff are ignorant (blind) about whether the research participants have received the treatment or a placebo. Commonly used in drug-evaluation studies.
Placebo effect
improvement resulting from the mere expectation of improvement
Independent Variable
The experimental factor that is manipulated; the variable whose effect is being studied.
Confounding Variable
is something extra in a study that affects the results but isn’t being studied.
Example: If you’re studying how exercise affects weight loss, a confounding variable could be diet because it also impacts weight.
Experimenter Bias
a phenomenon that occurs when a researcher's expectations or preferences about the outcome of a study influence the results obtained
dependent variable
The measurable effect, outcome, or response in which the research is interested.
Validity
how well a test or experiment measures what it’s supposed to measure.
Example: A math test is valid if it measures math skills, not reading ability.
Quantitative Research
research that collects and reports data primarily in numerical form
Qualitative Research
research that relies on what is seen in field or naturalistic settings more than on statistical data
Informed Consent
an ethical principle that research participants be told enough to enable them to choose whether they wish to participate
Debriefing
the post-experimental explanation of a study, including its purpose and any deceptions, to its participants
Descriptive Statistics
Descriptive statistics are numbers that summarize and describe data, like the average, highest, or lowest score.
Example: "The average test score is 85, with a high of 100 and a low of 60."
Histogram
a bar graph depicting a frequency distribution
Mode
the most frequently occurring score(s) in a distribution
Mean
average
Median
Middle number
Percentile Rank
Percentage of scores falling at or below a specific score.
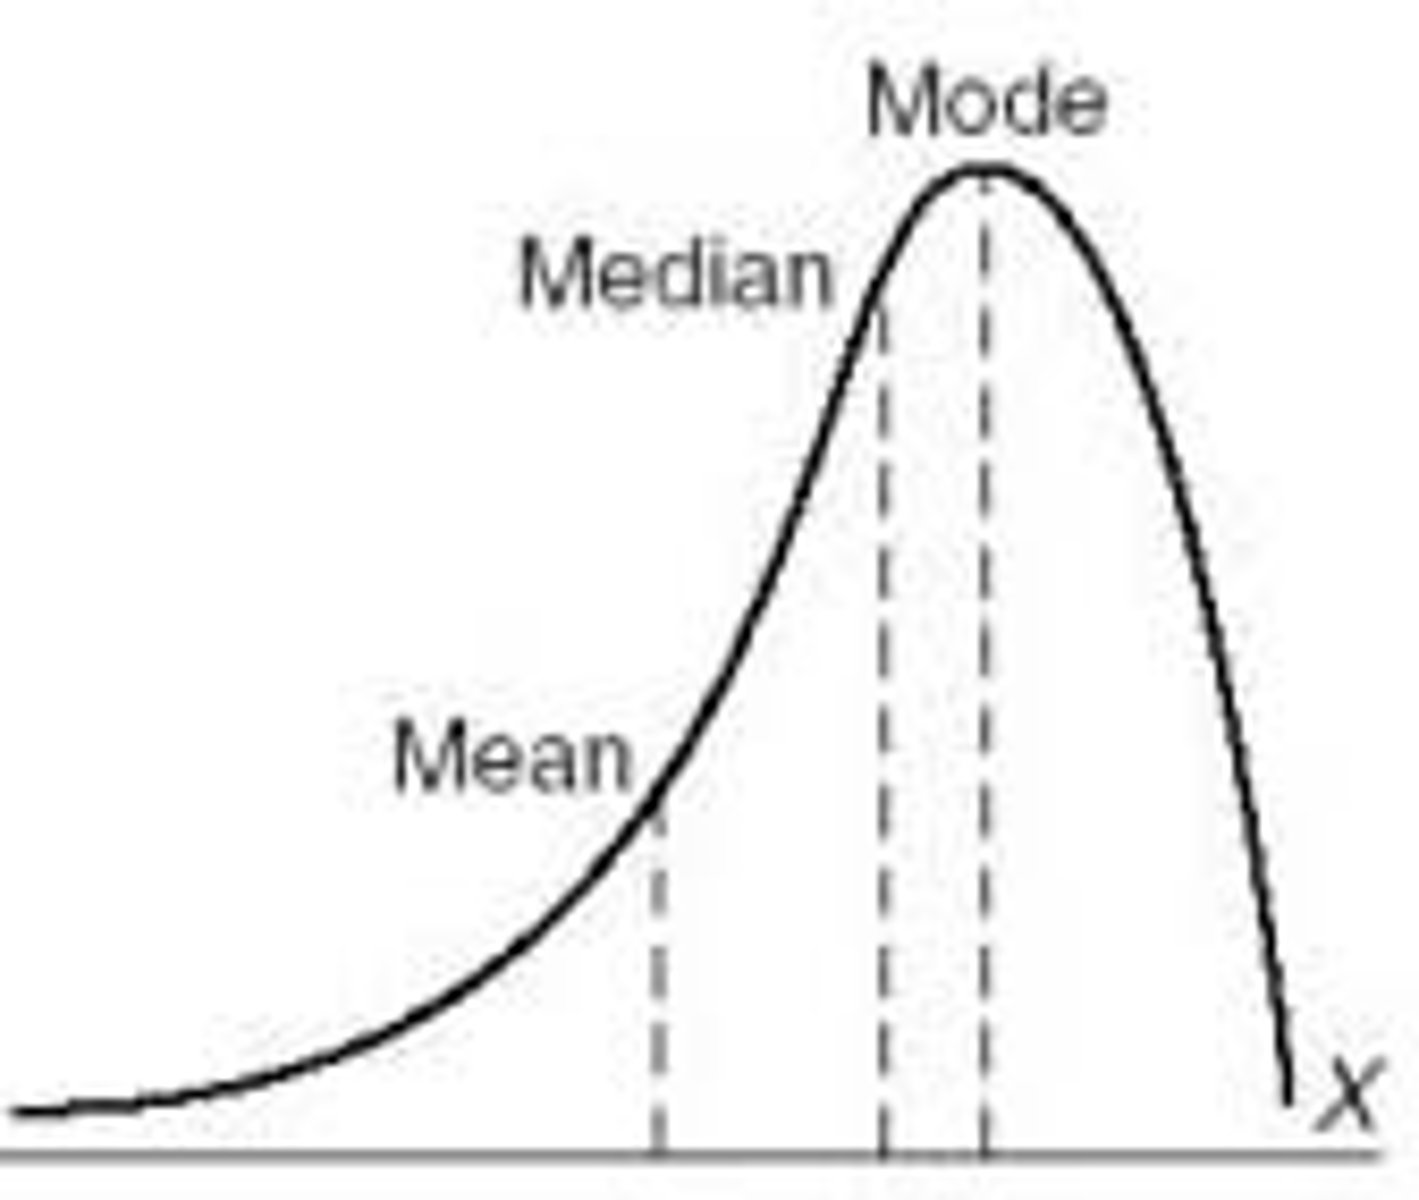
skewed distribution
a representation of scores that lack symmetry around their average value
Range
the difference between the highest and lowest scores in a distribution
Standard Deviation
shows how much the numbers in a group differ from the average.
Example: If test scores are all close to the average, the standard deviation is small. If scores are very spread out, the standard deviation is big.
Inferential Statistics
used to make guesses or predictions about a larger group (population) based on data from a smaller group (sample).
Meta-Analysis
combines results from many studies on the same topic to find a big-picture conclusion.
Example: Combining results from different studies about how sleep affects memory to get stronger, overall evidence.
Statistical Significance
a statistical statement of how likely it is that an obtained result occurred by chance
Effect Size
measures how strong or big the relationship is between two things in a study.
Sample
A relatively small proportion of people who are chosen in a survey so as to be representative of the whole.
Repersenative Sample
A representative sample is a small group that accurately reflects the larger group (population) being studied.
Example: If a school has 50% boys and 50% girls, a representative sample might include the same ratio.
Convenience Sample
A convenience sample is a group of people chosen because they are easy to reach, not because they represent the whole population.
Example: Surveying your friends instead of the whole school because they’re nearby.
Generalize
applying the results from a small group (sample) to the whole population.
Example: If a survey shows most students in one school like pizza, you might generalize that most students in other schools also like pizza.
Stratified Sampling
Stratified sampling means dividing a population into groups (called strata) and then choosing a few people from each group to make the sample more representative.
Example: If a school has 60% boys and 40% girls, you divide students into boys and girls and pick a sample that keeps the same ratio.
Placebo Method
Occurs when participants in the experimental group are supposed to ingest a drug and participants in the control group are given an inert but otherwise identical substance.
Positive Correlation
When two things increase or decrease together.Example: The more you study, the higher your grades.
Negative Correlation
When one thing increases while the other decreases.Example: The more you exercise, the less you weigh.
Study
research activity where psychologists collect data to learn about people or behaviors.Example: Observing how sleep affects memory.
Likert Scales
is a survey tool where people rate their agreement or feelings on a scale (e.g., 1 = strongly disagree, 5 = strongly agree).Example: "I feel happy today: 1, 2, 3, 4, 5."
Directionality Problem
a situation in which it is unclear which variable in an association came first
Third Variable
A third variable is something extra that influences the relationship between two things.Example: Ice cream sales and drowning rates increase together, but a third variable (hot weather) is the real cause.
Structured Interview
A structured interview uses set questions that are the same for everyone.
Example: Asking every job candidate the same list of questions.
Central Tendency
Central tendency is a way to find the "middle" or average of a set of numbers. The three main types are:
Mean: The average (add all numbers and divide by how many there are).Example: Scores: 5, 10, 15 → Mean = (5 + 10 + 15) ÷ 3 = 10.
Median: The middle number when the numbers are in order.Example: Scores: 3, 8, 10 → Median = 8.
Mode: The number that appears the most.Example: Scores: 2, 2, 4, 5 → Mode = 2.
Bimodal
a data set has two numbers (modes) that appear the most often.
Example: Scores: 2, 2, 5, 5, 7 → Modes = 2 and 5.
Positively Skewed
A positive skew means most data points are low, but a few very high values pull the average up.Example: Income in a town where most people earn $30,000, but a few earn $1,000,000.
Negatively Skewed
A negative skew means most data points are high, but a few very low values pull the average down.Example: Test scores where most students scored 90%, but a few scored very low.
Variance
Variance shows how spread out the numbers in a data set are from the average.
Example: If test scores are 90, 91, and 89, the variance is small because the scores are close to the average. If scores are 50, 90, and 100, the variance is larger.
4o
No Coercion
No coercion means participants in a study must join willingly and cannot be forced or pressured to take part.
Example: A researcher cannot make someone join by threatening their job or grades.
Deception
misleading or not fully informing participants about the true purpose of a study. It's allowed only if necessary and must not harm the participants.
Example: Telling participants they're doing a memory test when the real goal is to study their stress levels. Participants must be told the truth afterward (debriefing).
Confidentiality
means keeping participants' personal information private and not sharing it without their permission.
Example: A psychologist doesn’t reveal who took part in a study or share their test results with others.
Risk
the chance that participants in a study could be harmed, whether physically, emotionally, or mentally. Researchers must minimize risk and ensure safety.
Protection from harm
researchers must ensure that participants are not hurt physically, emotionally, or mentally during or after a study.
Example: A study cannot expose participants to dangerous situations or lasting stress. If stress is part of the study, researchers must help participants recover.