Economics Unit 4 Notes
1/122
Earn XP
Description and Tags
Name | Mastery | Learn | Test | Matching | Spaced | Call with Kai |
|---|
No study sessions yet.
123 Terms
Global Interdependence
Linkages between economies through trade, investment, tourism, and immigration. Interdependence refers to two or more countries that impact and rely on each other, while globalisation is the economic, social, and political interaction and integration of people in different areas of the world. Nowadays, most nations are interdependent and related in a globalised world.
Global Trade Patterns
Trends in international trade showcasing the distribution of goods and services
International Competitiveness
the ability of a country to compete successfully against other countries in international trade.
Determinants of International competitiveness
· Changes in labour productivity (due to factors such as technology, education and training).
· Changes in country’s price level (inflation) relative to its trading partners.
· Changes in a country’s wages relative to its trading partners.
· Changes in the exchange rate.
What are the four main channels across which economies are linked?
Trade, Investment, Tourism, Immigration
Discuss the four main channels across which economies are linked: Trade
· Trade:
o International trade simulates economic growth and expands the global economy.
o It creates jobs, raises income and increases living standards.
o It also creates a greater choice of goods and services for consumers and producers at lower prices.
Discuss the four main channels across which economies are linked: Investment
o Foreign investment between countries allows economies to expand especially countries like Australia that have a smaller savings base and require additional funding
When foreign investors start firms in a host nation, they frequently export goods and services to make money elsewhere. This can lead to a more favourable trade balance by offsetting the cost of imports. Access to Global Markets: Businesses in source nations might use FDI to expand their global reach.
Discuss the four main channels across which economies are linked: Tourism
o Movement of people between countries for recreation.
o Tourists spend significant amounts of money in the countries they visit.
o Tourism now accounts for 30% of worlds exports of commercial services.
Discuss the four main channels across which economies are linked: Immigration
o Immigration allows countries to bring in people who can provide specialised skills that can be useful within the economy.
Australia’s place within the global economy
· Exports contribute to 23% of Australia’s GDP
· 24% of Australian workers are directly involved in trade related activities
· Foreign investment supplement domestic savings to help fund economic development
· Around 30% of the Australian population was born overseas
Globalisation Extent
The degree of openness in international borders for trade, investment, and technology flows
Globalisation Facilitators
· Trade
· Technology
Advances in transport and communication have decreased the impact of distance between countries
o Transport costs and travel time have fallen helping to boost the volume of merchandise trade and increase tourist travel to record numbers
o Advances in information technology have enabled the growth of trade in services such business services like accounting, marketing and IT support
· Multinational Corporations
o These firms establish production and/or retail and distribution facilities in other countries
o Multinational firms expand into foreign countries to increase their sales, profits, and market shares
o Examples: Facebook, Apple, Nike and Microsoft from the US, Toyota and Sony from Japan, Samsung and Hyundai from South Korea, Volkswagen from Germany and BHP and Rio Tinto from Australia
· Communication and Transport
Globalisation Advantages vs Disadvantages
Advantages | Disadvantages |
Higher living standards | Environmental damage |
More goods and services | Use of child labour |
Greater variety of goods and services | Loss of culture |
Higher employment and incomes | Uneven distribution of gains |
Access to foreign investment | Loss of economic control |
Gains from trade | Spread of pandemics |
Increases cultural awareness |
|
Promotes peace between countries |
|
Trade Benefits
Advantages like job creation, income growth, and increased consumer choice
Composition of Global Trade
· International trade can be trade in goods (merchandise trade) and trade in services.
· Trade in physical goods accounts for 76% of trade.
· Trade in services account for 24% of trade.
· United States, China and Germany are the worlds three largest economies and account for 30% of merchandise exports.
· China is the world’s largest exporter.
· United States is the largest importer.

Tourism Impact
Economic benefits from visitor spending, contributing significantly to global services exports
Immigration Benefits
Bringing skilled individuals to enhance a country's workforce and economy
Global Trade Composition (goods vs services %)
Division of trade into goods and services, with goods dominating at 76% and services at 24%
Manufacturing Exports as a proportion of international trade
53% of global exports, a significant portion of international trade
Fuels and Mining Exports as a % of international trade
12% of global exports, contributing to the energy and resource sectors
Agricultural Exports
10% of global exports, showcasing the importance of food production
Services Exports
24% of global exports, highlighting the growth in service-based economies
Trade Correlation with GDP
Positive relationship between trade and GDP per capita, indicating economic growth
Global Trade Trends
Increase in trade as a percentage of GDP, influenced by global organisations and policies - · World trade (exports plus imports) as percentage of GDP increased from 38% in 1991 to 60% by 2019. Over that time GDP per capita doubled.
International Competitiveness
the ability of a country to compete successfully against other countries in international trade.
International Competitiveness Determinants
· Changes in labour productivity (due to factors such as technology, education and training).
· Changes in country’s price level (inflation) relative to its trading partners.
· Changes in a country’s wages relative to its trading partners.
· Changes in the exchange rate.
Globalisation Factors
Elements like trade, technology, and multinational corporations driving global integration
Communication and Transport Advantages
Benefits like higher living standards and increased trade volume
Communication and Transport Disadvantages
Drawbacks such as environmental harm and cultural loss
Communication and Transport Impacts
Effects like economic gains, but also risks like pandemics and cultural shifts
Communication and Transport Promotion
Encouraging peace and understanding between nations through enhanced communication
Tariff
Tax on imports to increase domestic competitiveness and government revenue
Specialisation and Trade Overview
· Countries specialise in producing goods and services that they are best a producing and then trade the surplus
· Specialisation is possible because resources and quality of resources differ between countries
· Countries benefit from trading the surplus of their specialised good because with that money they can purchase imports of goods and services that they are less efficient in producing, and then have a larger quantity of both
o Absolute advantage: when a country can produce a good or service at a lower absolute cost per unit than another country
o Comparative advantage: when a country can produce a good or service at a lower opportunity cost than another country
Sources of comparative advantage
· Quantity and quality of labour resources
· Quantity and quality of natural resources
· Quantity and quality of capital resources
· Level of technological progress
o Examples include Australia with iron ore and coal, Germany with motor vehicles, US with software and the entertainment industry, and China with clothing and electronics
Australian Sources of Comparative Advantage:
· Australia is a significant exporter of primary commodities (minerals and agricultural products)
· It is also a significant importer of manufactured goods and financial capital (money and other forms of funding)
· Australia’s annual GDP is over $2 trillion which makes Australia a medium sized open economy (is open to the movement of goods, services and capital in and out of the country)
Importance of International Trade to Australia
· Trade equates to 46% of GDP
· Increases real GDP, income and living standards
· 20% of Australian workers are employed in trade related industries
· Australian consumers have access to a wider range of goods and services at a lower price
· Imports reduce production costs
· Overseas competition forces Australian firms to become more competitive
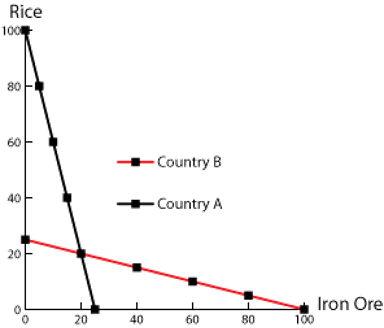
Production Possibility Frontier in terms of trade
· Demonstrates comparative and absolute advantage between two countries producing two products
· Data from these models is what is used to show gains from specialisation through ratios of opportunity cost
· The model has 4 assumptions:
o The world consists of two countries
o Each country produces and consumes two goods
o Resources are perfectly mobile
o Transport costs are not considered
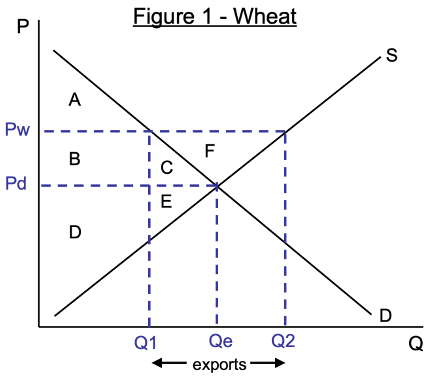
Gains from Trade (Exports)
· Gains from exporting can only occur when the world price (Pw) is above the domestic price (Pd)
· When at equilibrium the quantity being demanded and supplied is Qe and the good or service is being sold at the domestic price (Pd)
· When domestic producers decide to sell their product or service at the world price internationally (for a higher price) then domestic demand decreases from Qe to Q1, but the producer’s supply increases from Qe to Q2 to make more revenue
· The difference between Q1 and Q2 is the quantity of exports that producers with sell overseas
· Domestic producers are the group that gains from exports as their producer surplus increases from D, E to D, E, B, C, F
· Domestic consumers are the group that loses from exports as their consumer surplus decreases from A, B, C to just A
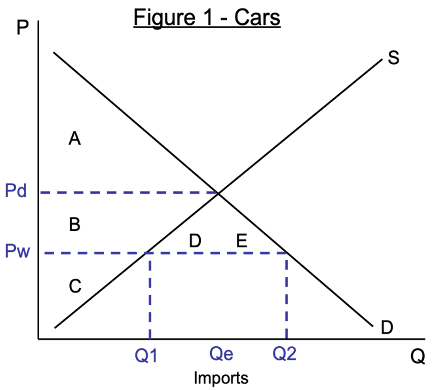
Gains from Trade (Imports)
· Gains from importing can only occur when the world price (Pw) is below the domestic price (Pd)
· When at equilibrium the quantity being demanded and supplied is Qe and the good or service is being sold at the domestic price (Pd)
· When domestic consumers decide to buy the product or service internationally at the world price (lower price) then domestic demand increases from Qe to Q2, but domestic producers lose competitiveness and their supply decreases from Qe to Q1
· The difference between Q1 and Q2 is the quantity of imports bought from overseas
· Domestic consumers are the group that gains from imports as their consumer surplus increases from A to A, B, D, E
· Domestic producers are the group that lose from imports as their producer surplus decreases from B, C to just C
Protection
any action taken by the government designed to give a domestic producer an artificial advantage over an international producer
· This will increase production in protected industries and decrease consumption of imported goods and services
· Owners and workers in protected industries gain whilst other industries and consumers lose as they now have to pay higher prices
· Forms of protection include:
o Tariffs
o Subsidies
o Quotas
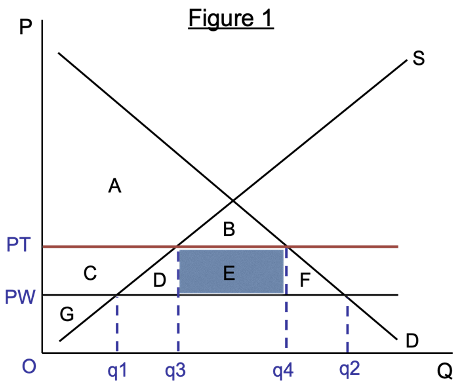
Tariff diagram
· When a good or service is imported at the world price, consumer demand is high at Q2, but domestic producers are not as competitive with international producers so supply is low at Q1
· The government installs a tariff to support these domestic producers and earn revenue themselves, they raise the price from PW to PT which is now the price plus the tax on the selected imports
· With the tariff instated, demand for imports falls due to the higher price and decreases from Q2 to Q4, this means domestic producers gain competitiveness and their supply increases from Q1 to Q3
· Consumer surplus decreases from A, B, C, D, E, F to just A, B and then producer surplus increases from just G to G, C
· E represents the revenue made by the government which is the tariff price x the difference between Q3 and Q4
· D and F are deadweight losses of consumer surplus and are due to underproduction
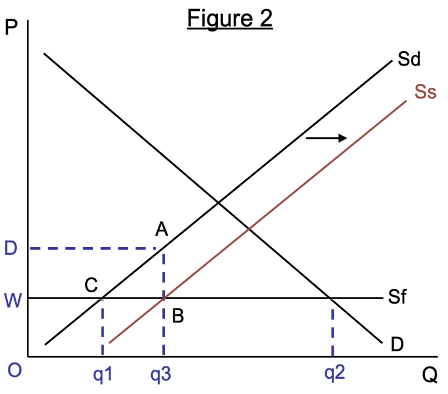
Subsidy Diagram
Subsidy: grants or payments made by the government to domestic producers. A subsidy enables a domestic producer to sell their product at a lower price to compete against imports.
· When a good or service is imported at the world price, consumer demand is high at Q2 and domestic producer supply is low at Q1
· The government grants a subsidy to support these domestic producers so they can sell their products at a cheaper price to be competitive with foreign suppliers (Sf), this moves Sd to the right to Ss
· This increases the supply domestic producers can hold from Q1 to Q3 as demand for the good or service remains high at Q2 just some of it now turns to domestic producers because of convenience.
· D, A, C, W is the producer surplus that has been granted as a result of the subsidy
· D, A, B, W is the cost of the subsidy to the government which is the cost of increasing Sd to Ss
· The cost of the subsidy exceeds the increase in producer surplus by the region of A, B, C which is a deadweight loss of money that the government could have spent elsewhere in the economy
Consumer Surplus
Consumer surplus is the difference between willingness to pay for a good and the price that consumers actually pay for it. Each price along a demand curve also represents a consumer's marginal benefit of each unit of consumption.
Producer Surplus
The benefit producers receive above their cost
Deadweight Loss
Loss of economic efficiency due to underproduction or overproduction
Subsidy
Cash payments by the government to suppliers that reduce their costs. The effect of a subsidy is to increase supply and therefore reduce the market equilibrium price.
Anti-dumping Argument
Protection against foreign firms selling at abnormally low prices.
o Dumping is when an international firm sells large amounts of stock at abnormally low prices to drive out domestic producers and competition
o Protection like tariffs would reduce the effects of this international strategy as domestic consumers don’t receive those abnormally low prices and domestic producers can remain competitive
o In 2015 China dumped steel into the U.S. manufacturing market, reducing the competitiveness of U.S. steel producers drastically, the U.S. government then introduced a 500% tariff on imported Chinese steel
Infant Industry Argument
New industries need protection until they grow competitive
o It is argued that newly developing industries need protection until they can grow to develop their own comparative advantage, this argument was used in the favour of the Australian manufacturing industry
o Protection like subsidies for these new industries would let them become competitive with international producers, like the subsidies the government provided Holden and Ford to manufacture cars in Australia
Diversification Argument
Need to diversify industries to reduce economic vulnerability
o If a country completely applied the idea of comparative advantage and then all resources were employed in the desired industry, fluctuations in prices would greatly affect the country’s economy
o For this reason it benefits a country to diversify their industrial base, and protection will be necessary to increase the competitiveness of these new industries so the level of protection can be reduced
o For example, Australia has a comparative advantage in mineral and agricultural exports and therefore specialises in it, for a long time the Australian government subsidised the car manufacturing industry in Australia so that if something ever happened, there would be other export options (a backup plan)
National Security Argument
Protection for goods crucial to national defense and security
o If importing a good or service could lead to issues surrounding national defence and security, protection policies will be introduced such as a heavy tariff or large subsidy to cause a good or service to be produced domestically.
o An example is the U.S. importing microchips from Taiwan, recently Taiwan is at risk of being invaded by China and since China is an enemy of the U.S., protection policies have been put in place to bring the production of microchips to domestic producers
Increased Employment Argument
Tariffs and subsidies to boost domestic employment
o If tariffs are placed on imported goods or services, and subsidies are given to domestic industries, consumers will shift their interest towards domestic producers, increasing demand for the same goods and services and therefore employment requirements
o An example of this is when Australia had a car manufacturing industry, the Australian government heavily subsidised companies like Holden and Ford so they could continue to produce in Australia with the intention of increasing employment opportunities
Cheap Foreign Labour Argument
Tariffs to protect domestic wages from foreign competition
o If another country can produce a good or service for a cheaper price due to cheaper labour costs and this reduces competitiveness of domestic manufacturers, governments will introduce tariffs on these imported goods and services in an attempt to protect the minimum working wage in their country and a certain standard of living
o For example, China is unrivalled in the manufacturing industry due to its cheap labour costs, countries like Australia cannot remain competitive so they place tariffs on imported Chinese goods and services so that domestic producers do not go under and reduce employment opportunities or reduce wages
Favourable Balance of Trade Argument
Promoting trade surplus by protecting local businesses
o The favourable trade balance is a surplus, meaning that exports outweigh imports and a country makes profit of trade, this would require protection of local businesses so that instead of importing goods and services, consumers can buy domestically and help create a trade surplus
o An example of this is the U.S. government’s $74.6 billion budget deficit, as per this argument, the U.S. government should protect domestic producers and therefore reduce U.S. consumers import quantities
Dumping
Selling large stock at low prices to eliminate competition.
Arguments for Trade Liberalisation: Incomes and Living Standards
o By liberalising trade, demand increases for domestically produced goods and services from international consumers and supply increases for domestic producers as their market has expanded
o This leads to companies being able to pay higher wages and generate more employment opportunities as they have to meet increased demand requirements and they also generate more profit
o This increases living standards as the minimum wage will increase, and so will economic freedom
Arguments for Trade Liberalisation: Increases efficiency through competition
o By liberalising trade, domestic markets begin to compete against other economic markets at the world price, this competition creates incentive for increased efficiency and cheaper production so that consumer purchases are not lost to overseas producers
o For example, Australia is a global leader in mineral exports due to its unrivalled efficiency, this developed due to international competition and threat of a loss of competitiveness due to other mining nations like Africa and South America
Arguments for Trade Liberalisation: Increases productivity via efficient resource allocation
o Trade liberalisation is based on the theory of comparative advantage and countries specialising in the production of specific goods and services, by doing so that country is performing at their highest level of productivity to produce the highest quantity of their specialised good or service, to do this they must allocate their resources efficiently
o For example, Australia’s mining industry is globally unrivalled due to its extreme developments in technology and therefore efficient allocation of their available resources
Arguments for Trade Liberalisation: Consumers gain through lower prices, greater variety and quality of goods
o If tariffs are removed off imported goods and services consumers gain access to lower prices and a greater variety and quality of those goods and services
o This leads to consumers benefiting from smaller amounts of their income going towards purchases as they have access to competitive prices
o For example, Australia significantly reduced its tariff on imported footwear and clothing allowing domestic consumers access to a wider variety of cheaper clothing
Arguments for Trade Liberalisation: Exporters gain through higher prices and increased market access
o By liberalising trade, domestic producers have access to higher prices to sell their goods and services at internationally, this benefits them as they can increase profits through international consumer purchases
o For example, Australia sells its iron ore to Chinese steel producers because they are willing to purchase it for a much higher price than domestic producers, this means Australian mining companies benefit from access to international markets and they can increase profits
Arguments for Trade Liberalisation: Domestic producers gain through lower input prices
o Domestic producers can purchase raw materials (inputs) at a much lower internationally competitive price, which allows them to produce their goods and services at a cheaper price but sell it for a higher price and generate a larger profit margin
o For example, clothing brands source their material from countries like China and India where they can get bulk amount of fabric for cheaper prices then sell their produced good for a larger profit margin
Arguments for Trade Liberalisation: Enables greater specialisation and economics of scale
o Exposure to global economies allows multiple countries to benefit from trade relationships focused around specialisation, this means that international competition forces countries to specialise in a good or service to guarantee a profit or trade benefit
o For example, Australia specialises in mineral and agricultural exports, this is because the country has the comparative advantage in it and it can sell its products internationally for a higher price
Arguments for Trade Liberalisation: Increased economic growth
o Trading allows for a greater amount of goods and services to be produced at lower opportunity costs promoting economic growth in all economies that freely and liberally partake in trade.
o For example, Australian exports account for 23% of the country’s GDP, its specialisation in the areas of minerals and agriculture allow Australia to grow it’s GDP with its growth in trade
Arguments for Trade Liberalisation
Increases real incomes and living standards,
Increases efficiency through greater competition,
Increases productivity through efficient resource allocation,
Consumers gain through lower prices, greater variety and quality of goods,
Exporters gain through higher prices and increased market access,
Domestic producers gain through lower input prices,
Enables greater specialisation and economics of scale,
Increased economic growth
Trade Liberalisation
Removing trade barriers for increased free trade between countries
Minimum Wage Increase
Result of companies paying higher wages due to increased demand
Economic Freedom
Expands with trade liberalization and increased living standards
Efficiency Competition
Competition from liberalized trade leading to increased efficiency
Productivity Growth
Enhanced by efficient resource allocation and specialisation
Lower Consumer Prices
Result of tariff removal, offering greater variety and quality
Export Profit Increase
Domestic producers benefit from higher international prices
Input Price Reduction
Domestic producers benefit from lower raw material costs
Specialisation Benefits
Countries focus on specialised goods for competitive advantage
Economic Growth Promotion
Trade increases production, promoting economic growth
World Trade Organisation (WTO) and components
International organisation promoting trade liberalisation
Components:
Most favoured nation treatment, (MFN)
national agreement,
multilateral agreements,
regional trade agreement (RTA),
trade blocs,
free trade agreements (FTA)
Most Favored Nation Treatment
WTO principle preventing discrimination among trading partners. Member countries cannot discriminate between their trading partners (Exceptions are free trade agreements within areas e.g. European Union)
National Treatment
Ensures equal treatment for imported and domestic goods. Means that imported goods and services should be treated the same as domestic goods and services.
Multilateral Trade Agreements
Agreements between many counties that reduce barriers to trade for all countries. These agreements have the most benefits but are hard to achieve agreement on.
Regional Trade Agreement (RTA)
Encourages free movement of goods among member countries. A treaty signed by two (bi-lateral agreement) or more countries to encourage the free movement of goods and services across the borders of its members. RTAs cover more than 50% of world trade. RTA’s can act as a Trade bloc.
Trade Bloc
Group of countries reducing internal trade barriers. group of countries that agree to reduce trade barriers between themselves but impose barriers on countries outside the bloc. E.g. European Union (EU), the United States–Mexico–Canada Agreement (USMCA) and Association of South East Asian Nations (ASEAN). These three blocs account for 60% of world trade. Trade bloc’s often cause trade diversion rather than trade creation.
Free Trade Agreement (FTA)
Treaty reducing trade barriers between economies. an international treaty between two or more economies that reduces or eliminates certain barriers to trade and investment. FTA’s result in increased economic activity and therefore greater employment opportunities. Australia has 14 FTA’s including - New Zealand, Singapore, Thailand, US, Chile, ASEAN, Malaysia, Korea, Japan, China, the Trans Pacific Partnership, Hong Kong, Peru and Indonesia. These countries account for 80% of Australia’s trade.
Trade Intensity
Measure of trade importance to a country's economy
Trade Intensity Ratio
[(X+M) / GDP] x 100, indicating trade importance
Composition of Exports
Trends in types of goods exported by a country
Composition of Imports
Trends in types of goods imported by a country
Direction of Trade
Historical and current trade partners and regions
Balance of Payments
a systematic record of all economic transactions between the residents of Australia and the residents of the rest of the world
Current Account Balance
transactions involving trade in goods and services and income flows
Asia-Pacific region
Region with lower transport costs for Australia than Europe
Financial Account
Includes foreign investment and international lending transactions
Capital Account
Records capital transfers and non-financial asset acquisitions
Credit (Balance of Payments)
Positive entry, money flows into Australia
Debit (Balance of Payments)
Negative entry, money flows out of Australia
Trade in Goods
Involves exports/imports of raw materials, manufactures, minerals, fuels, and food
Trade in Services
Includes transport, travel, tourism, IT, and financial services
Primary Income
Includes compensation of employees and investment income
Secondary Income
Involves transactions with no economic value received in return
Capital Transfers
Include migrant funds and aid funds for capital formation
Net Acquisition/Disposals
Movement of patents and copyrights ownership
Structural Reasons
Factors influencing Australia's current account outcome