Introduction to Computational Thinking and Data Science: Data8 Table Definitions (25-26)
1/71
Earn XP
Description and Tags
for midterm
Name | Mastery | Learn | Test | Matching | Spaced |
|---|
No study sessions yet.
72 Terms
Observational study
-Scientists make conclusions based on data that they had observed but had no hand in generating
-Group individuals by some treatment and measure some outcome.
-Simplest setting: a treatment group and a control group.
-If the outcome differs between these two groups, there is evidence of an association
-If the two groups are similar in all ways but the treatment itself, a difference in the outcome is evidence of causality
-Confounding factor: an underlying difference between the two groups (other than the treatment)
-When a group is divided randomly, it's unlikely that there are systematic differences between sub-groups.
Randomized controlled experiment
-An experimental design where all subjects are randomly allocated to different treatments
-Long been the gold standard in medical field
Growth Rate
-The rate of increase per unit time
-Growth rate g is used to describe the relative size of an initial amount and a changed amount after some amount of time t.
-To compute changed
Changed = initial * (1+g)**t
-To compute g
(changed/initial)**(1/t) -1
max(array)
Returns the maximum value of an array
min(array)
Returns the minimum value of an array
sum(array)
Returns the sum of the values in an array
abs(num), np.abs(array)
Take the absolute value of number or each number in an array
round(num), np.round(array)
Round number or array of numbers to the nearest integer
len(array)
Returns the length (number of elements) of an array
Int
-Integers
-They can only represent whole numbers (negative, zero, or positive) that don't have a fractional component
Float
-Represent whole or fractional numbers
-Have some limitations:
1. Can represent extremely large or extremely small numbers
2. Only represents 15 or 16 sig digits.
3. After combining values with arithmetic, the last few digits may be incorrect.
type(#)
Will tell you if a number is an int or float
Strings
-A piece of text represented in a computer.
-Can be created using single or double quotes.
-Can generate an uppercased version:
E.g. input: "loud".upper()
output: "LOUD"
-Can replace all instances of a substring:
E.g. input: "hitchhiker".replace("hi", "ma")
output: "matchmaker"
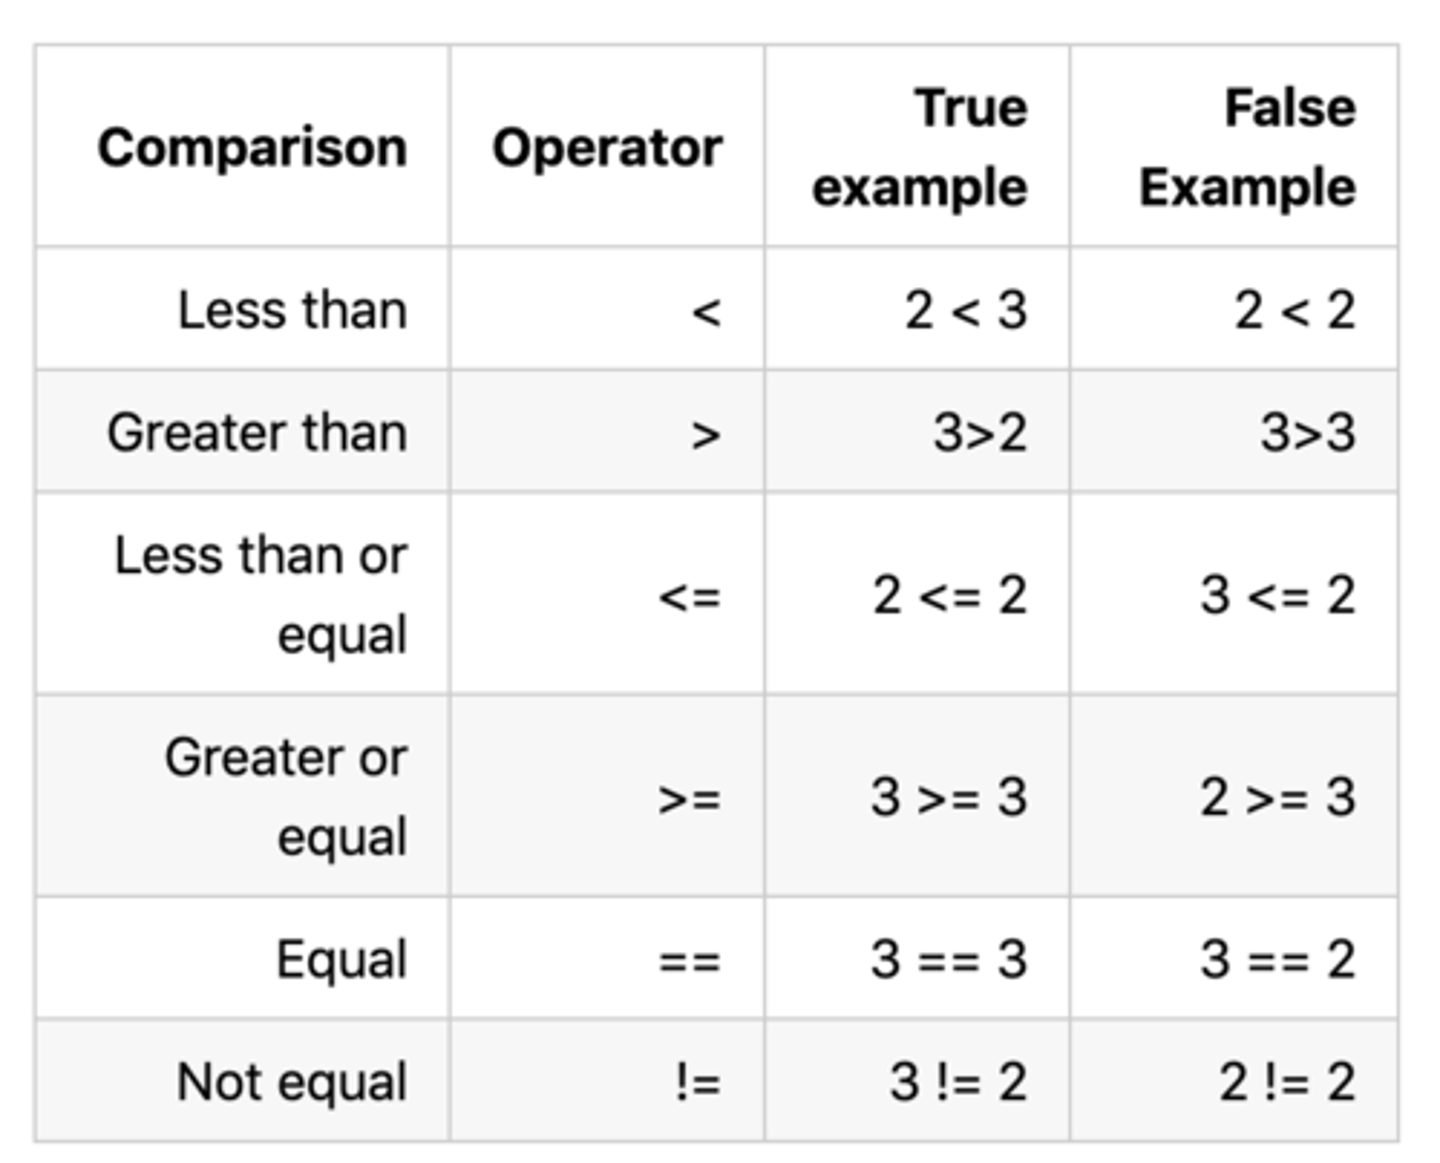
Boolean values
-A data type that has two possible values: True or False
-Most often arise from comparison operators.
Array
-Used to store multiple values in one single variable
-Can be used for numbers, strings, or other types of values, but a single one can only contain a single kind of data.
import numpy as np
Import the numpy package, providing functions for creating and manipulating arrays.
make_array()
Makes a numpy array with the values passed in
np.average(array) (np.mean(array))
Returns the mean value of an array
np.std(array)
Returns the standard deviation of an array
np.diff(array)
Returns a new array of size len(arr)-1 with elements equal to the difference between adjacent elements;
val_2 - val_1, val_3 - val_2, etc.
np.sqrt(array)
Returns an array with the square root of each element.
Range
-An array of numbers in increasing or decreasing order, each separated by a regular interval.
-Defined using the np.arange function, which takes either one, two, or three arguments: a start, end, and a 'step.'
-Always includes its start value, but does not include end value
np.arange
np.arange(start, stop, step)
np.arange(start, stop)
np.arange(stop)
-An array of numbers starting with start, going up in increments of step, and going up to but excluding stop.
-When start and/or step are left out, default values are used in their place.
-Default step is 1
-Default start is 0
array.item(index)
-Returns the i-th item in an array
-Python indices start at 0
Table().read_table(filename)
-Create a table from a data file
-Filename is a string
tbl.with_columns(name, values)
(tbl.with_columns(n1, v1, n2, v2, ...))
-A table with additional column or columns
-name is a string for the name of a column
-values is an array
tbl.num_columns
Computes the number of columns in a table
tbl.num_rows
Computes the number of rows in a table
tbl.relabel(old_label, new_label)
-Modifies the existing table in place, changing the column heading the first argument to the second
-Labels are strings
-Does not change the original table
tbl.column_name_or_index
-The values of a column as an array
-The column can be accessed by using its name (string) or by its index (int).
-Items in the array can be accessed using item, as with an array
E.g. tbl.column(i).item(i)
tbl.select(col1, col2, ...)
-Creates a copy of a table with only the specified columns
-Each column is the column name or index
tbl.drop(col1, col2, ...)
-Creates a copy of a table without some of the columns.
-Each column is the column name or index.
tbl.sort(column_name_or_index)
-Creates a copy of a table sorted by the values in a column
-Can list rows in alphabetical order
-For numerical values, defaults to ascending order unless descending=True is included.
-Column index or name can be applied.
tbl.take(row_indices)
-A table with only the rows at the given indices
-row_indices is either an array of indices or an integer corresponding to one index
-E.g. to get the first five rows of a table:
tbl.take(np.arange(6))
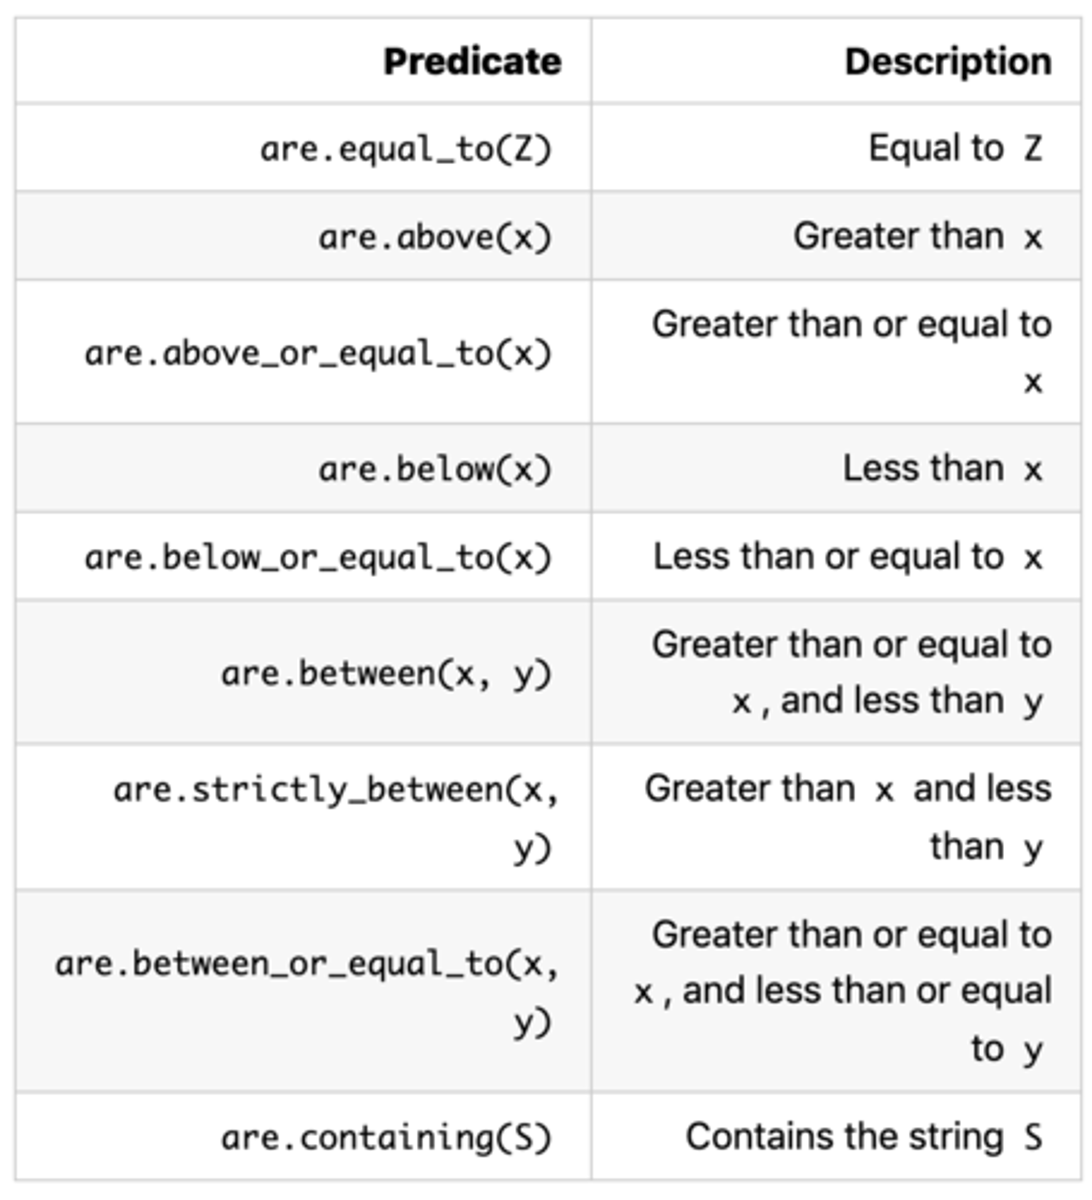
tbl.where(column, predicate)
-Creates a copy of a table with only the rows that match some predicate
-Can use repeatedly to access rows with multiple specified features.
Scatter Plots
-Graphs that display the relation between two numerical variables.
-Table method scatter draws a plot consisting of one point for each row of the table.
tbl.scatter(x_column, y_column)
-x_column and y_column must be strings specifying column names
Line Graphs
-Charts that indicate changes in one or more variables over time (two numerical values)
-Table method plot draws a graph consisting of one point for each row of the table
tbl.plot(x_column, y_column)
-x_column and y_column must be strings specifying column names
Bar Charts
-Graphs that compare values across categories of data
-Has categories on one axis and numerical frequencies on the other.
-Displays a bar for each category. Bars are equally spaced and equally wide.
-The length of each bar is proportional to the frequency of the corresponding category.
-tbl.barh(categories)
tbl.barh(categories, values)
Histograms
-Graphs used to show frequency distributions of numerical data.
-Table method hist generates a graph of the values in a column.
tbl.hist(column, unit, bins)
-Optional unit argument is used in the labels on the two axes.
-Amounts grouped into contiguous intervals called bins.
Bins have the form [a,b), where a is included in the bin and b is not.
-Two defining properties:
1. the bins are drawn to scale and are contiguous (though some might be empty), because the values on the horizontal axis are numerical.
2. The area of each bar is proportional to the number of entries in the bin.
Area of a histogram
-The area of each bar in a histogram is proportional to the number of entries in the bin.
-The key to drawing a histogram
-area of bar = percent of entries in bin
area of bar = height of bar x width of bin
-Therefore,
height of bar = percent of entries in bin/width of bin
-The total areas of all the bars in the histogram is 100%. In terms of proportions, the areas of all the bars in a histogram "sum to 1."
Defining a function
def function_name(arg1, arg2, ...):
#Body can contain anything inside of it
return #a value (the output of the function call)
tbl.apply(function, col1, col2, ...)
Returns an array of values resulting from applying a function to each item in the column
tbl.group(column_or_columns, func)
-Groups rows by unique values or combinations of values in a column(s).
-Multiple columns must be entered in an array or list form
-Other values aggregated by count (default) or optional argument func
Cross classifying
-Application of the group method that allows us to classify individuals according to multiple variables.
-E.g.
more_cones.group(['Flavor, 'Color'], sum)
![<p>-Application of the group method that allows us to classify individuals according to multiple variables. </p><p>-E.g. </p><p>more_cones.group(['Flavor, 'Color'], sum)</p>](https://knowt-user-attachments.s3.amazonaws.com/5f6277e7-55f5-4634-b914-c113b8b96261.png)
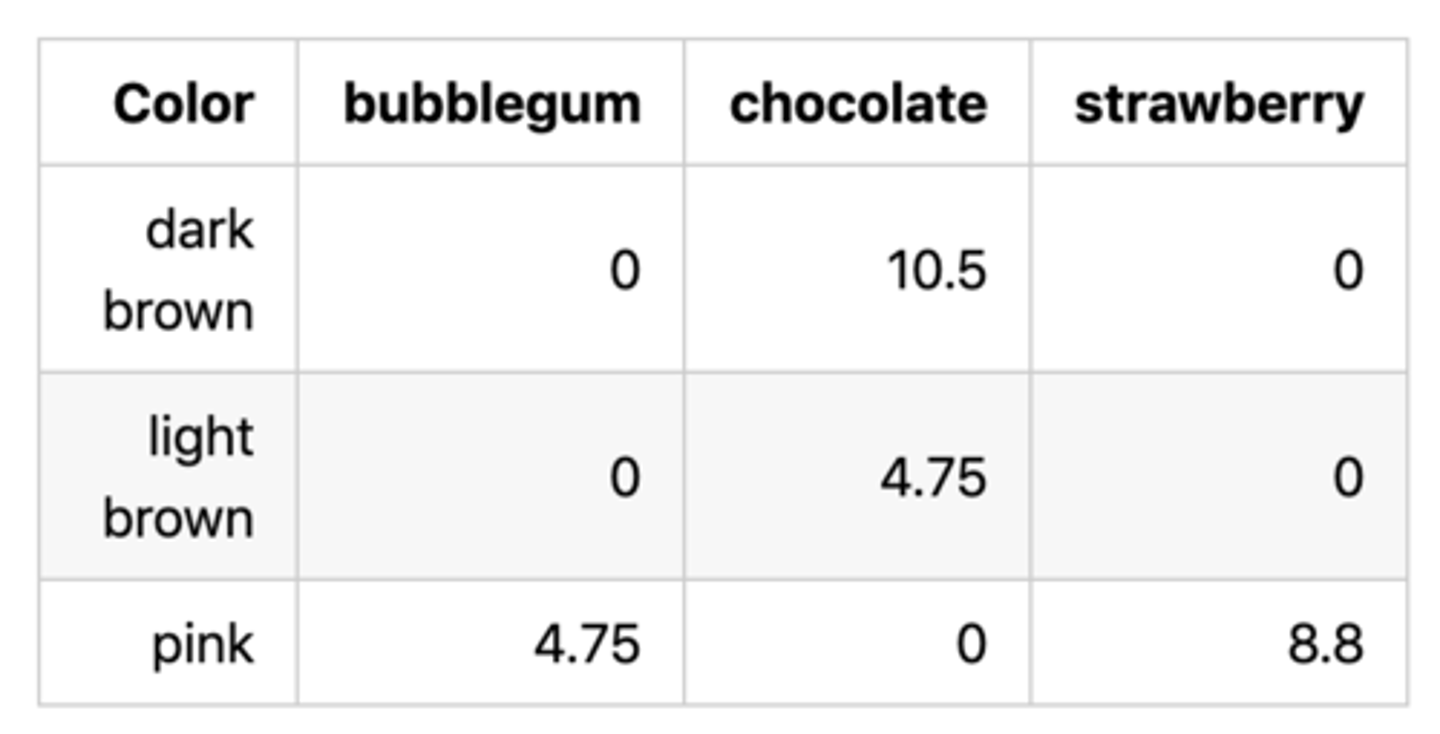
tbl.pivot(col1, col2, values, collect)
(tbl.pivot(co1, col2))
-Table method where it groups together rows that share a combination of values, and organizes the resulting values in a grid.
-The first argument is the label of the column that contains the values that will be used to form new columns
-The second argument is the label of a column used for the rows.
-Optional argument values indicates a column of values that will replace the counts in each cell of the grid.
-The fourth argument collect indicates how to collect them all into one aggregated value
-E.g. more_cones.pivot('Flavor', 'Color', values='Price', collect=sum)
tblA.join(colA, tblB, colB)
(tblA.join(colA, colB))
-Table method that generates a new table with the columns of tblA and tblB, containing rows for all values of a column that appear in both tables.
-Default colB is colA. ColA and colB must be strings specifying column names.
np.random.choice(array, n)
(np.random.choice(array))
-Picks one (by default) or some number n of items from an array at random.
-By default, with replacement
np.count_nonzero(array)
Returns the number of non-zero (or True) elements in an array
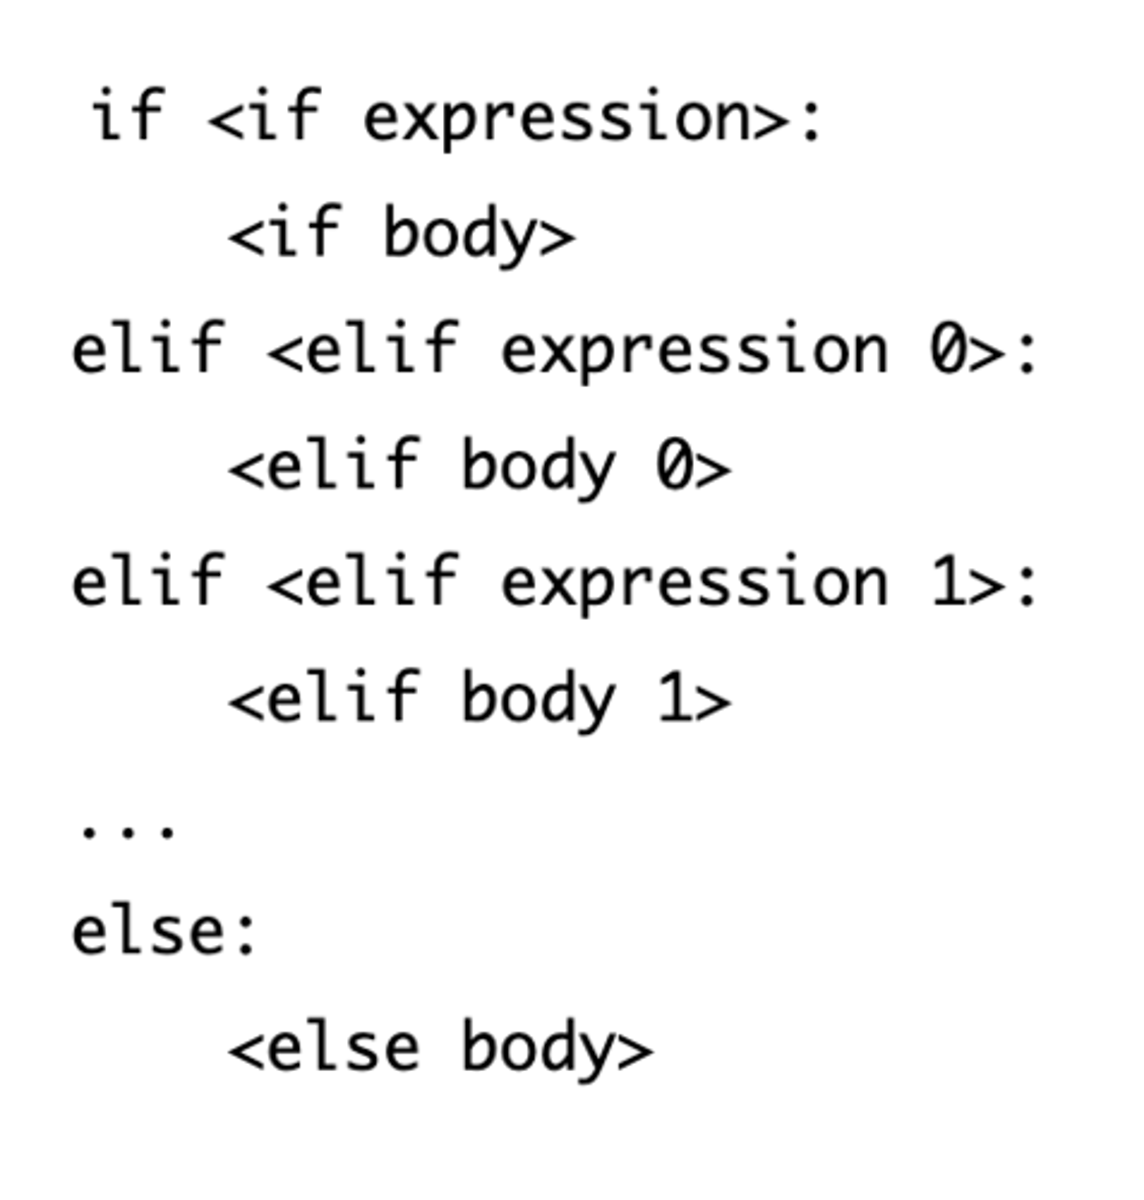
Conditional Statement
-A multi-line statement that allows Python to choose among different alternatives based on the truth value of an expression.
-They appear most often within the body of a function
-Always begins with an if header
-Can add an "elif" clause: shorthand for "else, if"
-else clause is optional: executed only if none of the other header expressions are true.
Iteration
-A for statement
-Begins with the word for, followed by a name we want to give each item in the sequence, followed by the word in, and ending with an expression that evaluates to a sequence.
-Replicates the code inside it, but before each iteration, assigns a new value from the given sequence to the name we chose.
np.append(array, item)
-Returns a copy of the input array with item (must be the same type as the other entries in the array) appended to the end.
-New array that is array augmented by item.
-In for loops, its often used to assign the augmented array to the same name as the original.
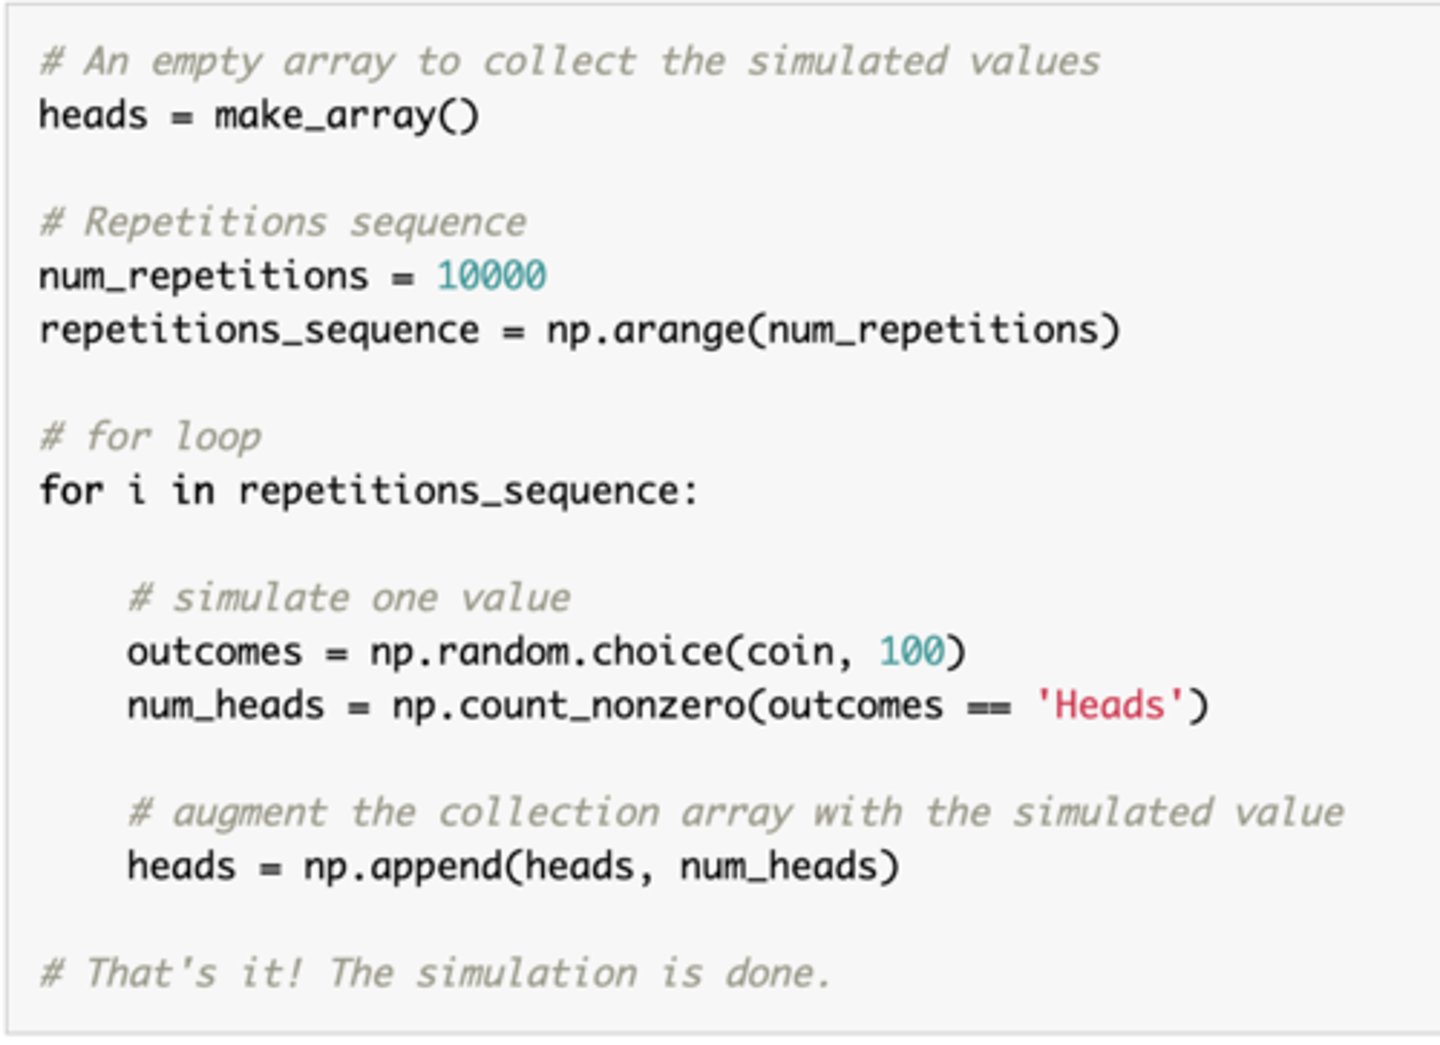
Simulation
Mimicking a physical experiment
1. Create collection array: create an empty array in which to collect all the simulated values.
2. Create a "repetitions sequence", that is, a sequence whose length is the number of repetitions specified. For n repetitions almost always use np.arange(n)
3. Create a for loop. For each element of the repetitions sequence: simulate one value, then augment the collection array with this simulated value.
P(an event doesn't happen)
-The probability that an event doesn't happen
= 1 - P(the event happens)
-E.g. If the chance the event happens is 40%, then the chance it doesn't happen is 60%
P(an event happens)
-The probability when all outcomes are equally likely
= #{outcomes that make the event happen}/#{all outcomes}
P(two events both happen)
-The probability when two events must both happen
= P(one event happens) x P(the other event happens, given that the first one happened)
P(an event happens) (addition rule)
-The probability when an event can happen in two different ways
= P(first way it can happen) + P(second way it can happen)
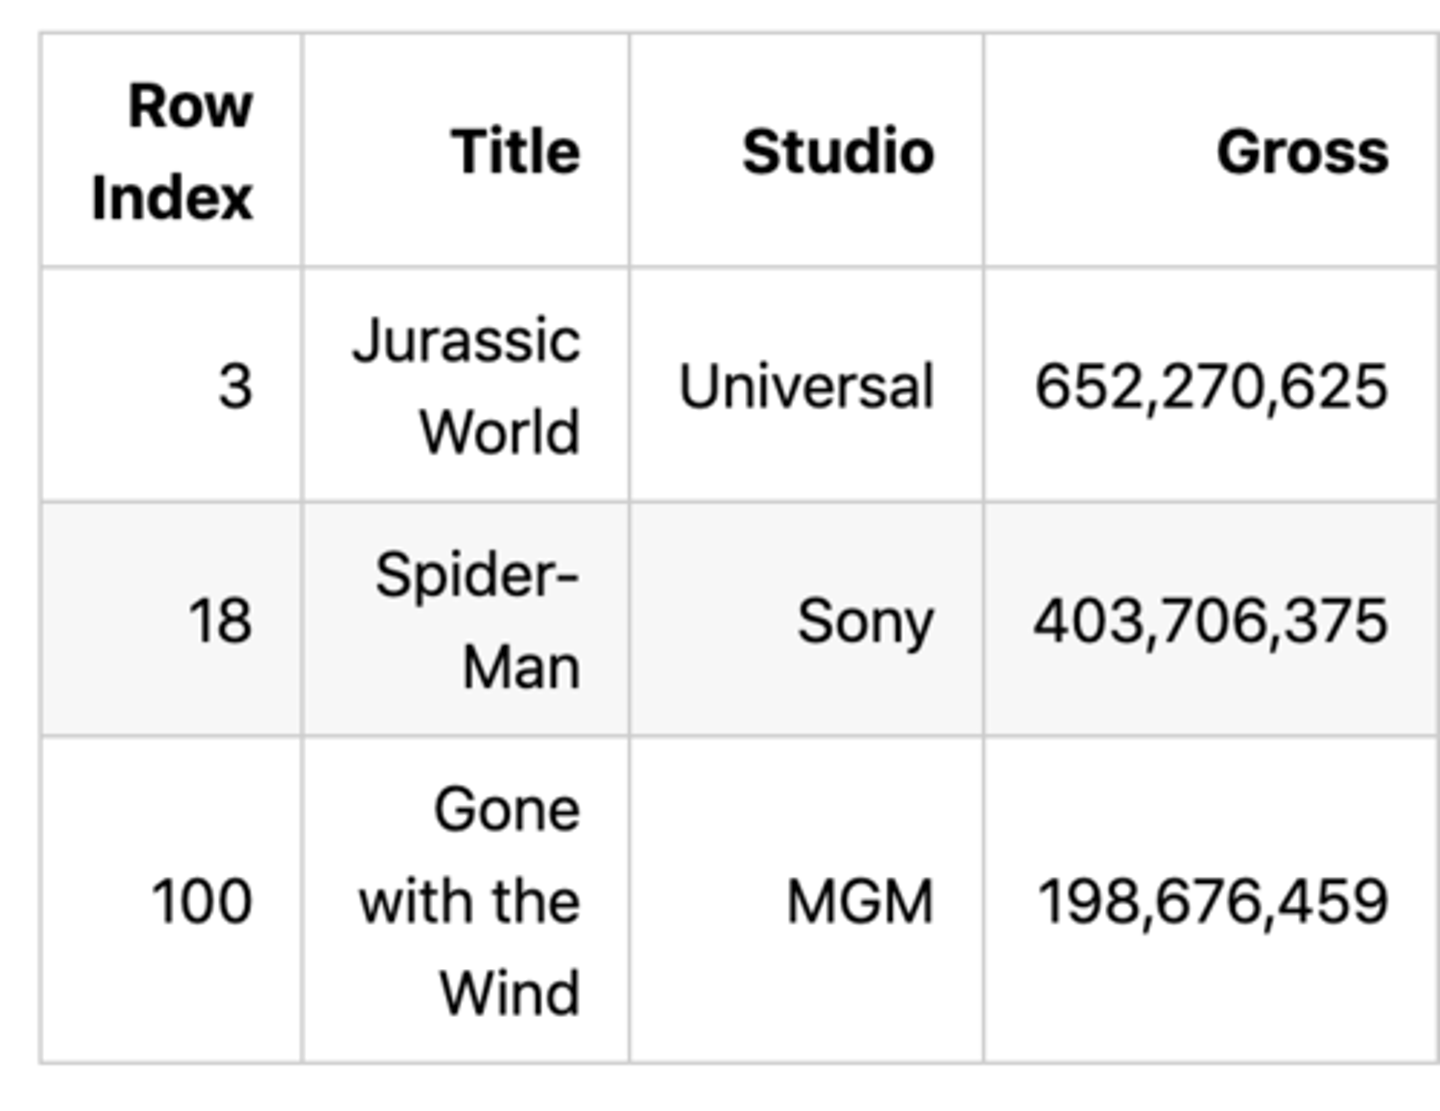
Deterministic sample
-Specifying which elements of a set you want to choose, without any chances involved.
-Not random samples.
-E.g. top.take(make_array(3, 18, 100))
Population
The set of all elements from whom a sample will be drawn
Probability sample
-A technique in which sample from a larger population are chosen using a method based on the theory of probability.
-All elements need not have the same chance of being chosen.
Systematic sample
-A sample drawn by selecting individuals systematically from a sampling frame
-Starts by choosing a random position early in the list, and then evenly spaced positions after that. The sample consists of the elements in those positions.
-E.g. start = np.random.choice(np.arange(10)) # picking one of the first ten rows at random
top.take(np.arange(start, top.num_rows, 10)) #picking every tenth row after that.
Random sampling with replacement
Once chosen, a score, event, or participant can be returned to the population to be selected again
Random sampling without replacement
Once chosen, a score, event, or participant cannot be returned to the population to be selected again
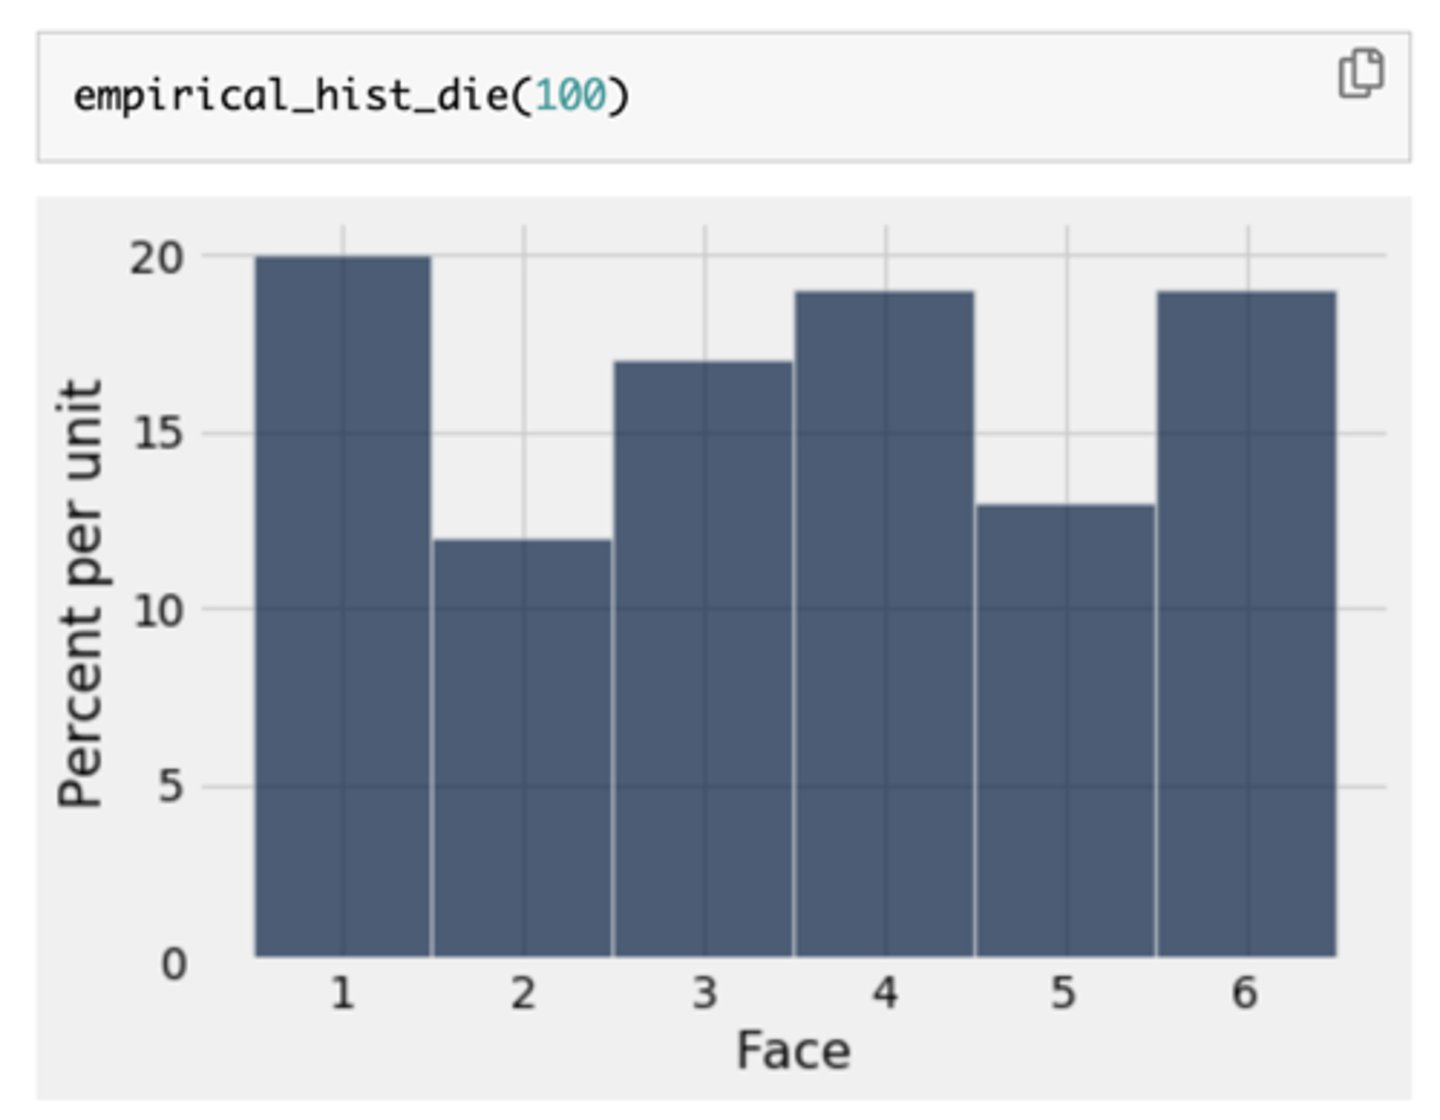
Empirical distributions
-Distribution of events that you have actually observed or measured
-E.g. data in random samples
-Can be visualized by empirical histograms: represent the observed distribution of the faces after rolling a dice many times
-If we keep rolling, the histogram is likely to look more like the probability histogram.
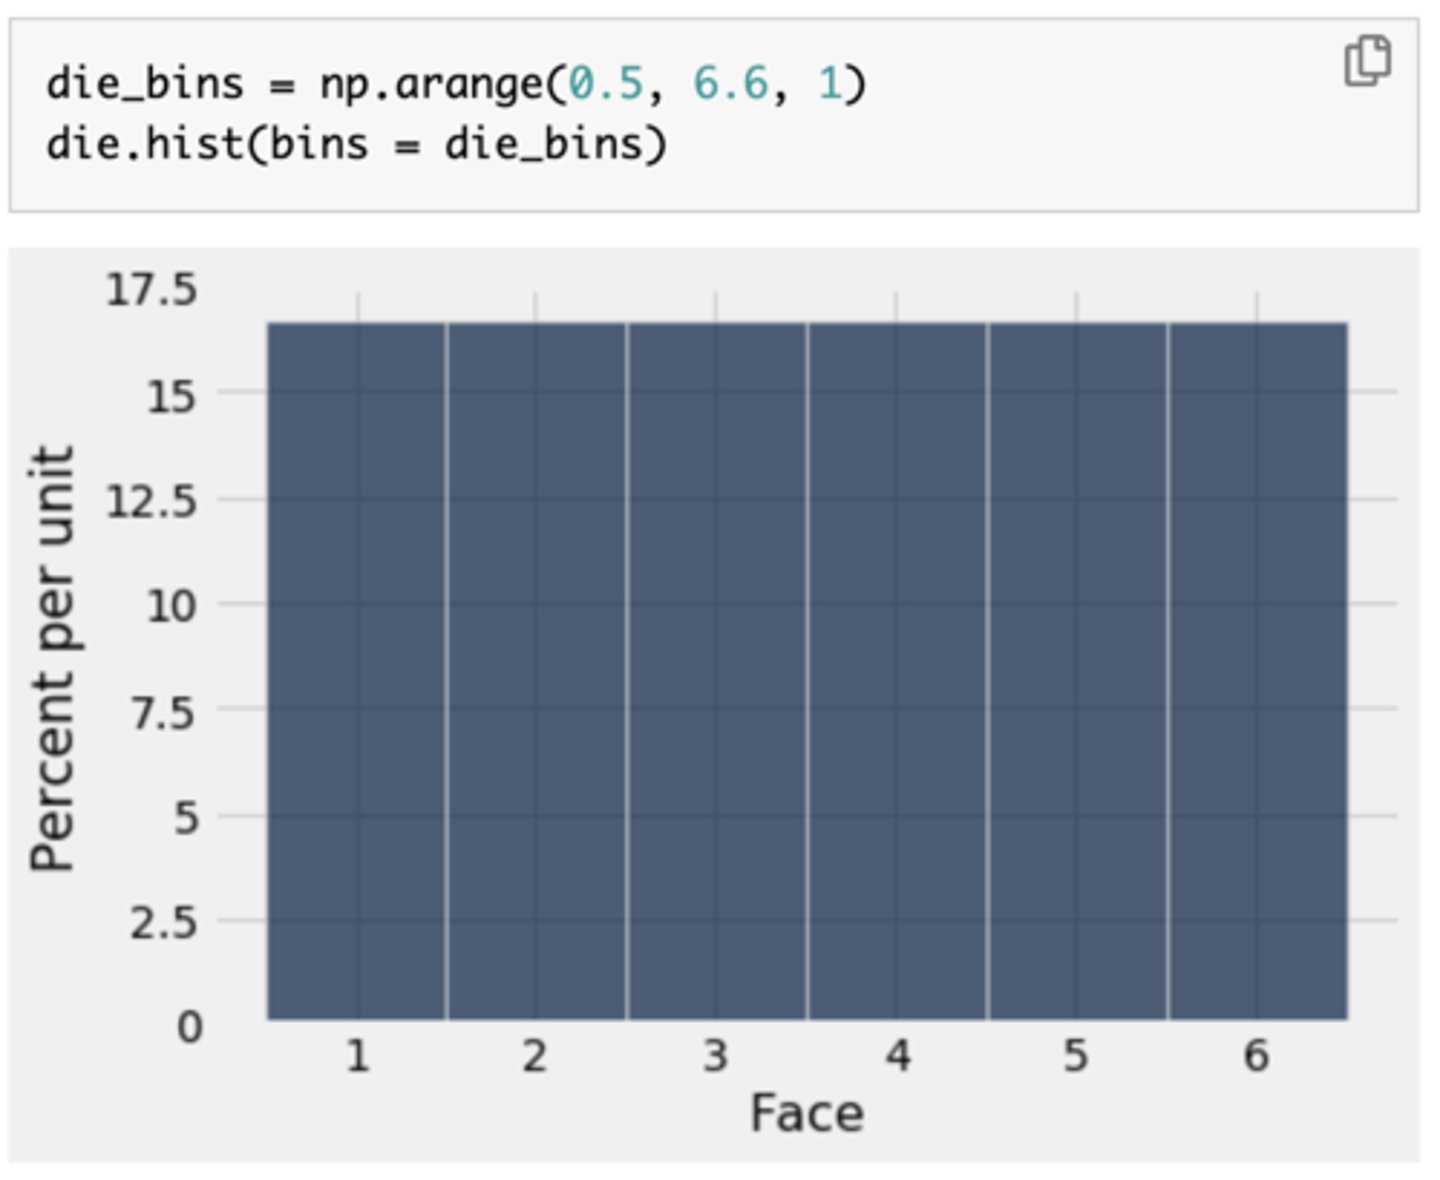
Probability distribution
-List of possible outcomes with associated probabilities
-The probability histogram shows the distribution of probabilities
-In rolling the dice example, since all the bars represent the same percent chance, the distribution is called uniform
tbl.sample(n)
(tbl.sample(n, with_replacement))
-A table method where n rows are randomly sampled from the original table
-By default, n=tbl.num_rows
-Default is with replacement. For sampling without replacement, use argument with_replacement=False.
-For a non-uniform sample, provide a third argument weights=distribution where distribution is an array or list containing the probability of each row.
sample_proportions(sample_size, model_proportions)
-Function that takes two arguments:
1. The sample_size (should be an integer)
2. model_proportions: an array of probabilities that sum to 1.
-Returns an array: each item corresponds to the proportion of times that corresponding item was sampled from model_proportions in sample_size draws (should sum to 1)
Total variation distance
-Used to measure the difference between two distributions
-To compute, take the difference between the two proportions in each category, add up the absolute value of all the differences, and then divide the sum by 2.
E.g. sum(np.abs(pred-obs))/2
Null Hypothesis
-A prediction that there is no difference between groups or conditions
-It says that the data were generated at random under clearly specified assumptions about the randomness.
-The "null" reinforces the idea that if the data look different from what this predicts, the difference is due to nothing but chance.
-A hypothesis under which you can simulate data
Alternative hypothesis
The hypothesis that says some reason other than chance made the data differ from the predictions of the model in the null hypothesis.
Test statistic
A statistic whose value helps determine whether a null hypothesis should be rejected
P-value
-The chance, based on the model in the null hypothesis, that the test statistic will be equal to the observed value in the sample or even further in the direction that supports the alternative
-If less than 5%, considered small and the result is called "statistically significant"
-If less than 1%, the result is called "highly statistically significant"
A/B Testing
-Used to decide whether two numerical samples come from the same underlying distribution.