HTHSCI 2S03 - Lecture: Sample Distribution, Estimation (point & interval), & Introduction to Hypothesis Testing
1/45
There's no tags or description
Looks like no tags are added yet.
Name | Mastery | Learn | Test | Matching | Spaced | Call with Kai |
|---|
No analytics yet
Send a link to your students to track their progress
46 Terms
Sampling Distribution
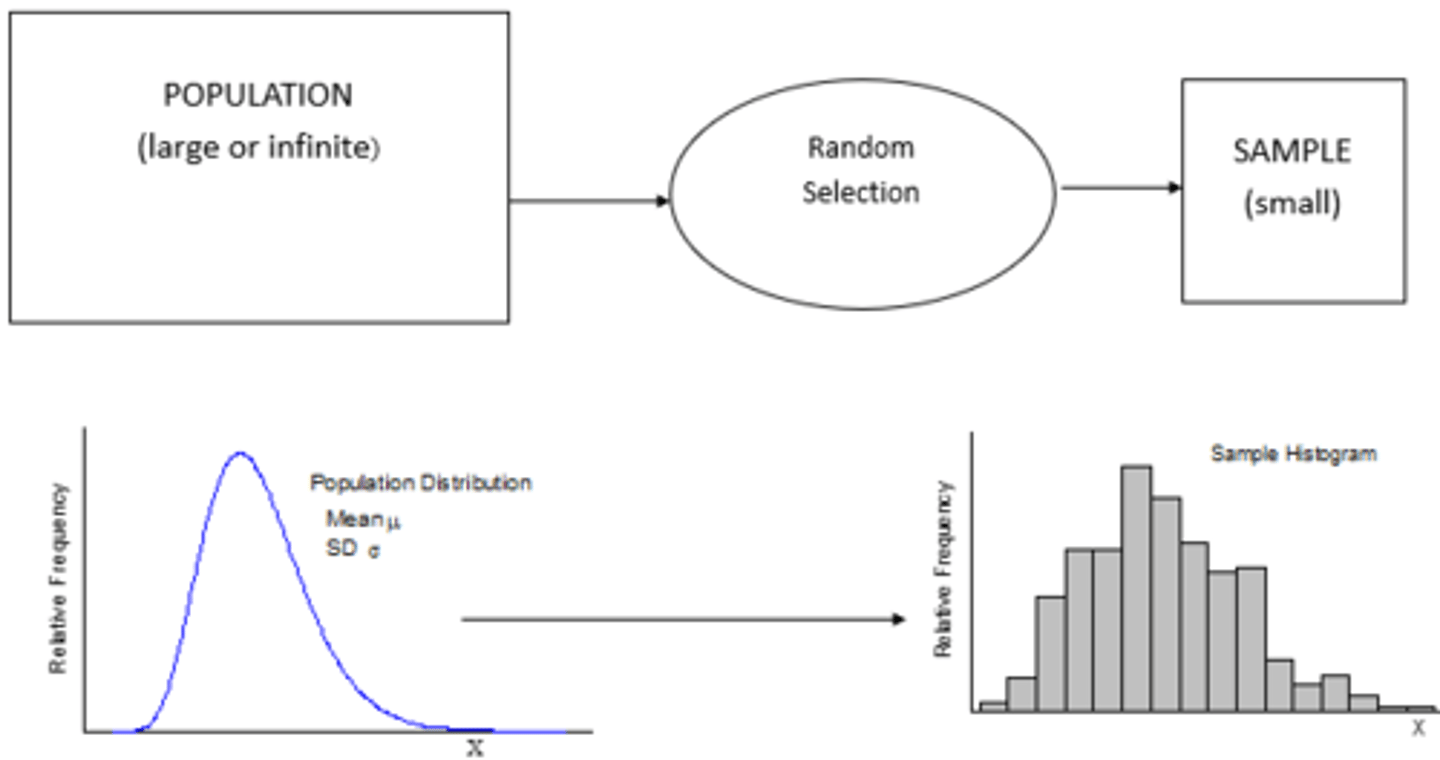
Population vs. Sample
Sampling Distribution
- The distribution of all possible values of a statistic that can be computed from all possible samples of the same size randomly drawn from the same population is called the sampling distribution of that statistic
- We would like to know three things about a given sampling distribution: Mean, variance, and functional form of the distribution (i.e. what its shape looks like)
- If we take specific sample size, from larger population and look at how the mean of these samples are distributed
*How x bar is distributed
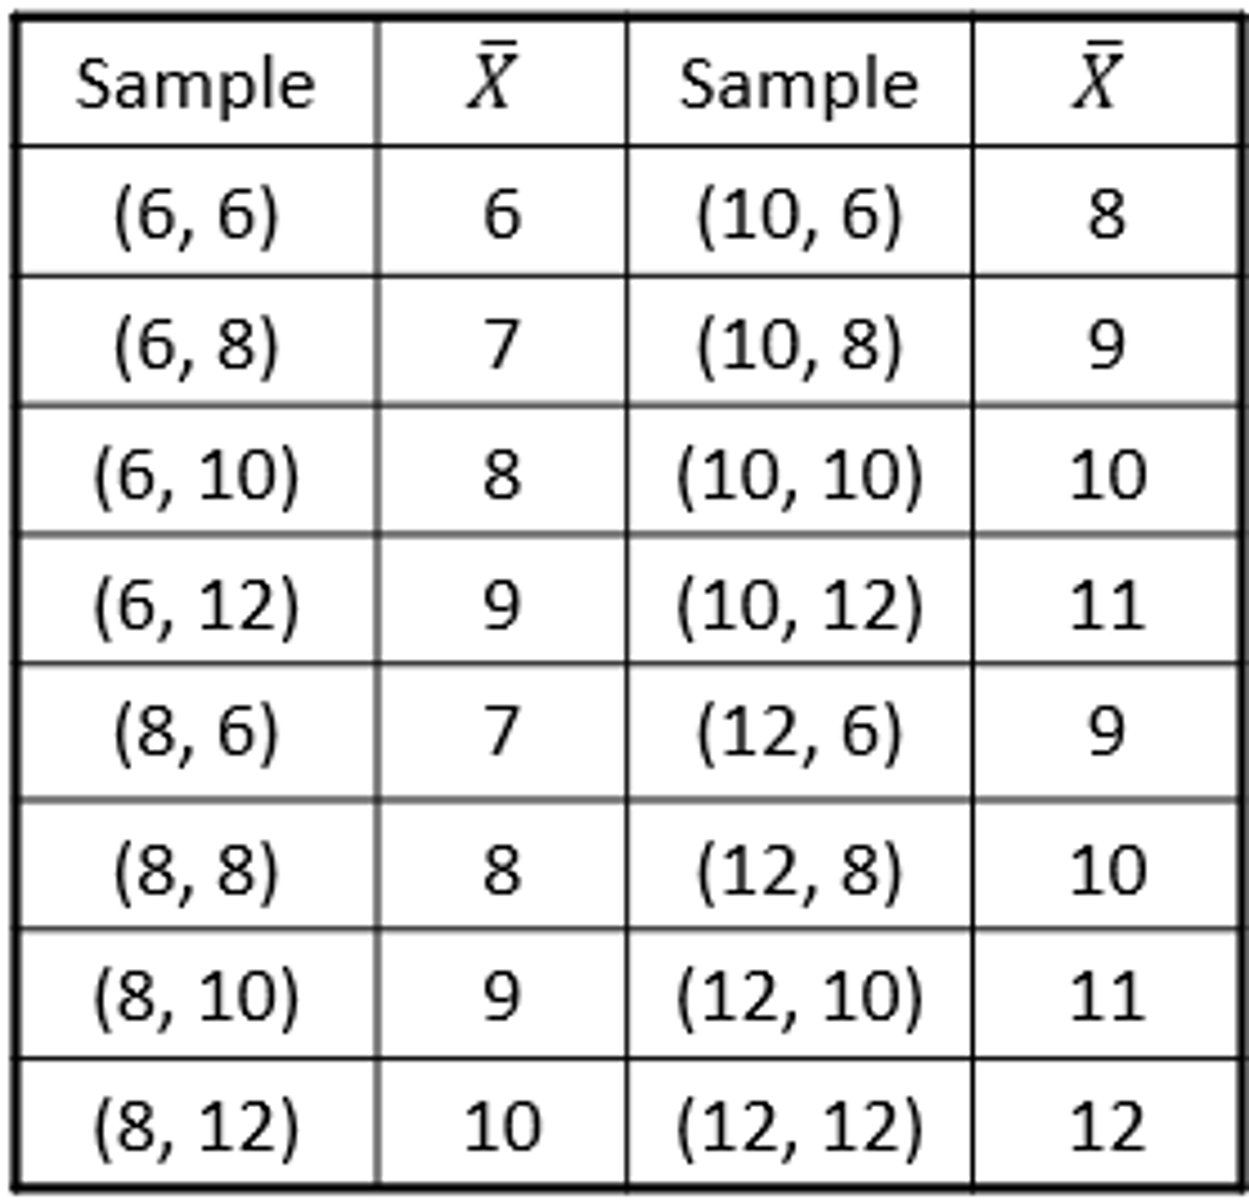
Sampling Distribution - Example
- Suppose we have a population of 4 children aged x1=6, x2=8, x3=10, and x4=12. For this population μ=9 and σ2=5. This table shows all possible samples of size n=2 and their mean values, assuming sampling with replacement
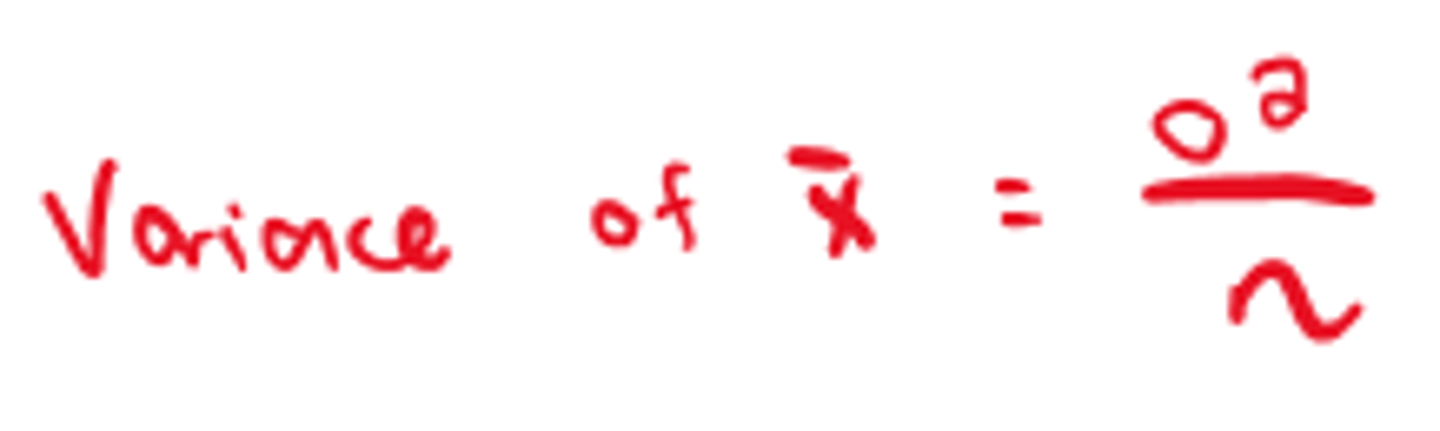
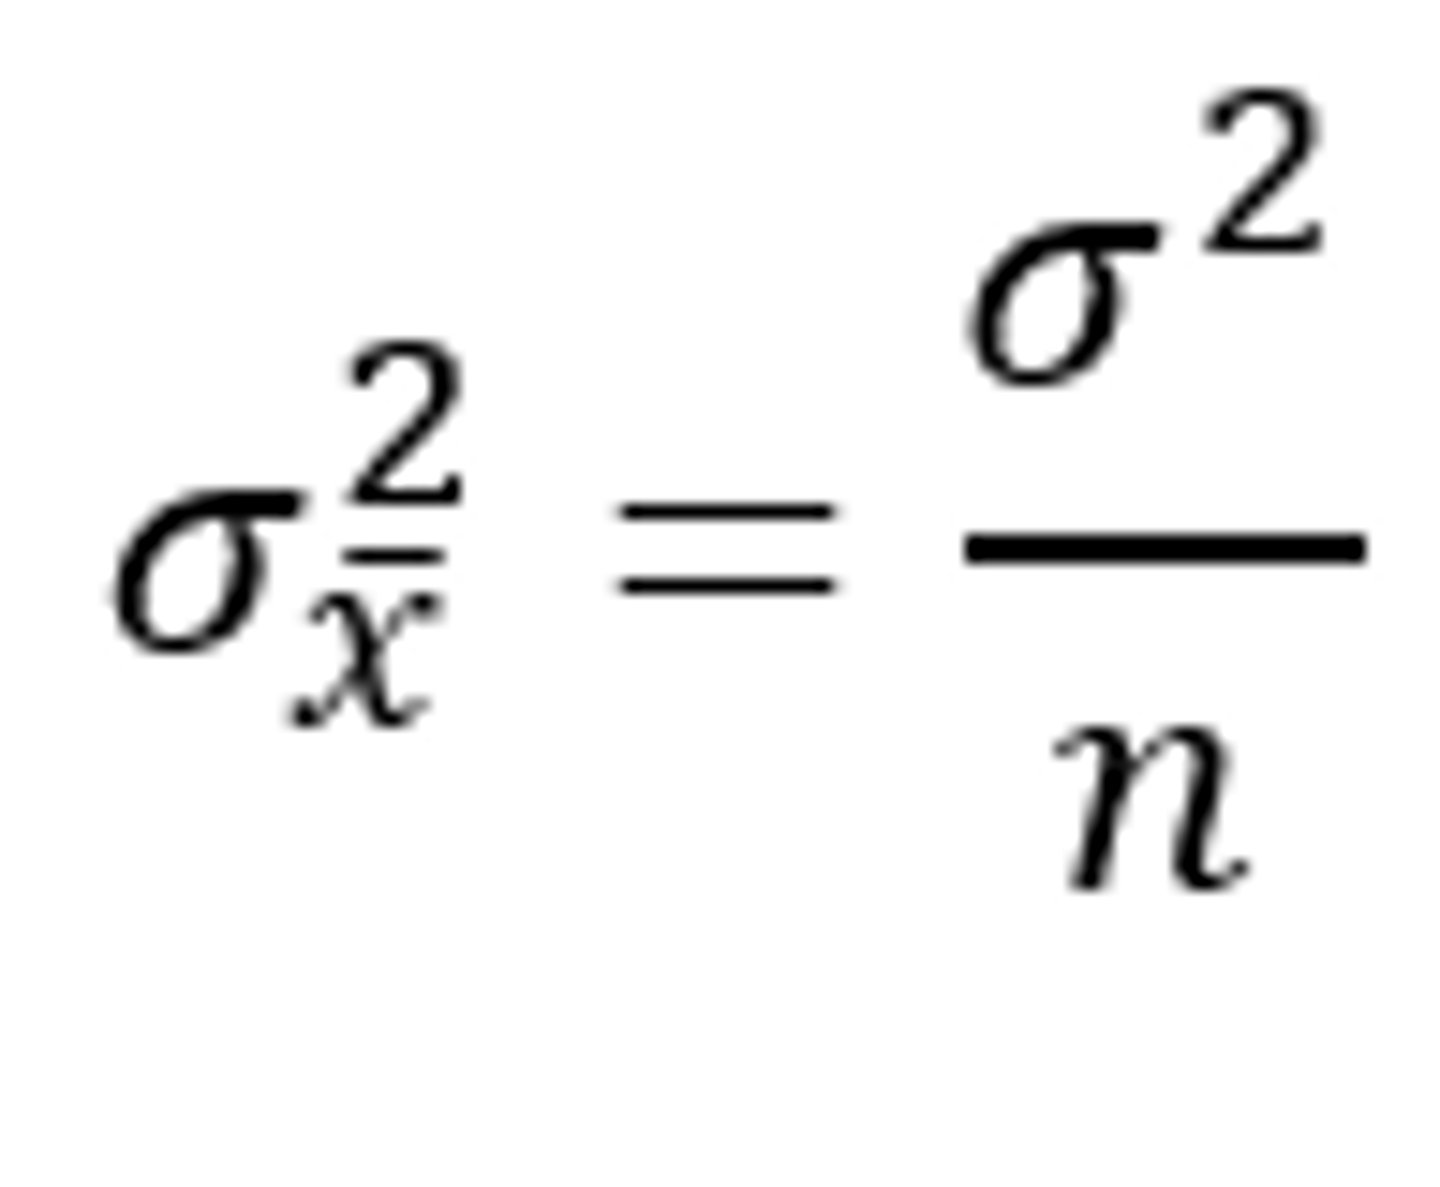
- Mean of these “means” is 9 and their variance is 2.5 (=5/2 = σ2/n)
*Mean of x bar = Mena of population (mew)
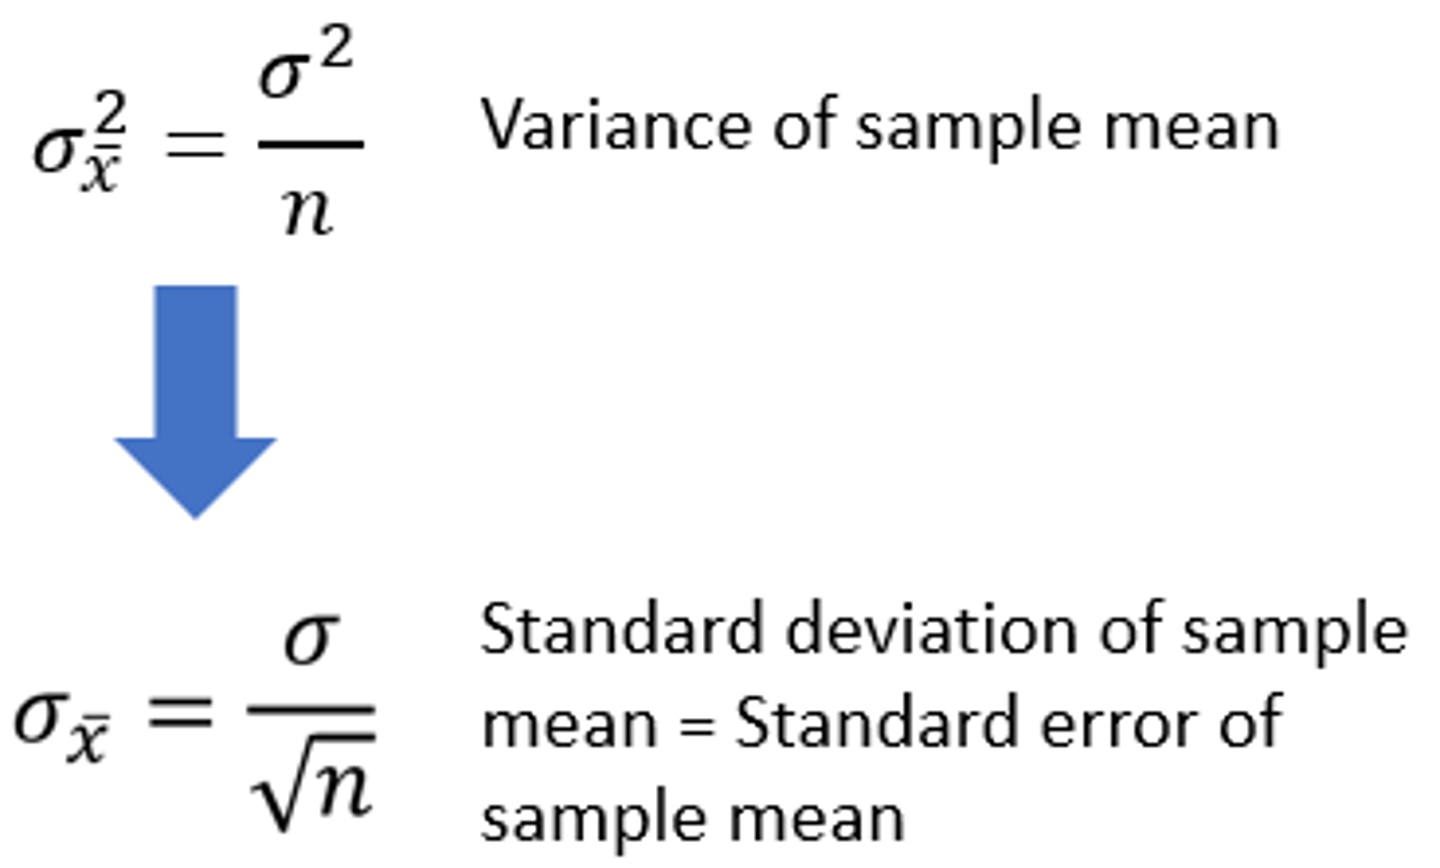
Variance of X Bar
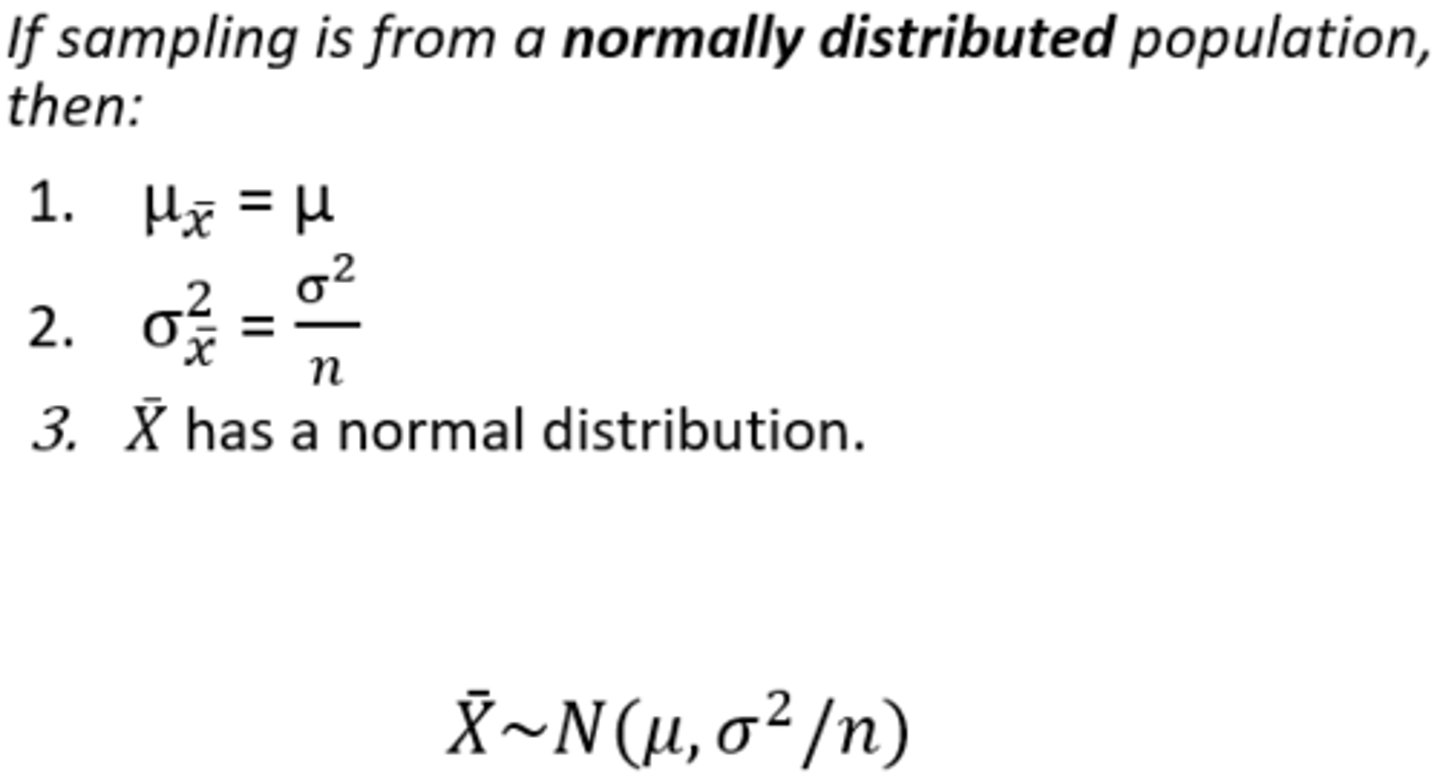
Sampling with Replacement or From an Infinite Population
Sample size doesn't matter
Sampling from a Non-Normally Distributed Population
Sample size greater than or equal to 30

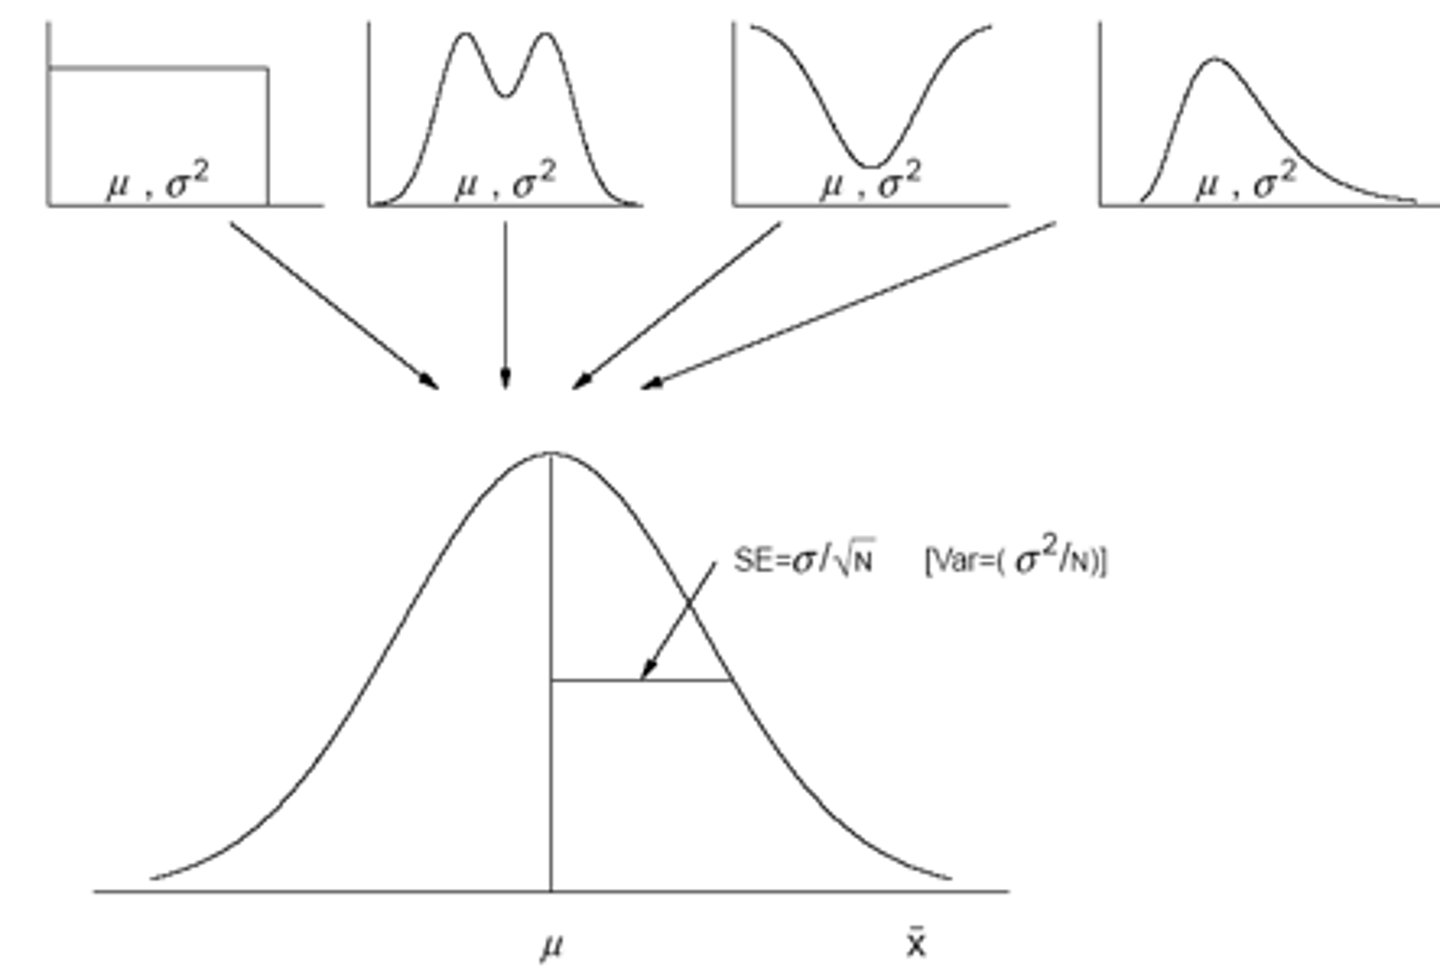
Central Limit Theorem
- Given a population of any non-normal distribution with a mean of μ and variance of σ2, the sampling distribution of the mean, computed from samples of size n from this population will be approximately normally distributed when the sample size is large
Variance vs. Variance of the Mean
- This says the distribution of sample means is tighter than the distribution of the original data
- The distribution of original data includes small and large values, whereas the distribution of means averages out the small and large values
*Larger n, small variance of sample size
Standard Error of the Mean (SEM)
= Standard Deviation of the Mean
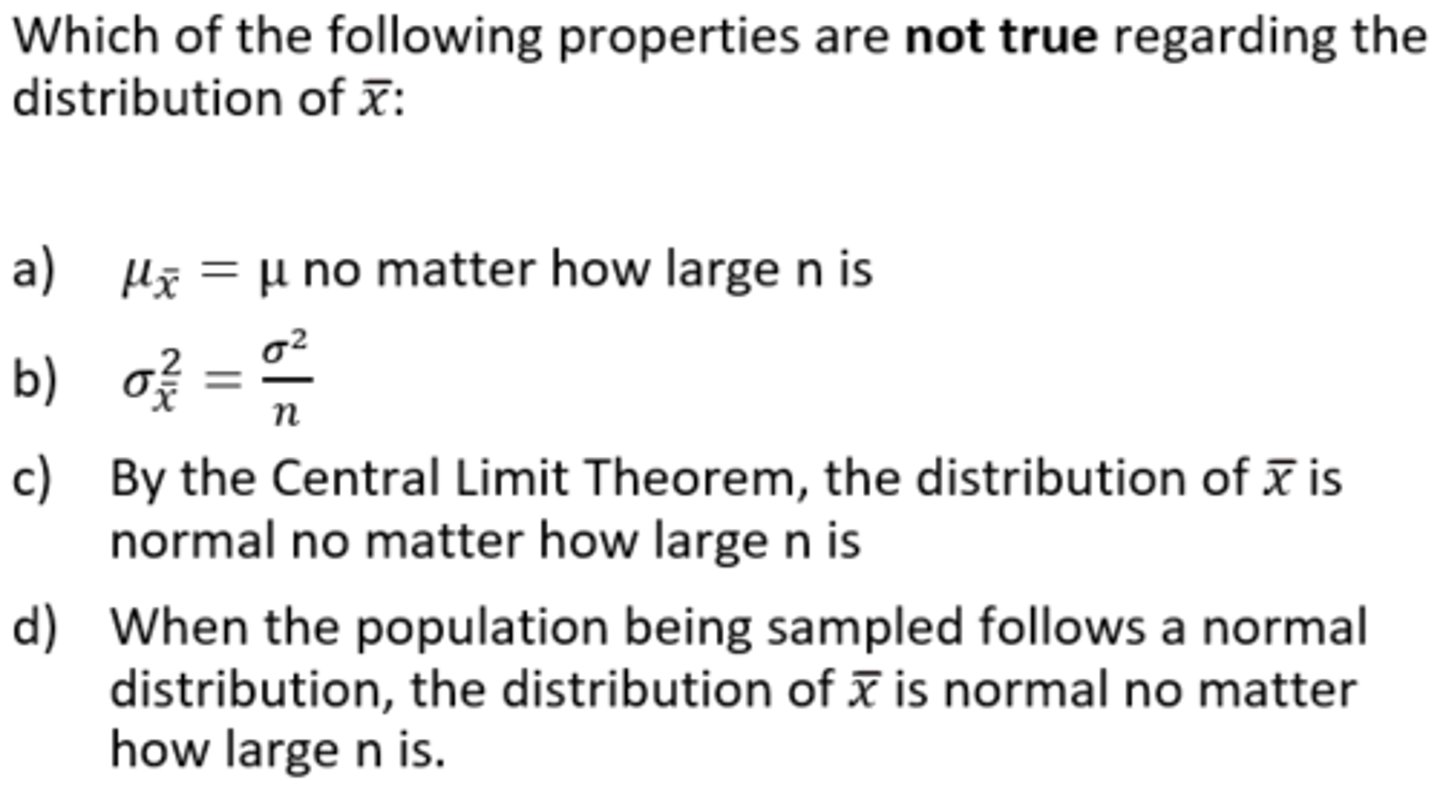
Which of the following properties are not true regarding the distribution of x ̅̅:
Answer = C
Explanation:
- Only normal if standard size is normal
Sampling Distribution of the Mean - Example: Part #1
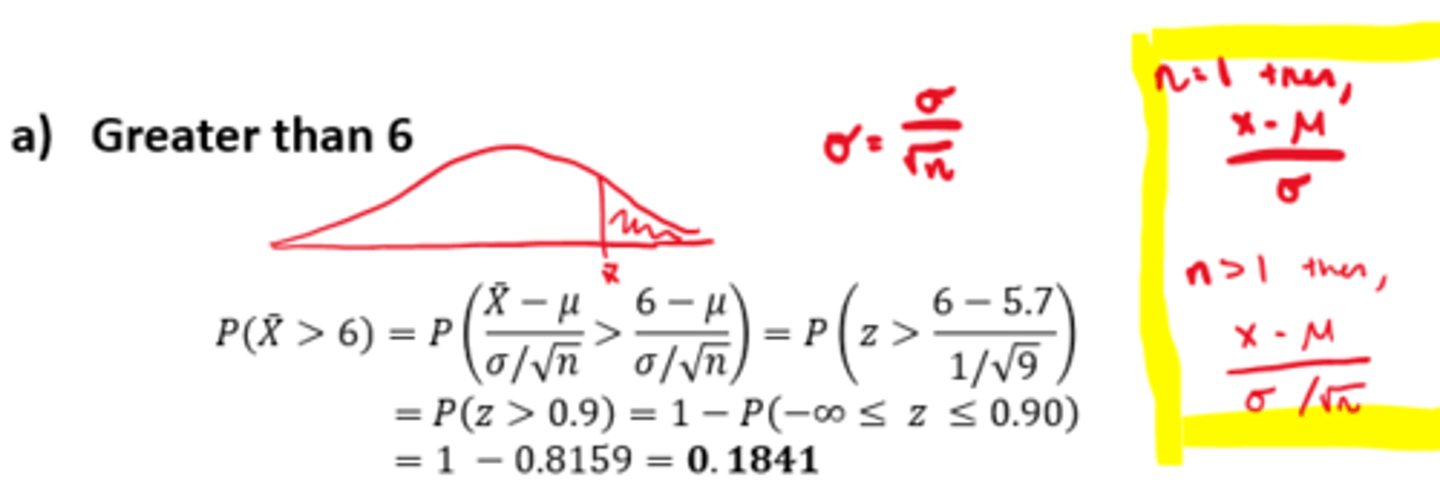
- If the uric acid values in adult males are approximately normally distributed with a mean and standard deviation of 5.7 and 1.0mg percent, respectively, find the probability that a sample of size 9 will yield a mean
Sampling Distribution of the Mean - Example: Part #2
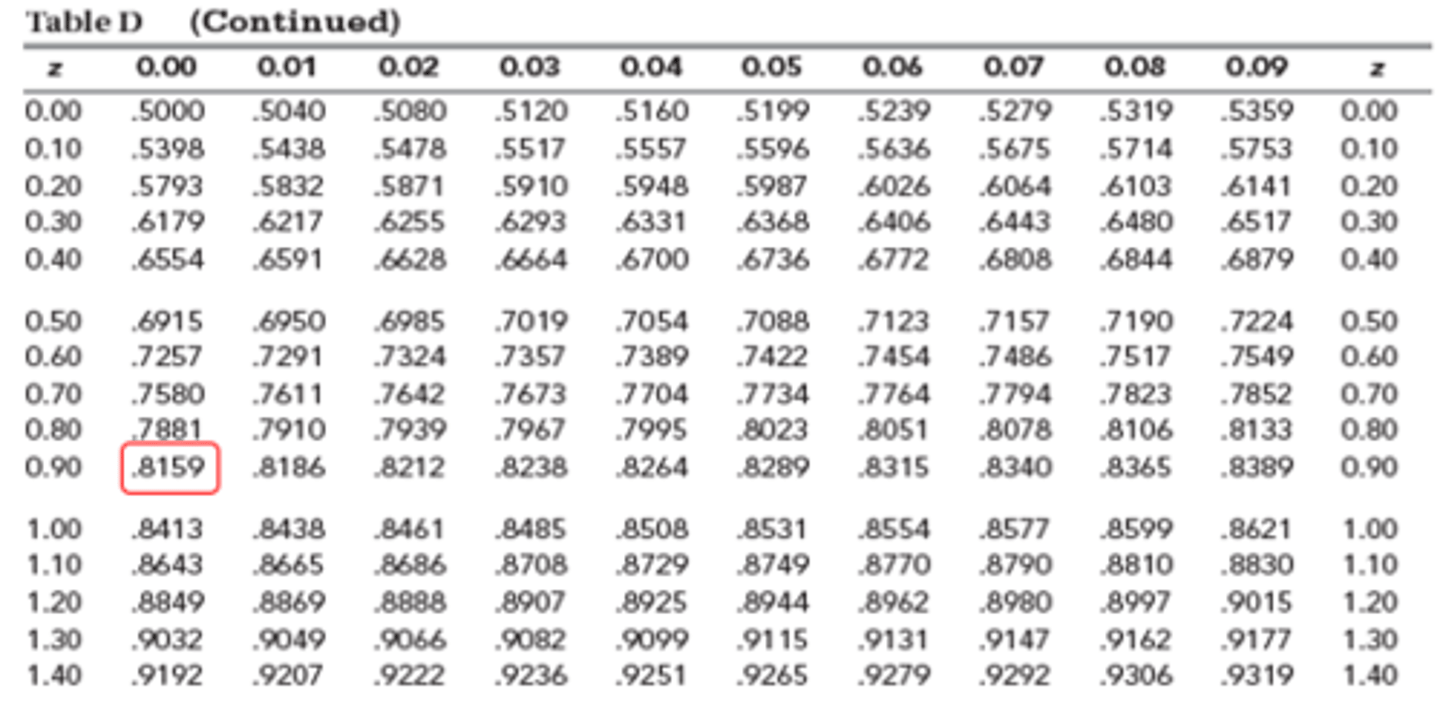
Standard Normal Distribution - P(-∞≤z≤0.90)
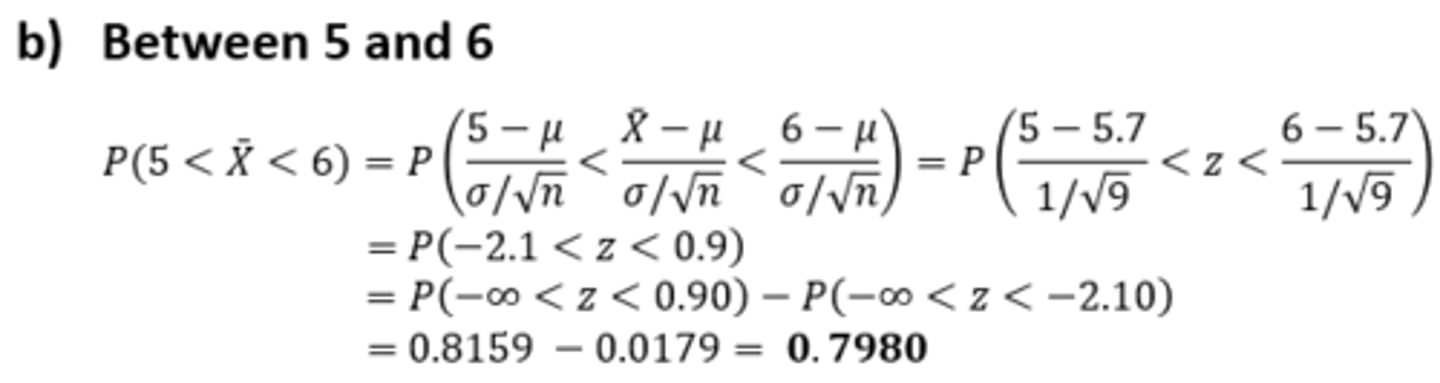
Sampling Distribution of the Mean - Example: Part #3
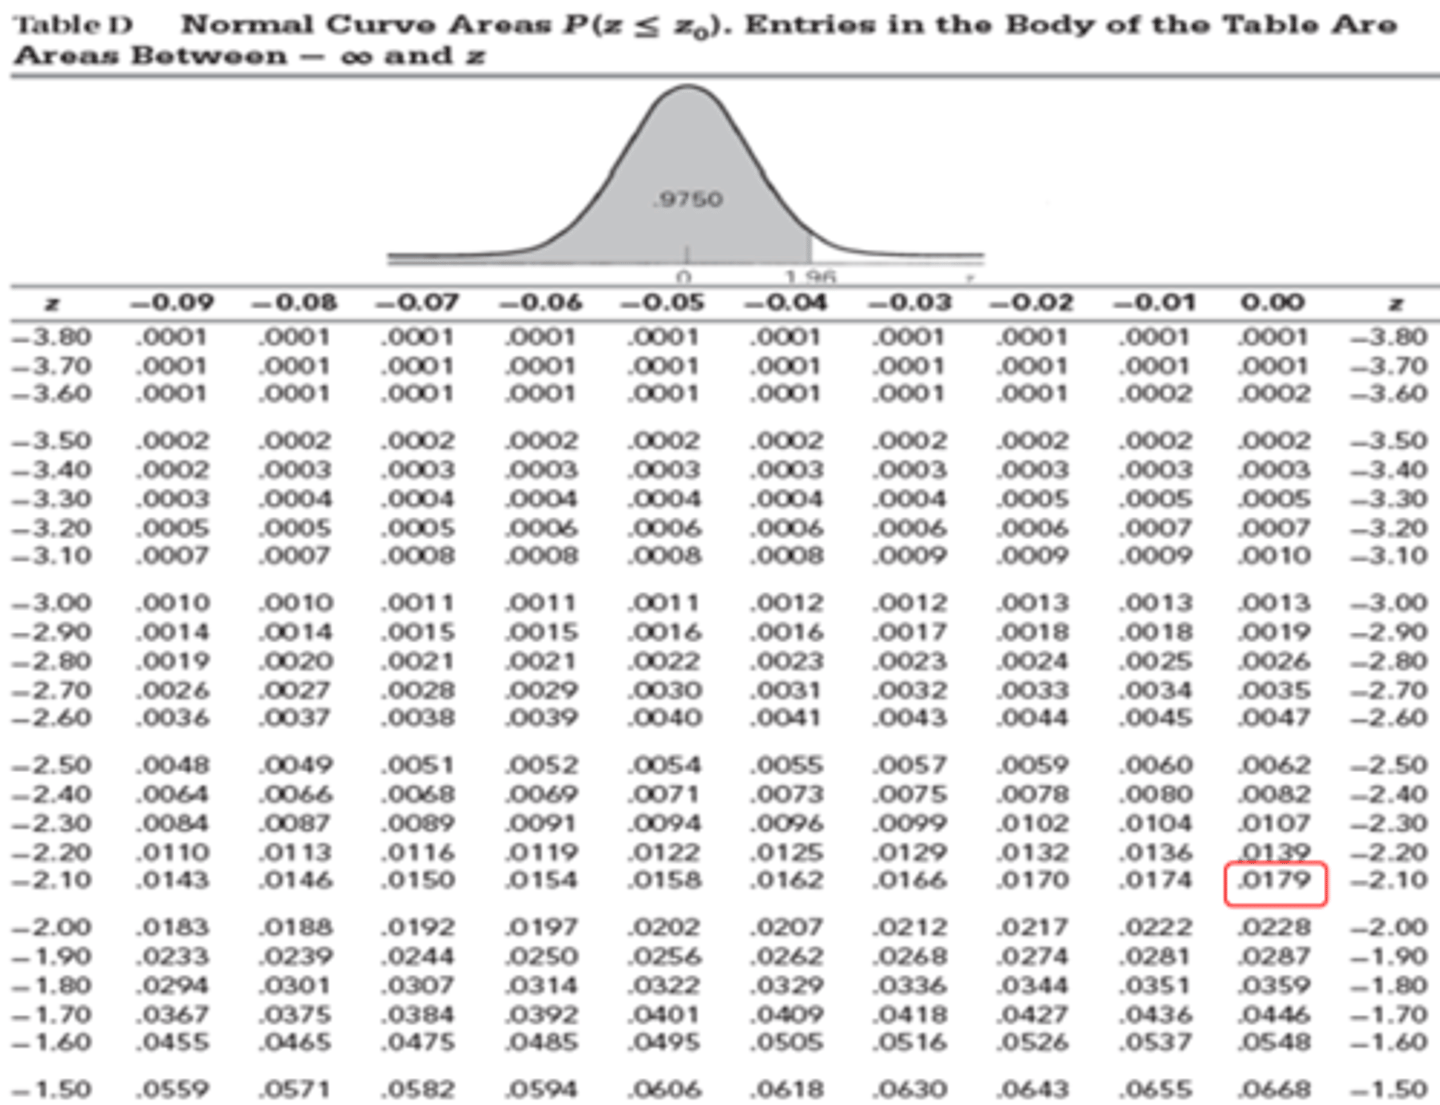
Standard Normal Distribution - P(-∞
Sampling Distribution of the Mean - Example: Part #4
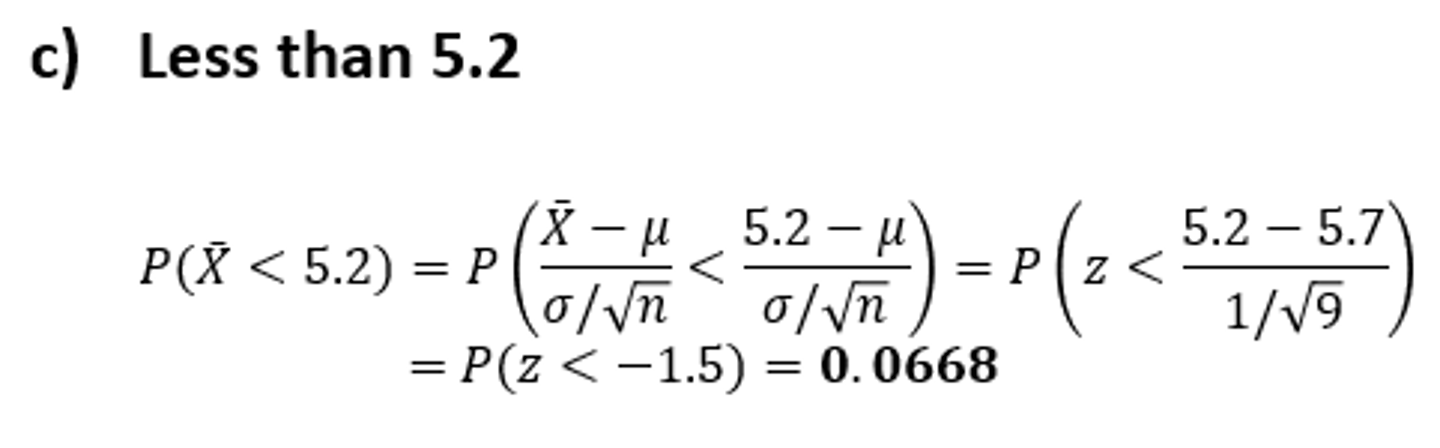
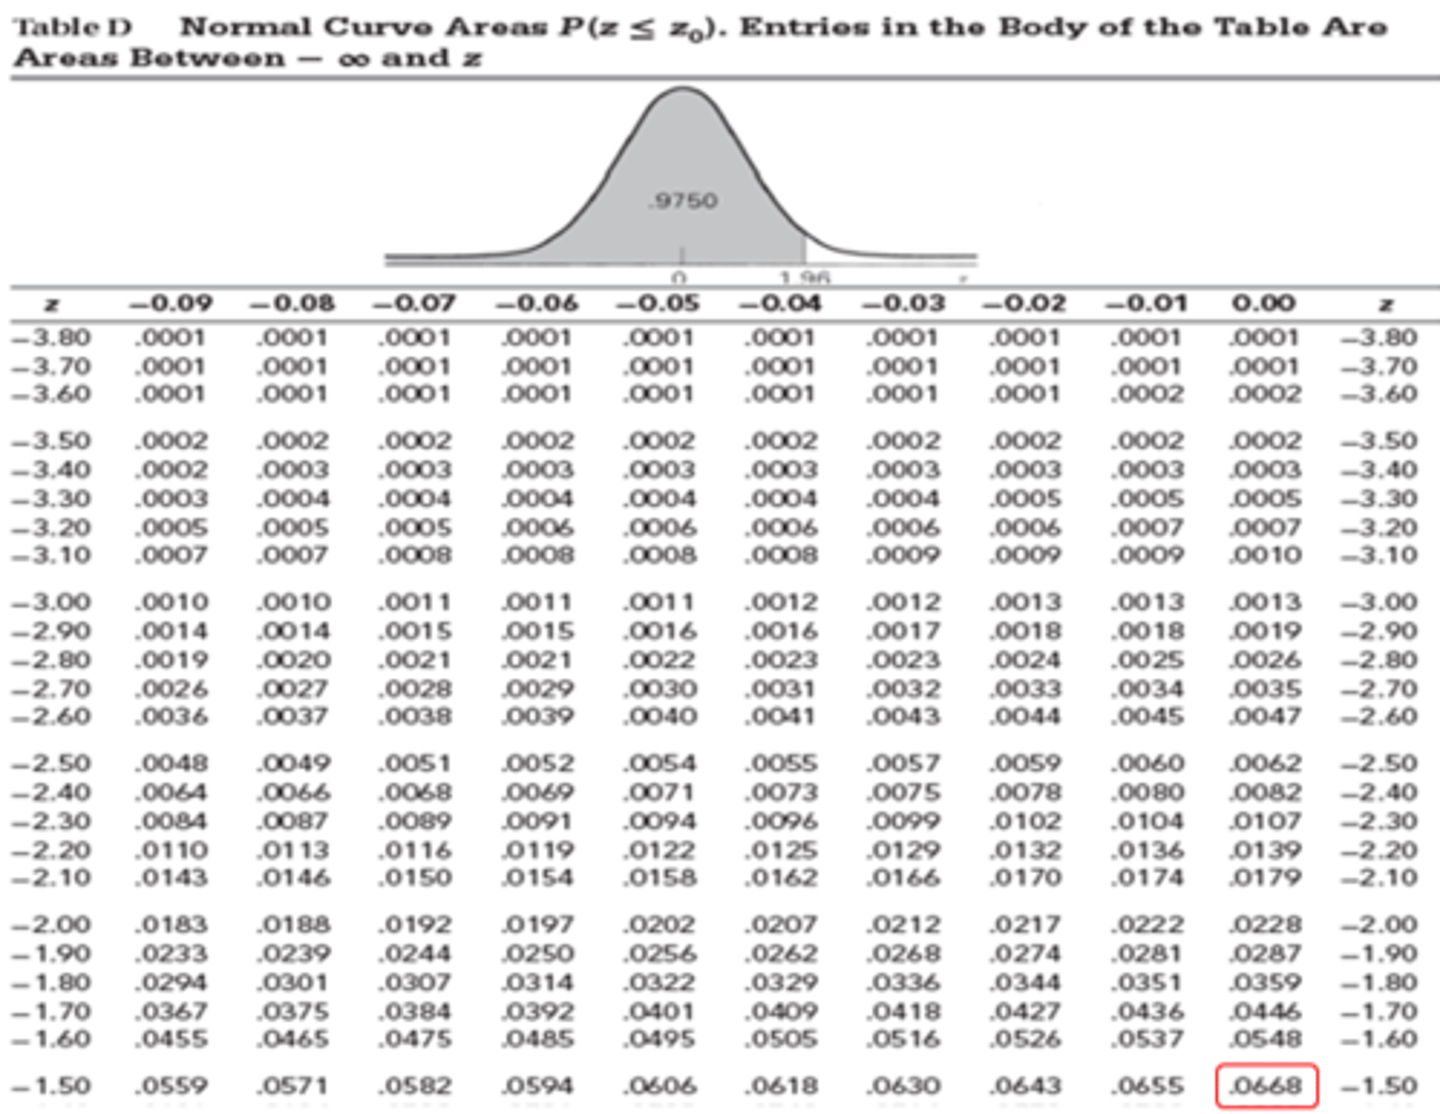
Standard Normal Distribution - P(z<-1.5)
A random sample x1, x2…xn where n=9 is drawn from a population that follows a normal distribution with μ = 10 and σ = 6.
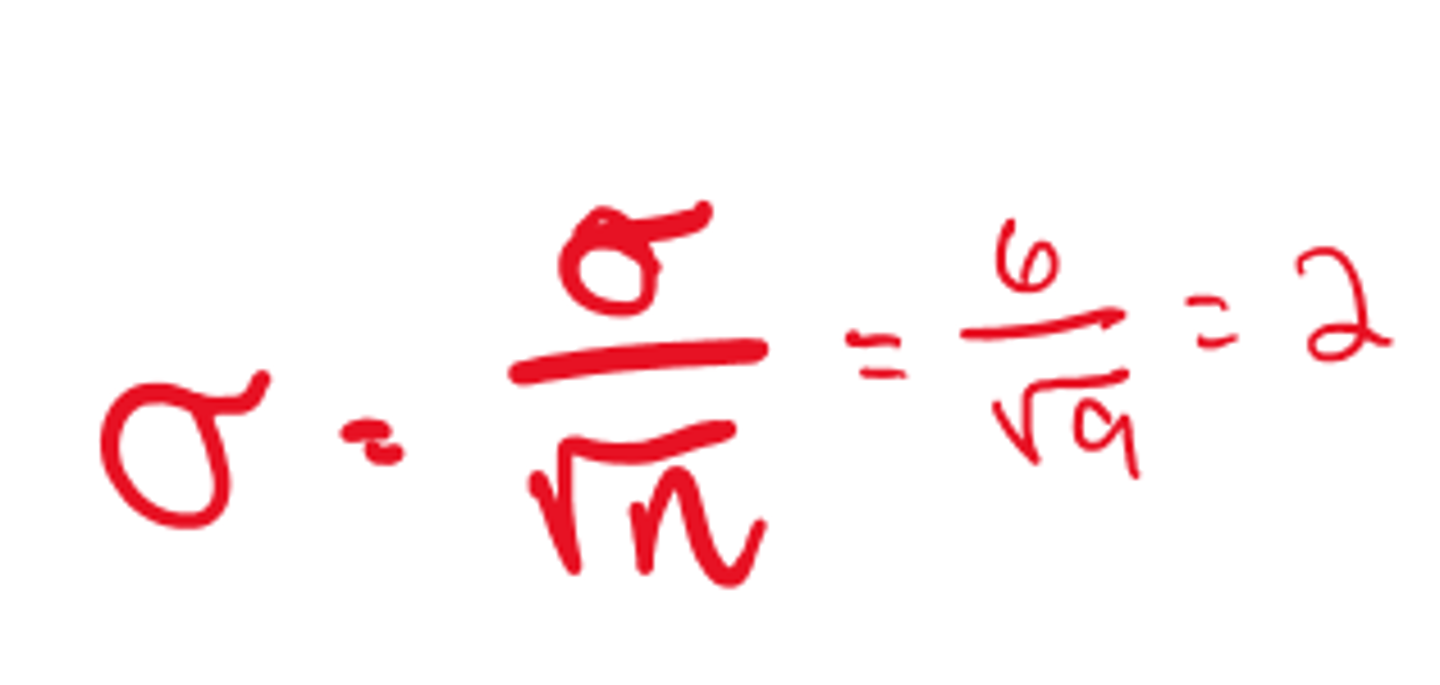
What is the standard error of the sample mean?
a) 10
b) 4
c) 2
d) 1
Answer = C
Estimation (Point Estimates & Confidence Intervals)
Hypothesis
- Defined simply as a claim or statement about one or more populations
Ex.
- The mean age of the cystic fibrosis patients is more than 15 years
- The average length of stay of patients admitted to a hospital is five days
- Drug A is effective in 90% of the cases
Statistical Inference
- The process of drawing conclusions about a population based on the information in a sample
1. Estimation
2. Hypothesis testing
Point Estimate
- A point estimate is a single value used to approximate a population parameter
- Ex. Mean and median
Estimation - Example
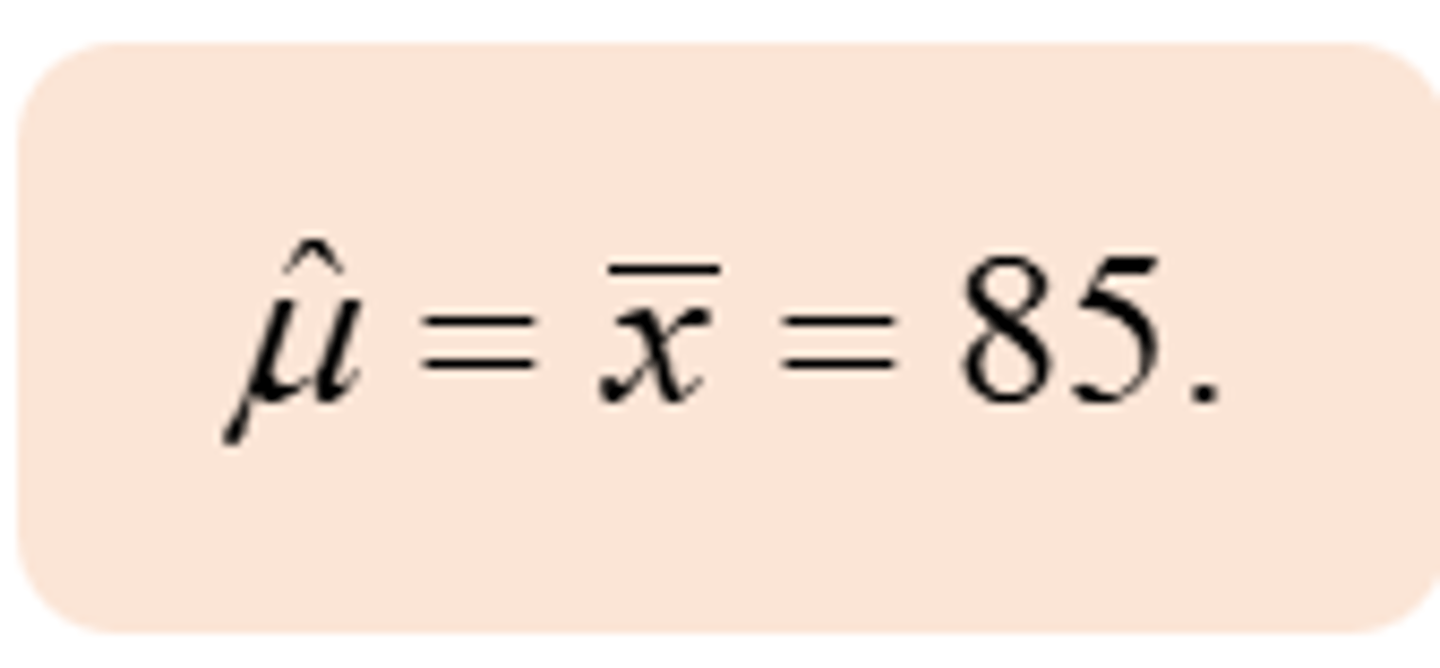
For a random sample of 20 patients the mean heartbeats per minute is 85:
1. What is the point estimate for the mean of the population (μ)?
- The best point estimate for μ is: (in picture)
Interval Estimate
- Consists of two numerical values defining a range, that with a specified degree of confidence, includes the parameter being estimated
- It is usually called a "Confidence Interval"
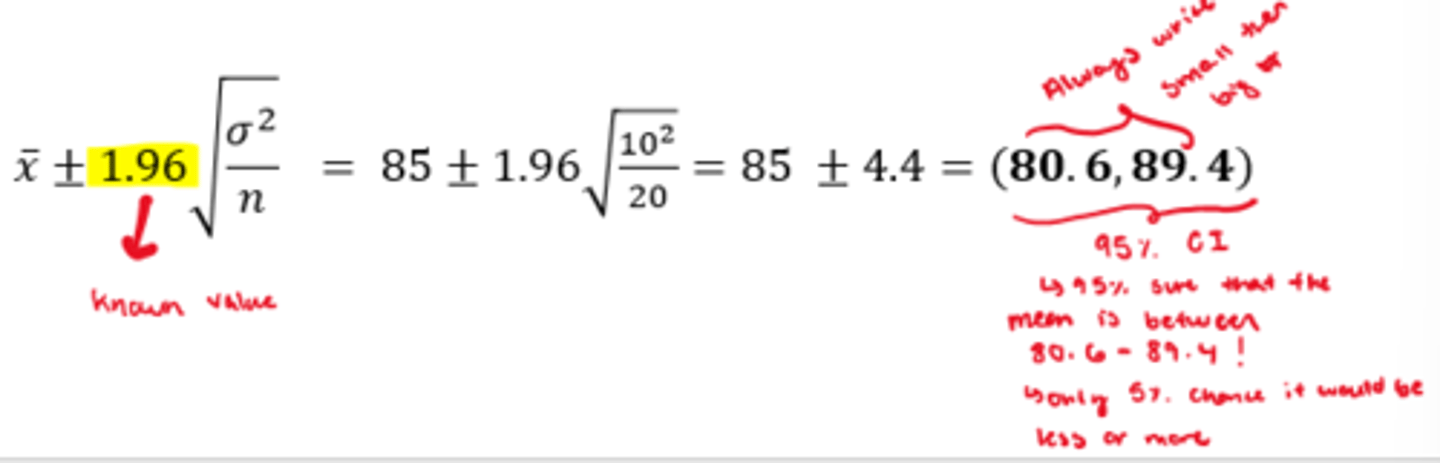
Interval Estimate - Example
For a random sample of 20 patients the mean heartbeats per minute is 85:
1. Assuming the population standard deviation σ=10, the 95% confidence interval for the population mean µ is?
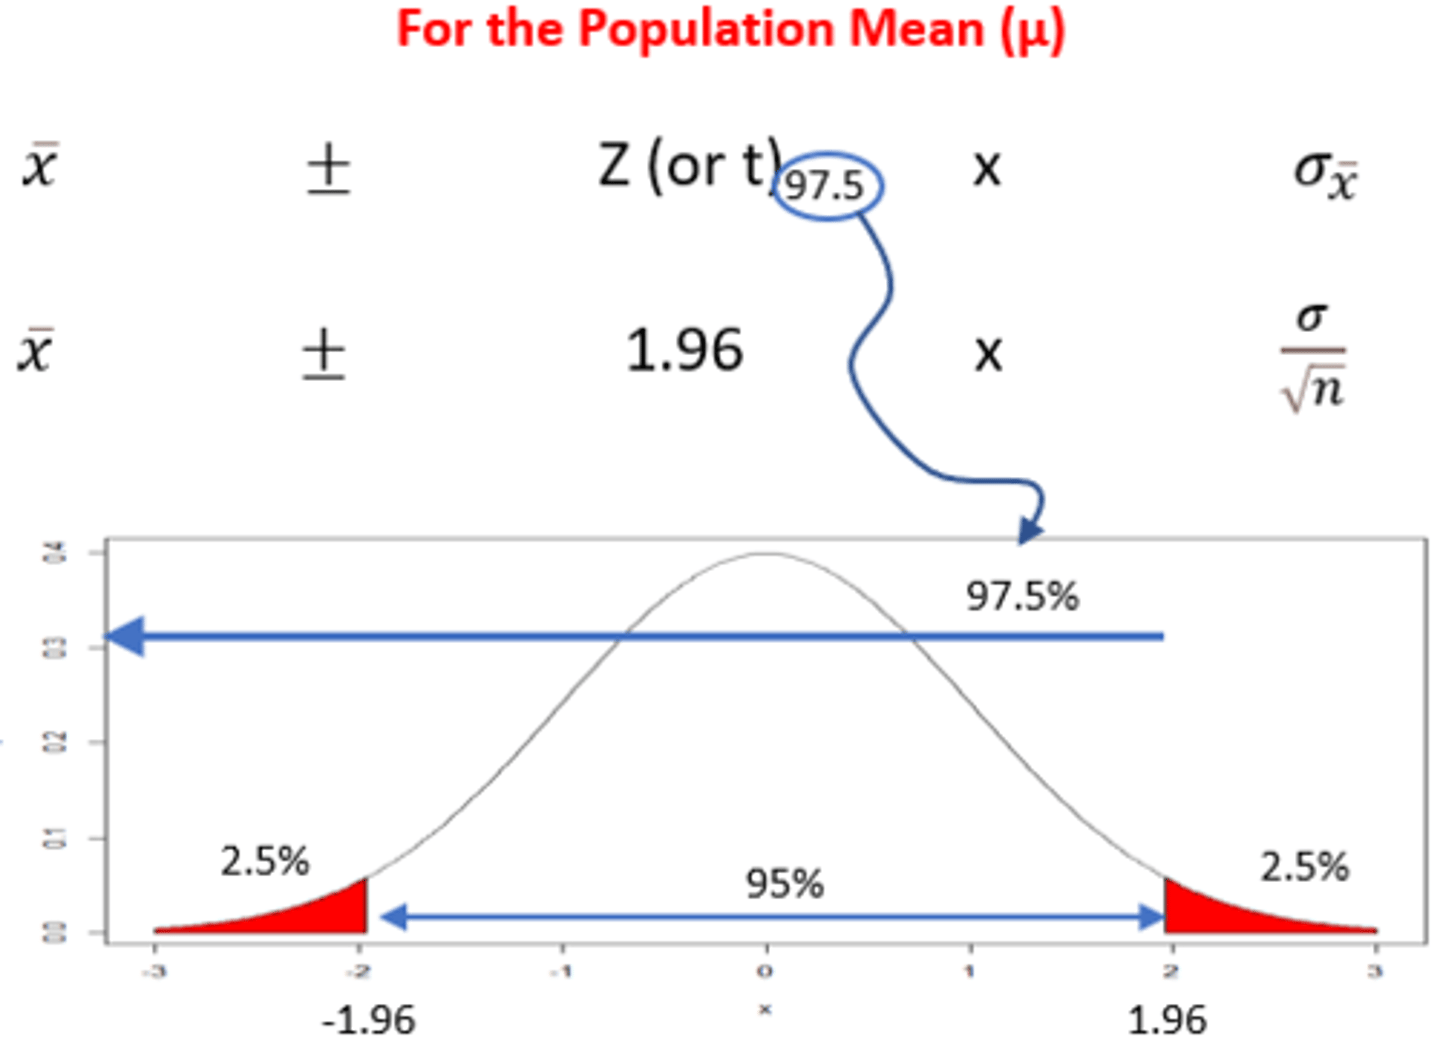
Explanation of a Confidence Interval - Part #1
Explanation of a Confidence Interval - Part #2
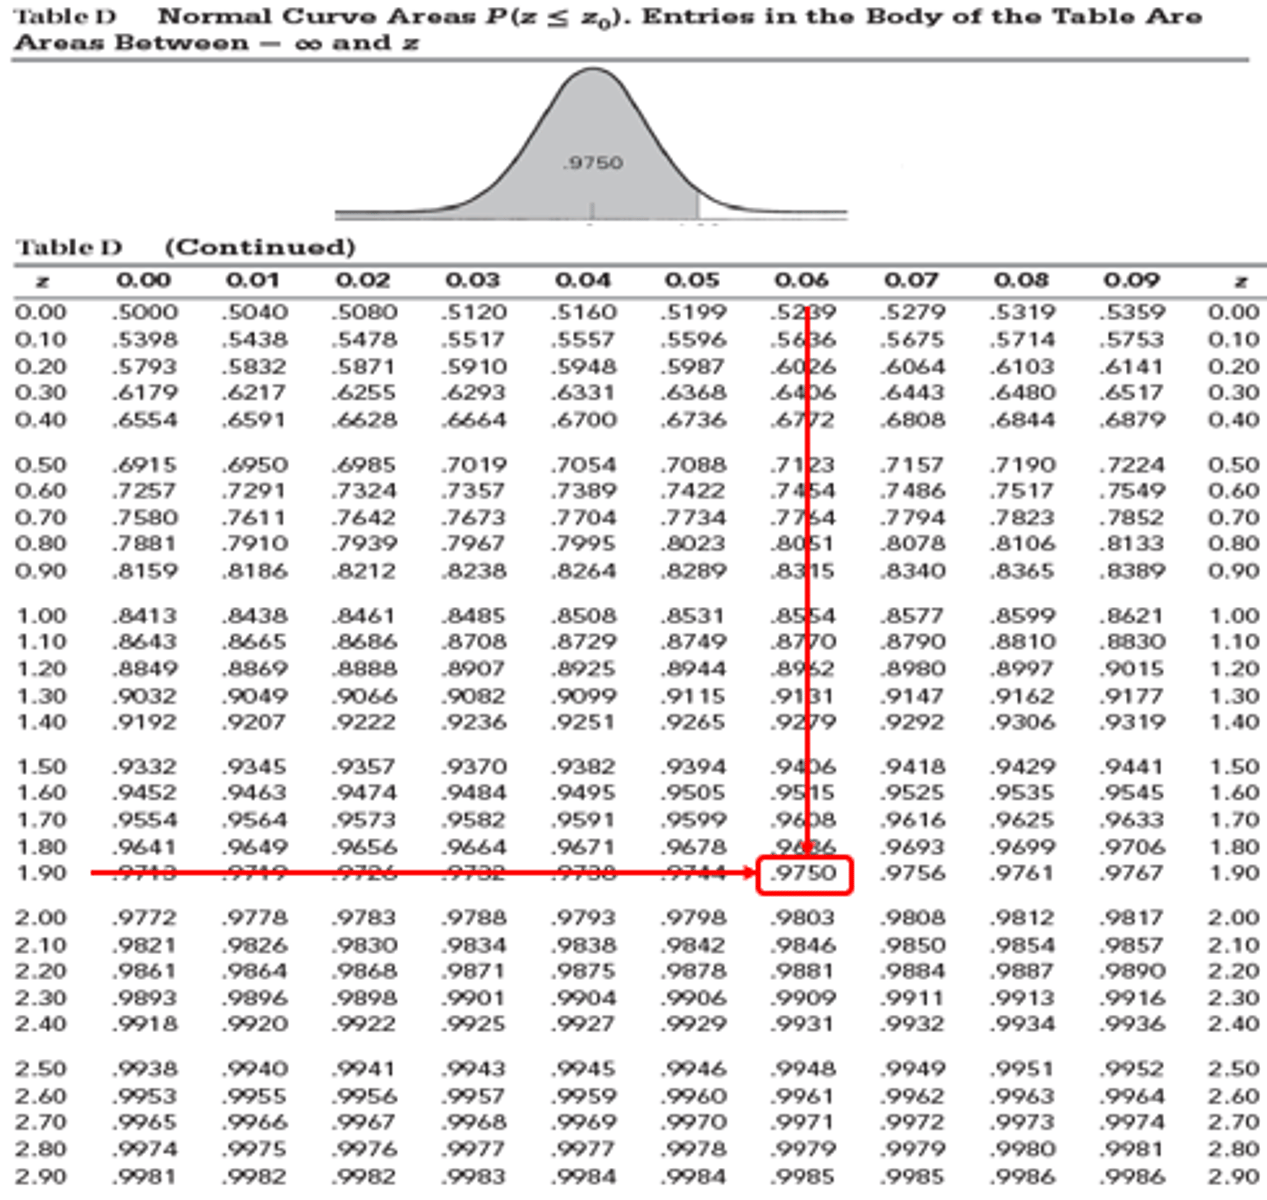
1.96 -> z = 0.975
Standard Normal Distribution - zo
Explanation of a Confidence Interval - Part #3
Interpretations of Confidence Intervals
1. Probabilistic Interpretation
2. Practical Interpretation
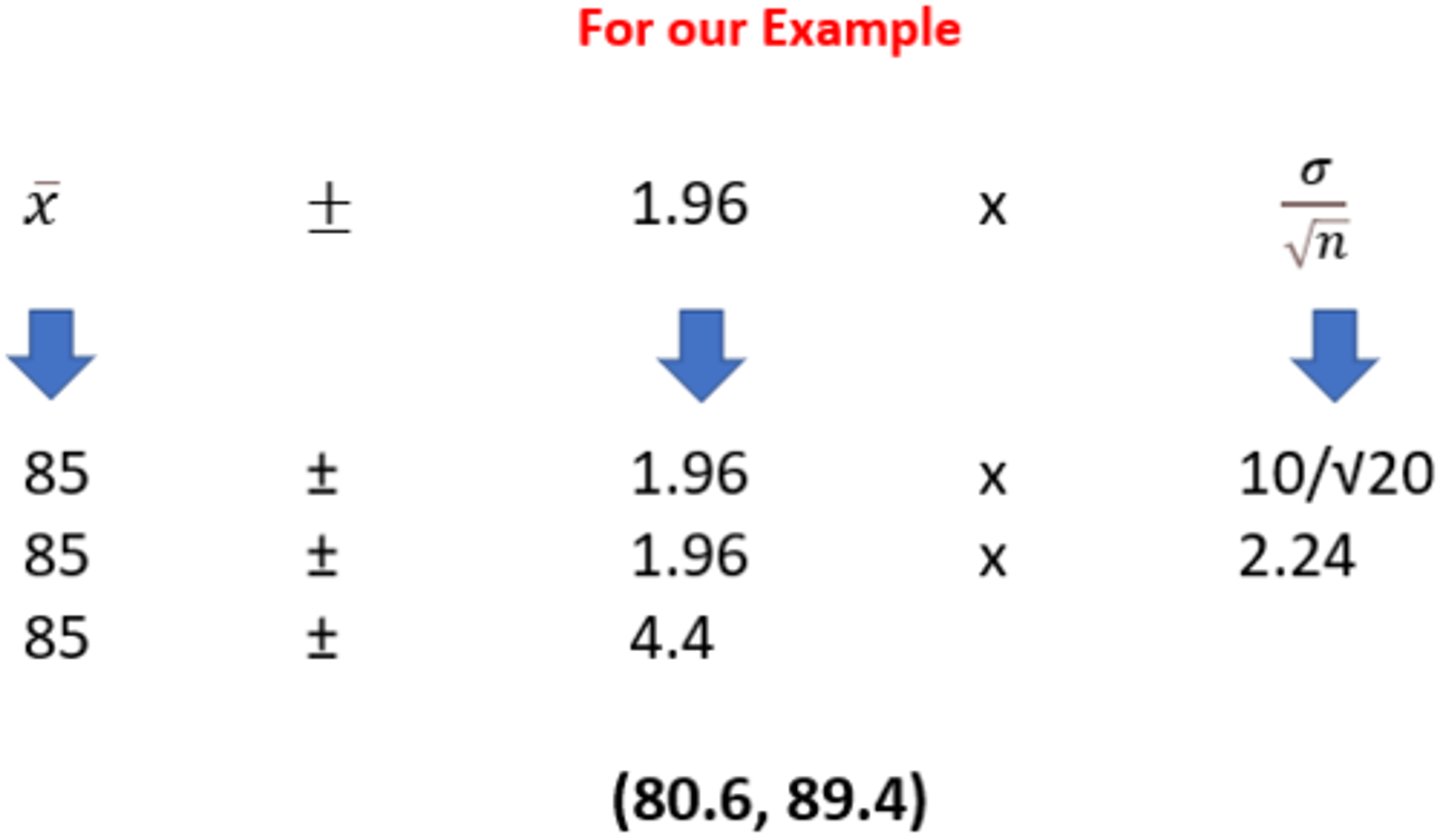
Confidence Interval - Example: Part #1
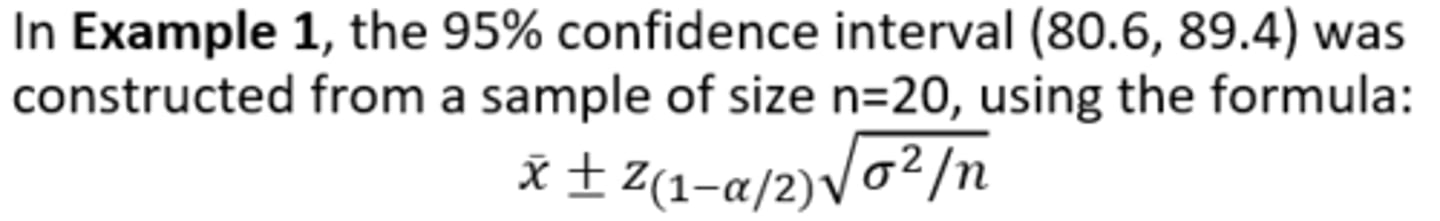
Confidence Interval - Example: Part #2
There are two ways to interpret this confidence interval:
1. Probabilistic Interpretation:
- 95% of the confidence intervals constructed in a like manner (i.e., randomly selected sample from the population) of size n=20 will contain the true population mean (μ)
2. Practical interpretation:
- We are 95% confident that the constructed confidence interval (80.6, 89.4) contains the true population mean (μ)
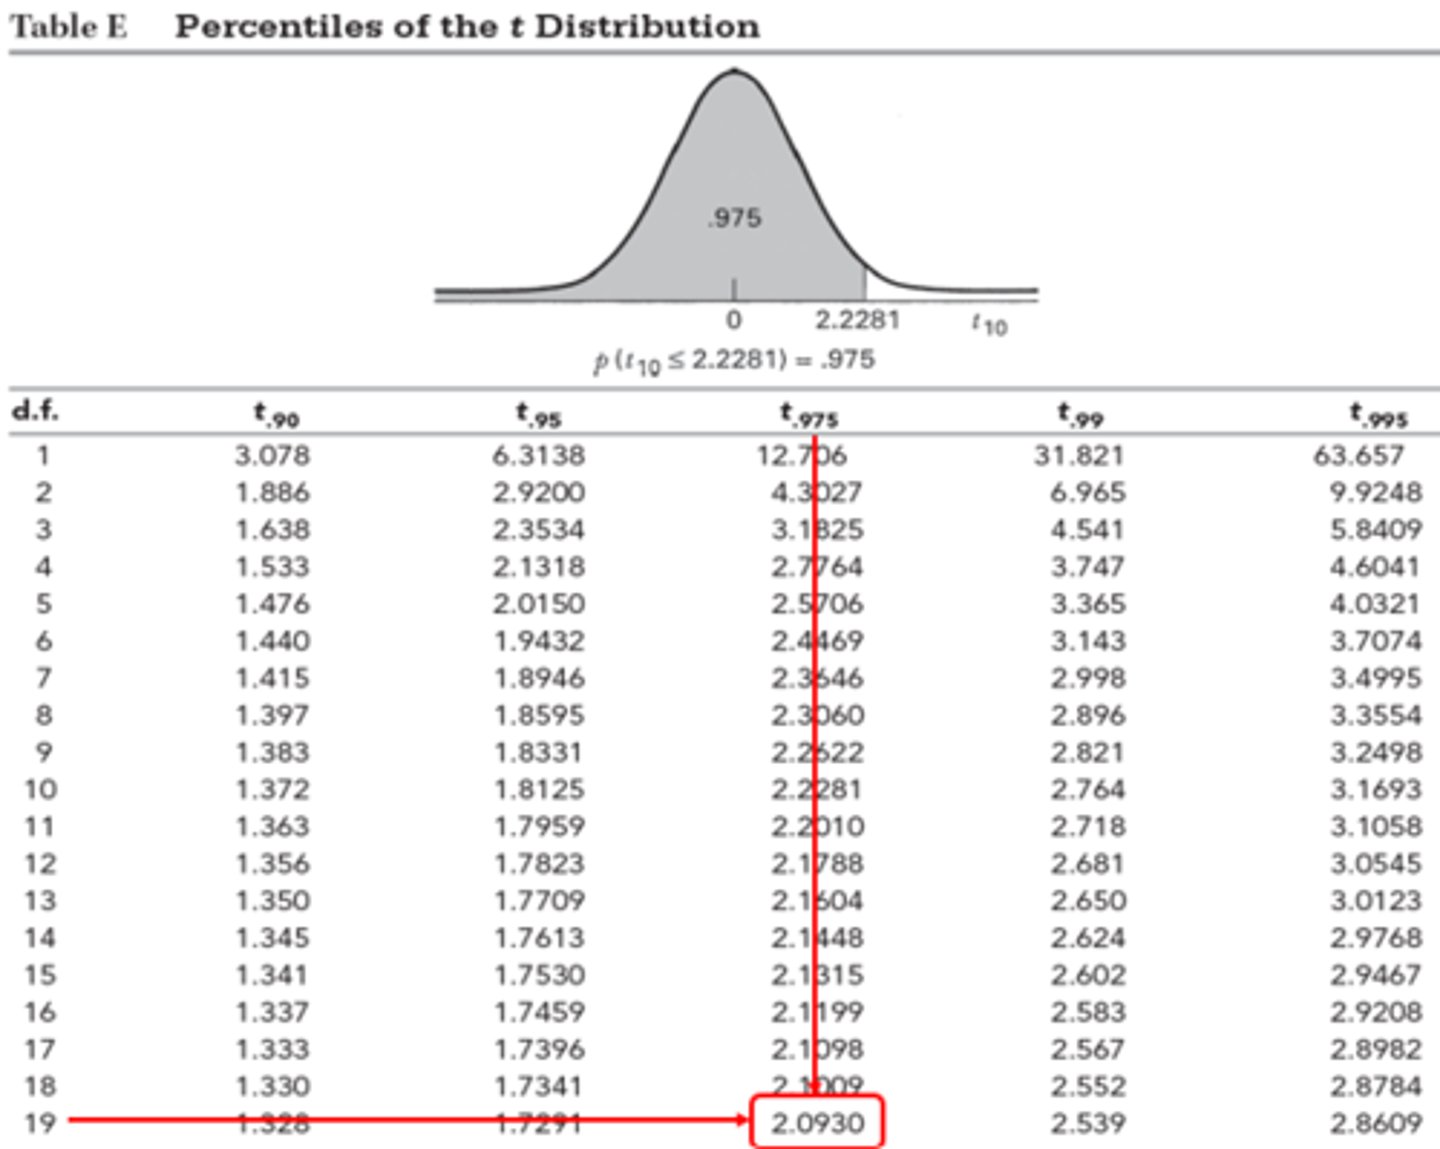
Confidence Interval - Example: Part #3
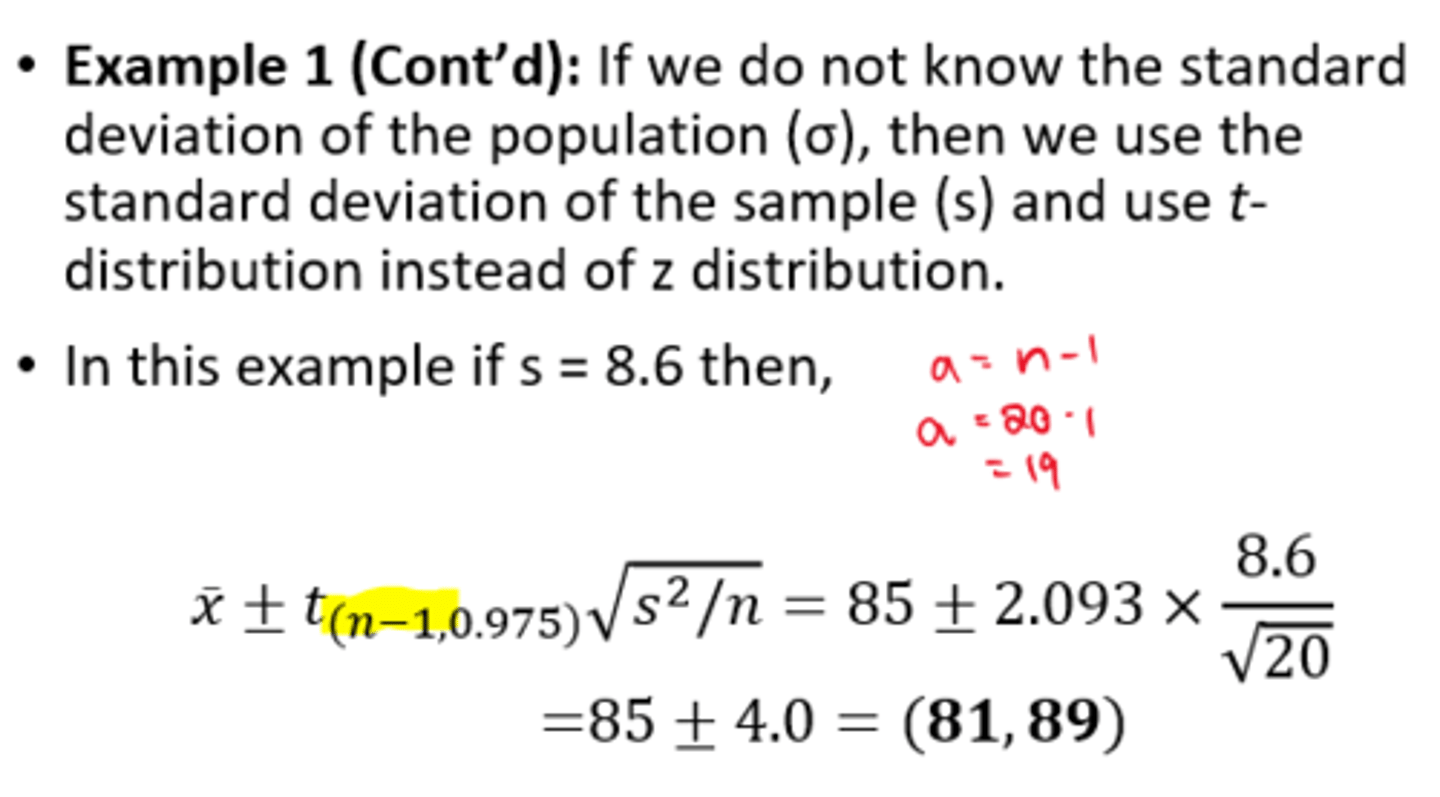
t Critical Value Table
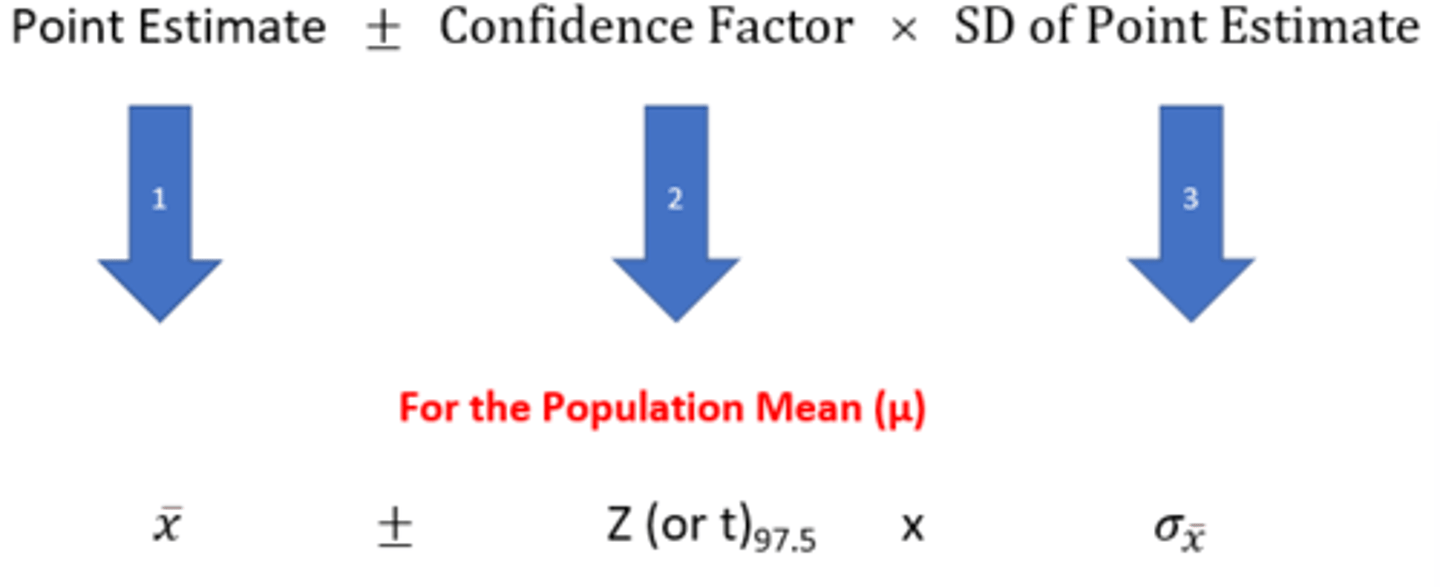
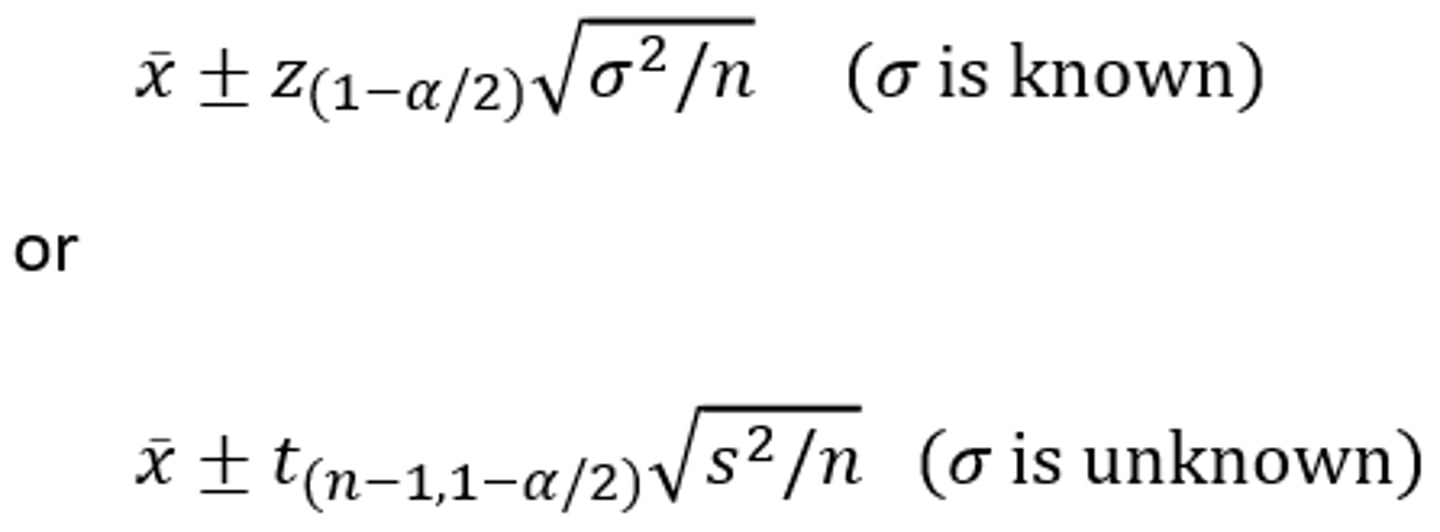
(1-α) Percent Confidence Interval
- In general a (1-α) percent confidence interval for the mean of a population is calculated by these 2 formulas
How does the confidence coefficient, variance, and sample size effect the width of the confidence interval (interval estimate)?
Answer =
- Smaller s = Smaller t = Wider width
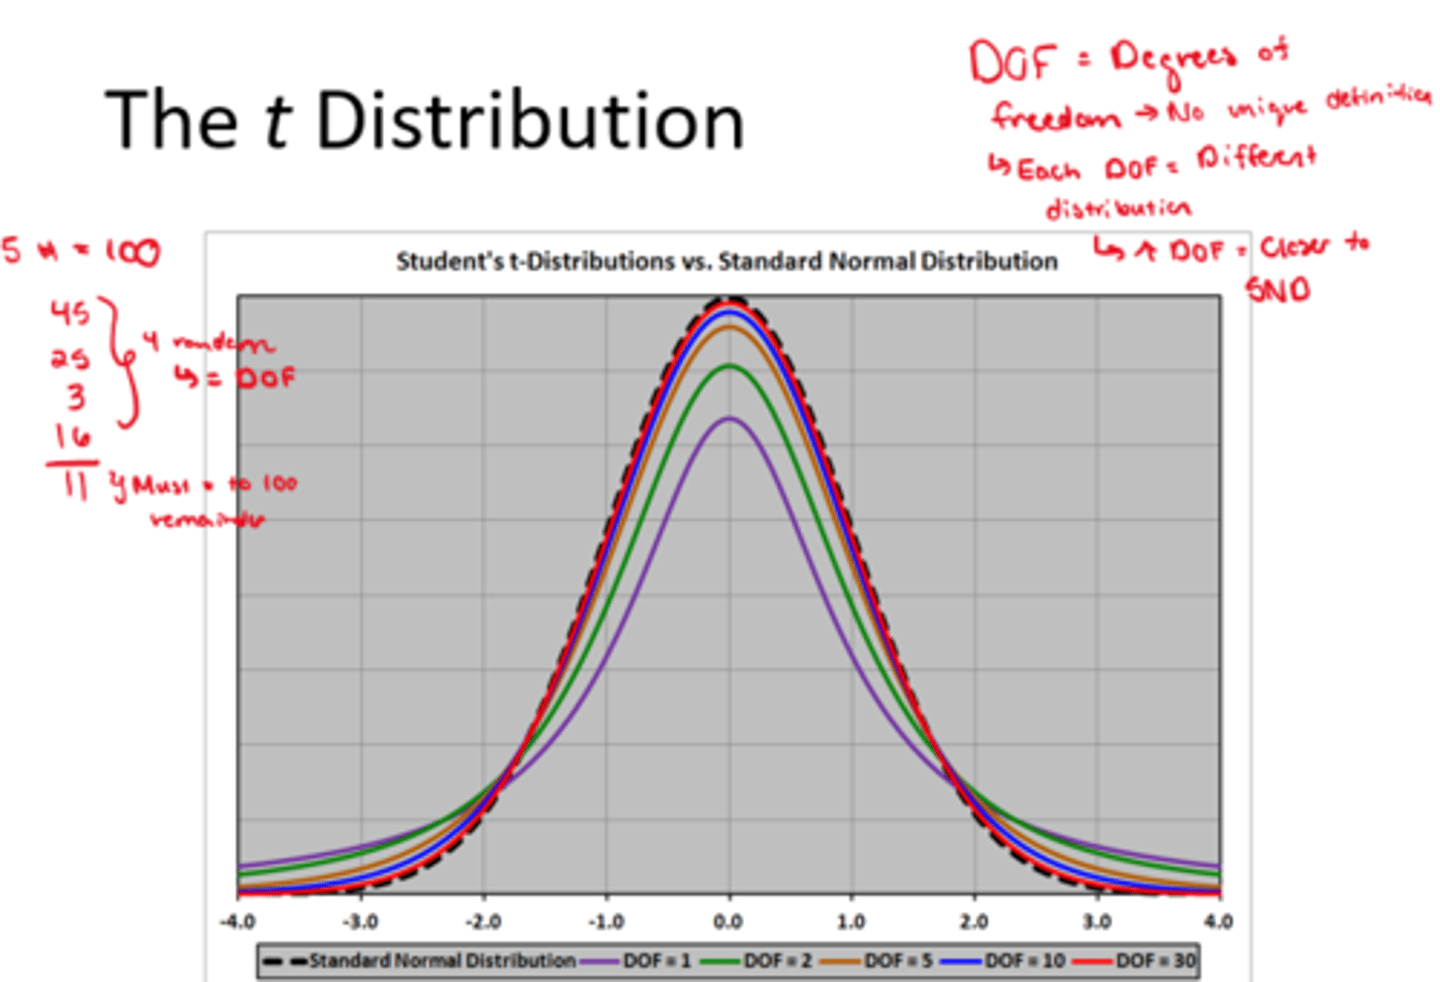
t Distribution
Which of the following statements is correct regarding a 95% confidence interval for the population mean calculated from sample data (n=50)?
a) 95% of the population means will fall within the interval
b) There is a 95% chance that the interval contains the true population mean
c) The interval is the same for 95% of all samples of the same size taken from the population
d) There is a 95% chance that a larger sample would result in a smaller interval
Answer = B
Introduction to Hypothesis Testing
Hypothesis Testing
- Determine whether the available data are compatible with the statement (hypothesis)
- The purpose of hypothesis testing is to aid the clinician, researcher, or administrator to reach a conclusion about a population by examining a sample from the population
Types of Hypotheses (2)
- Null hypothesis (H0): States that a population parameter is equal to a certain value (often based on existing evidence).
- Alternative hypothesis (HA): A hypothesis that contradicts H0 (often what you hope to show with research study); often represents new research questions that have been asked/answered
*Usually, the alternative hypothesis and the research hypothesis are the same. In fact, these two terms are often used interchangeably.
*Together, H0 and HA cover all possible values of the parameters under study, hence, one of them must be more plausible than the other.
Hypothesis Testing & Probability
- Hypothesis testing uses probability & relies on a specific conditional probability: P (Sample Data I Theory is True)
*P = Probability
*Sample data = Given
*Theory is true = Null hypothesis
Theory (Hypothesis)
- A theory (hypothesis) is in a constant state of uncertainty; new data can always be obtained to test the theory
- We reject or not reject the theory (hypothesis) based on the size of P (= ‘p value’)
We reject the theory (hypothesis) when P is small:
- Small P means the sample you got is very unlikely if the theory is true
- ‘Proof’ by statistical contradiction - because the sample is unlikely if the theory were true, we conclude the theory is not true
H0 (Null Hypothesis)
- H0 is not proven just because it is not rejected
- Data insufficient to show that H0 is false do not prove that H0 is true
- H0 of µ = 10 means the null hypothesis is that µ is exactly 10
- If data are insufficient to reject that µ = 10, then they almost certainly are insufficient to reject µ = 10.40, µ = 10.02 etc.
*Data insufficient to show that H0 is false are consistent with H0 but they are also consistent with many other hypotheses
Suppose a 95% confidence interval for the proportion of nursing students who exercise regularly is 0.29 to 0.37.
Which of the following statements is false?
a) It is reasonable to say that more than 20% of nursing students exercise regularly
b) It is reasonable to say that more than 40% of nursing students exercise regularly
c) The null hypothesis that 33% of nursing students exercise regularly cannot be rejected
d) It is reasonable to say that fewer than 40% of nursing students exercise regularly
Answer = B