The five number summary, box plots, & outliers
1/11
Earn XP
Description and Tags
The five number summary, boxplots, & outliers
Name | Mastery | Learn | Test | Matching | Spaced | Call with Kai |
|---|
No analytics yet
Send a link to your students to track their progress
12 Terms
The five number summary
Gives is a way to describe a distribution using only five numbers
Minimum
1st quartile
median
3rd quartile
Maximum
Minimum
the smallest value in a data set
1st quartile
is the median of the bottom half
it is a position where 25% of the data values are below it & 75% of the data values are larger than it
the first quartile is essentially the median of the median
median
is the middle data value
is a point at which 50% of the data values are below the median, & 50% of the data value is larger the median.
3rd quartile
is the median of the top half which gives us the third quartile
it is a position where 75% of the data values are below it, & 25% percent of the data values are larger than the third quartile
Maximum
is the largest value in a data set
Five number summary gives us
a way to divide the data into four equal quarters
The formula of first quartile = Q1
position of Q1 = n+1/ 2
IMPORTANT n refers to the values BELOW the median
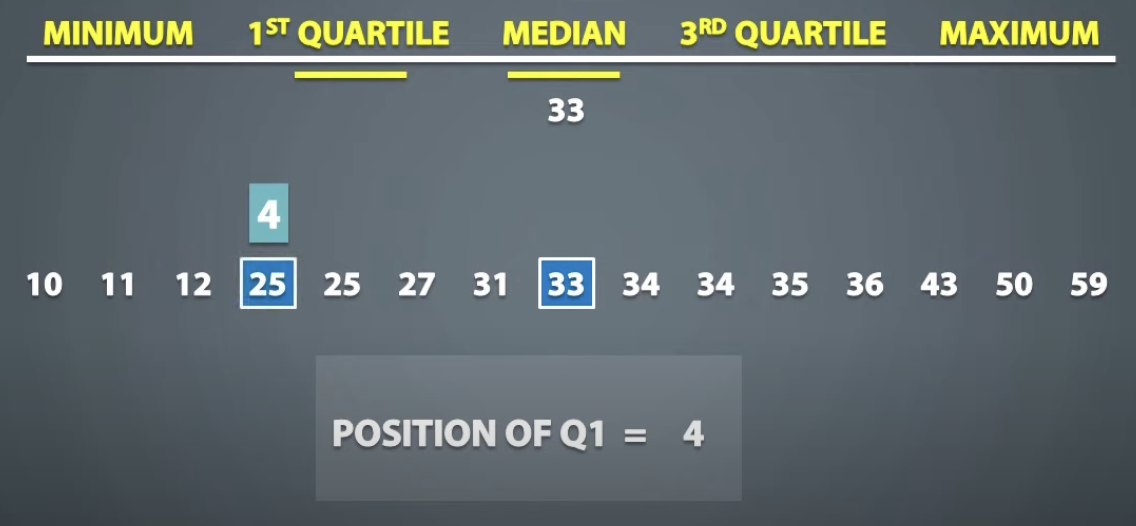
in this case Q1 is 25
The formula of the third quartile = 3Q
Position of Q3 = n+1/2
IMPORTANT n refers to the number of data values that are ABOVE the median
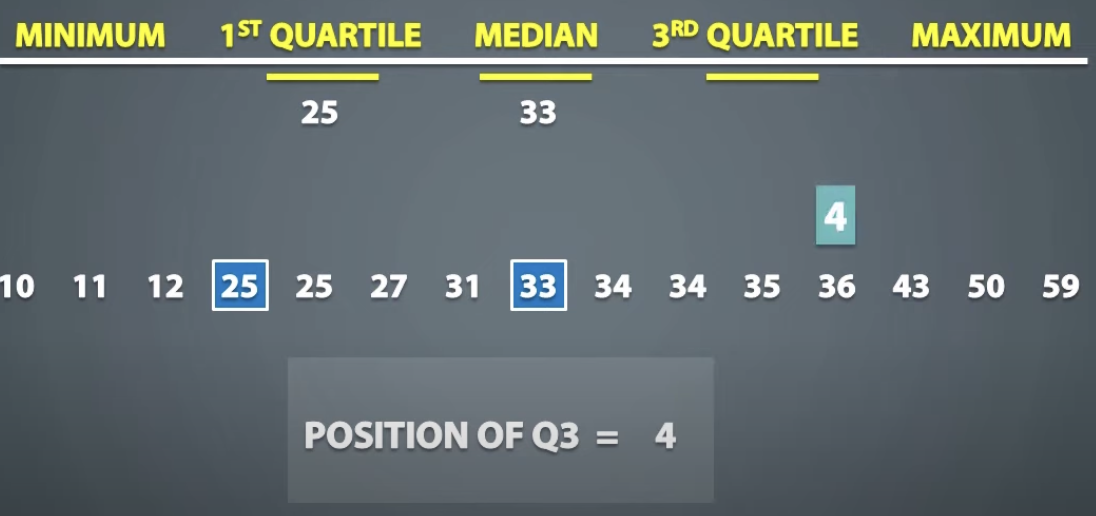
in this case Q3 is 36
BOXPLOT
gives us a visual representation of the five number summary
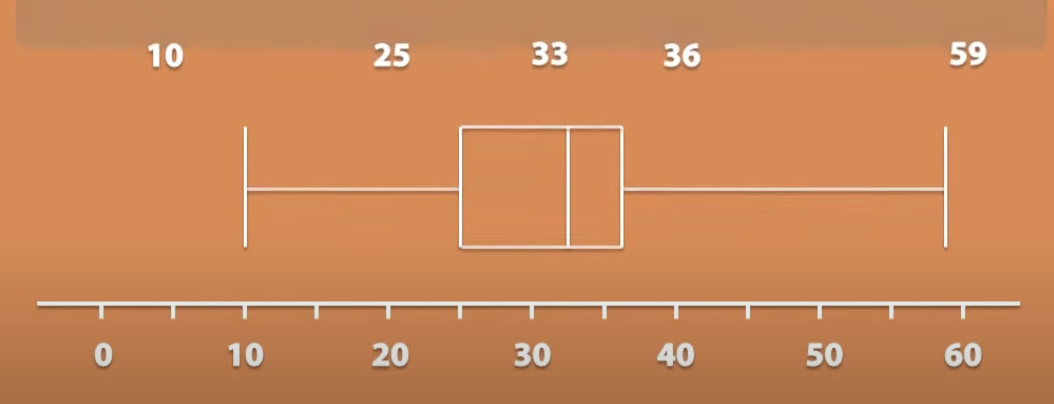
each vertical line on the box plot represents a number from the five number summary
the horizontal line that extends ends out from the box are called whiskers
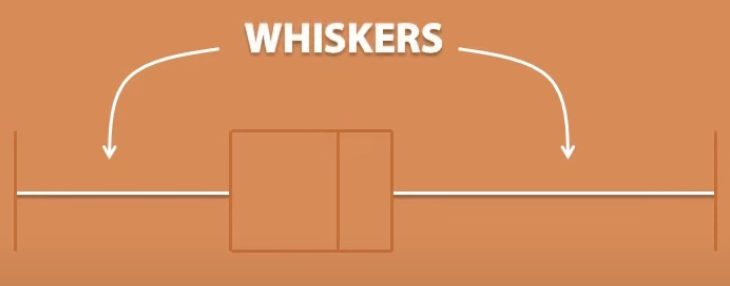
the box itself is called interquartile range & refers to the middle 50% of an order data set & its equal to the third quartile (Q3) subtracted by first quartile (Q1)
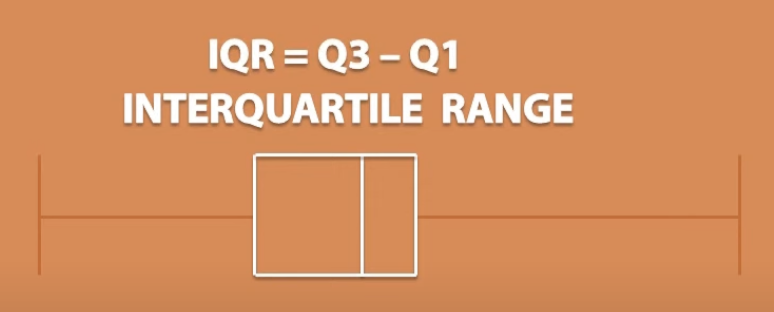
Interquartile range
the box itself in a boxplot
Modified boxplot
uses five number summary, but accounts for outliers → if there are outliers a whisker or both whiskers will extend to the new minimum or maximum