Primary Productivity: Understanding Eutrophication in Aquatic Ecosystems
1/27
There's no tags or description
Looks like no tags are added yet.
Name | Mastery | Learn | Test | Matching | Spaced |
|---|
No study sessions yet.
28 Terms
Primary Productivity
Rate of generation of biomass in ecosystems.
Phytoplankton
Microscopic plants contributing 50-85% oxygen.
Eutrophication
Nutrient increase causing excessive aquatic plant growth.
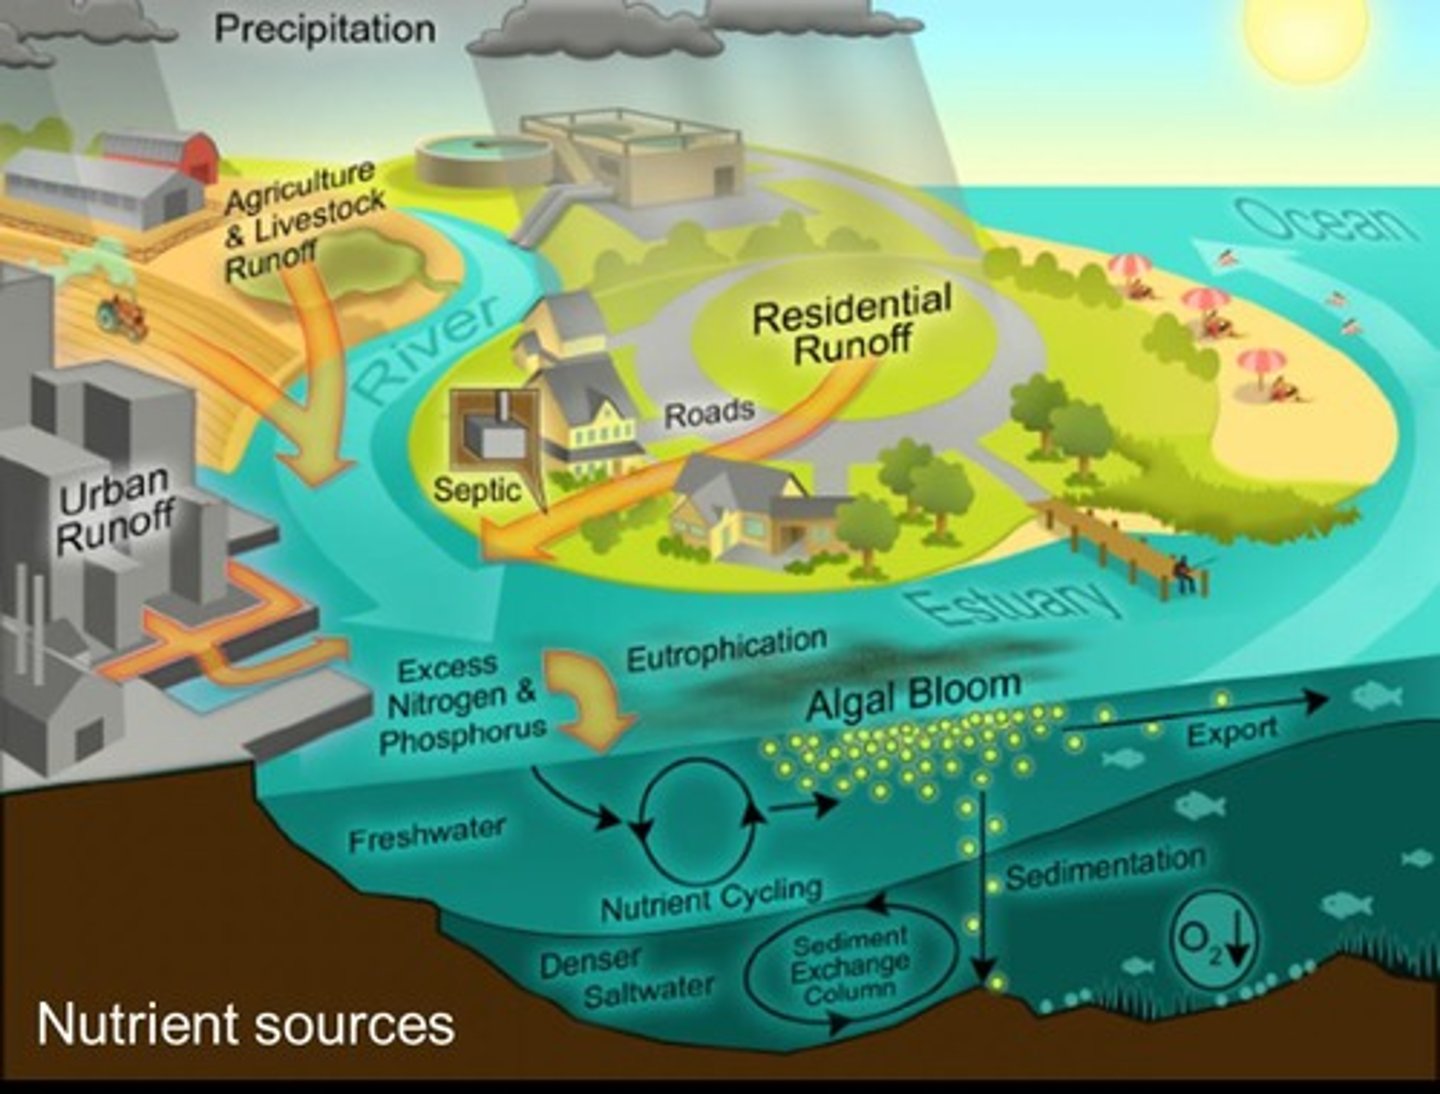
Nutrients
Essential elements like nitrogen (N) and phosphorus (P).
Chlorophyll a
Pigment indicating primary producer community composition.
Run-off
Water flow carrying nutrients into aquatic systems.
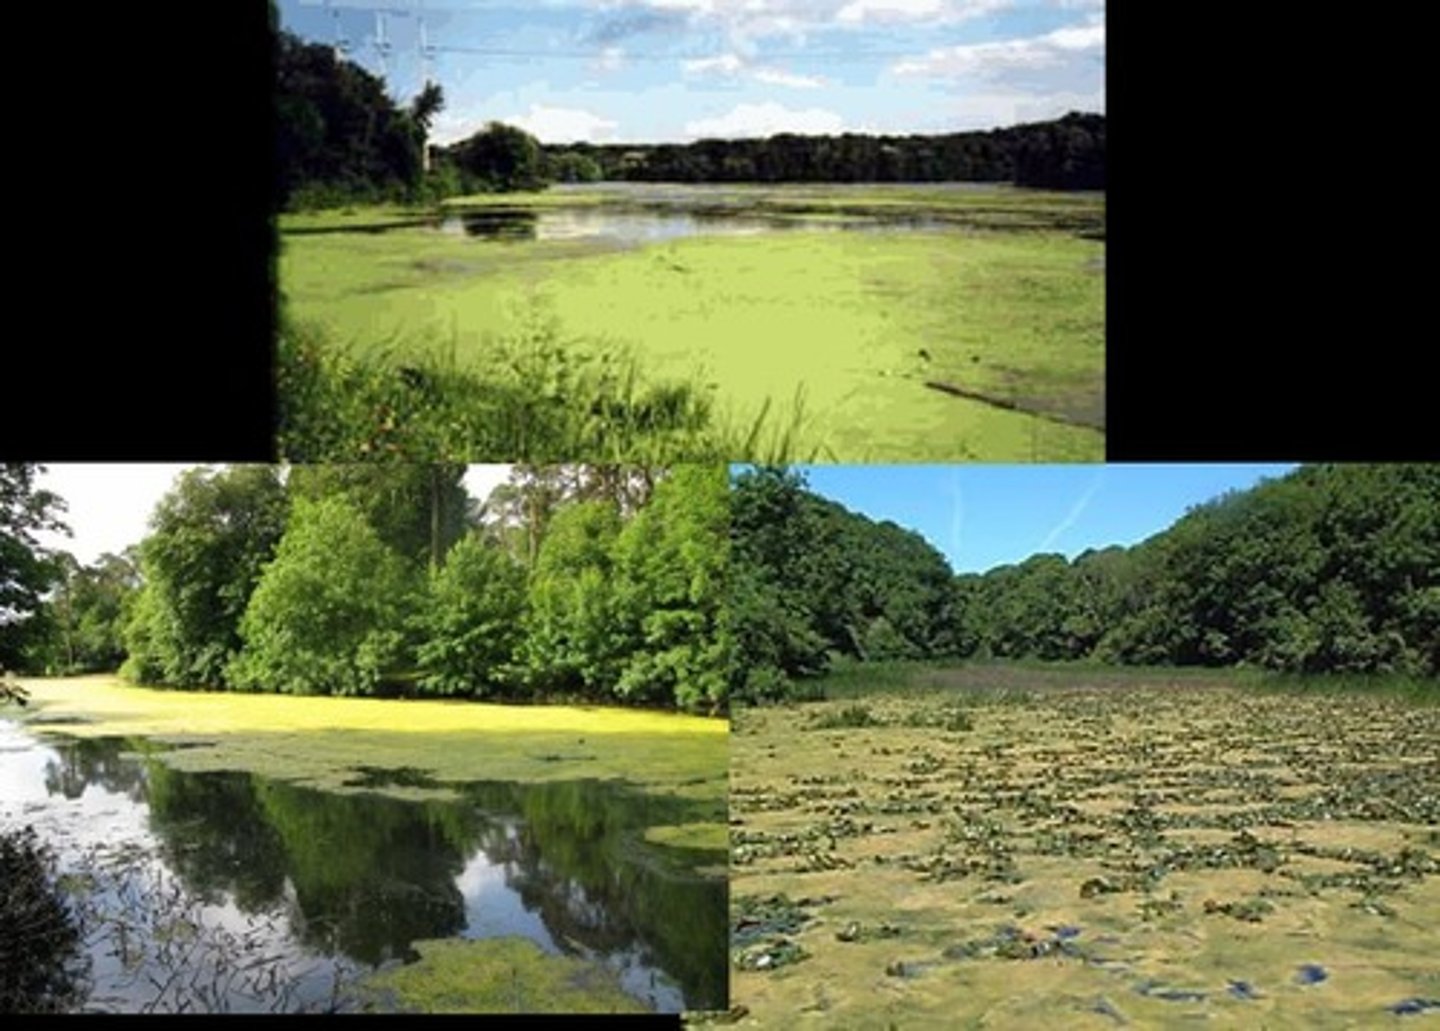
Biomass Bloom
Rapid increase of algae in water bodies.
Hypoxia
Low oxygen levels in aquatic environments.
Biological Oxygen Demand
Oxygen needed for decomposing organic material.
Anoxic Environment
Area with no dissolved oxygen available.
Oligotrophic Lakes
Nutrient-poor, clear water lakes.
Mesotrophic Lakes
Moderately nutrient-rich lakes over time.
Eutrophic State
High nutrient concentration leading to poor water clarity.
Detritus
Decaying organic matter increasing in eutrophic conditions.
Top-down Control
Biological regulation of ecosystem dynamics.
Bottom-up Control
Nutrient input regulation affecting ecosystem health.
Dead Zones
Areas with insufficient oxygen for aquatic life.
Coastal Upwelling
Nutrient-rich water rising to the surface.
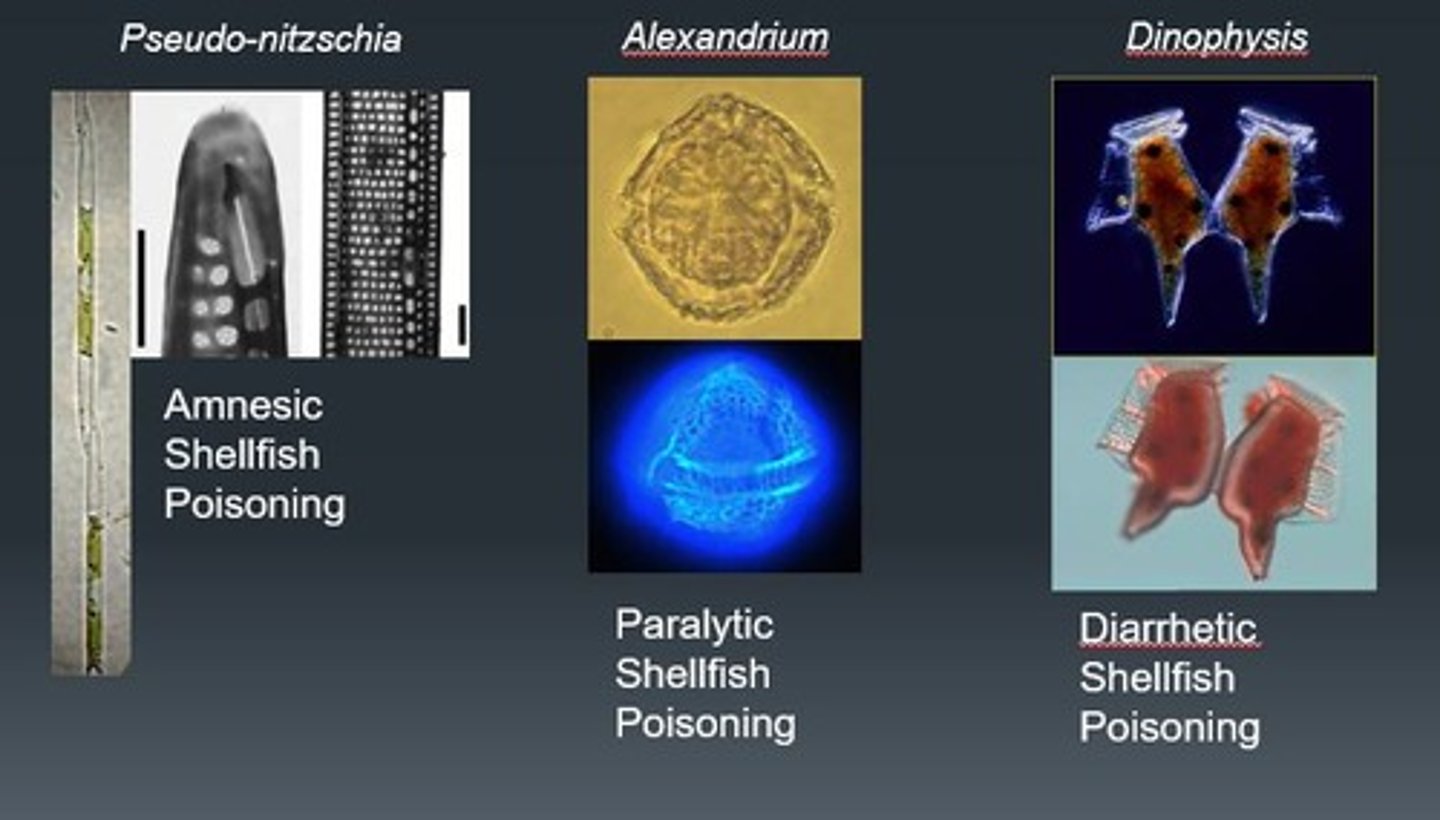
Toxic Algal Blooms
Harmful algal growth affecting aquatic ecosystems.
Sargassum Belt
Region impacted by eutrophication affecting marine life.
Shellfish Aquaculture
Cultivation filtering phytoplankton, reducing nutrient buildup.
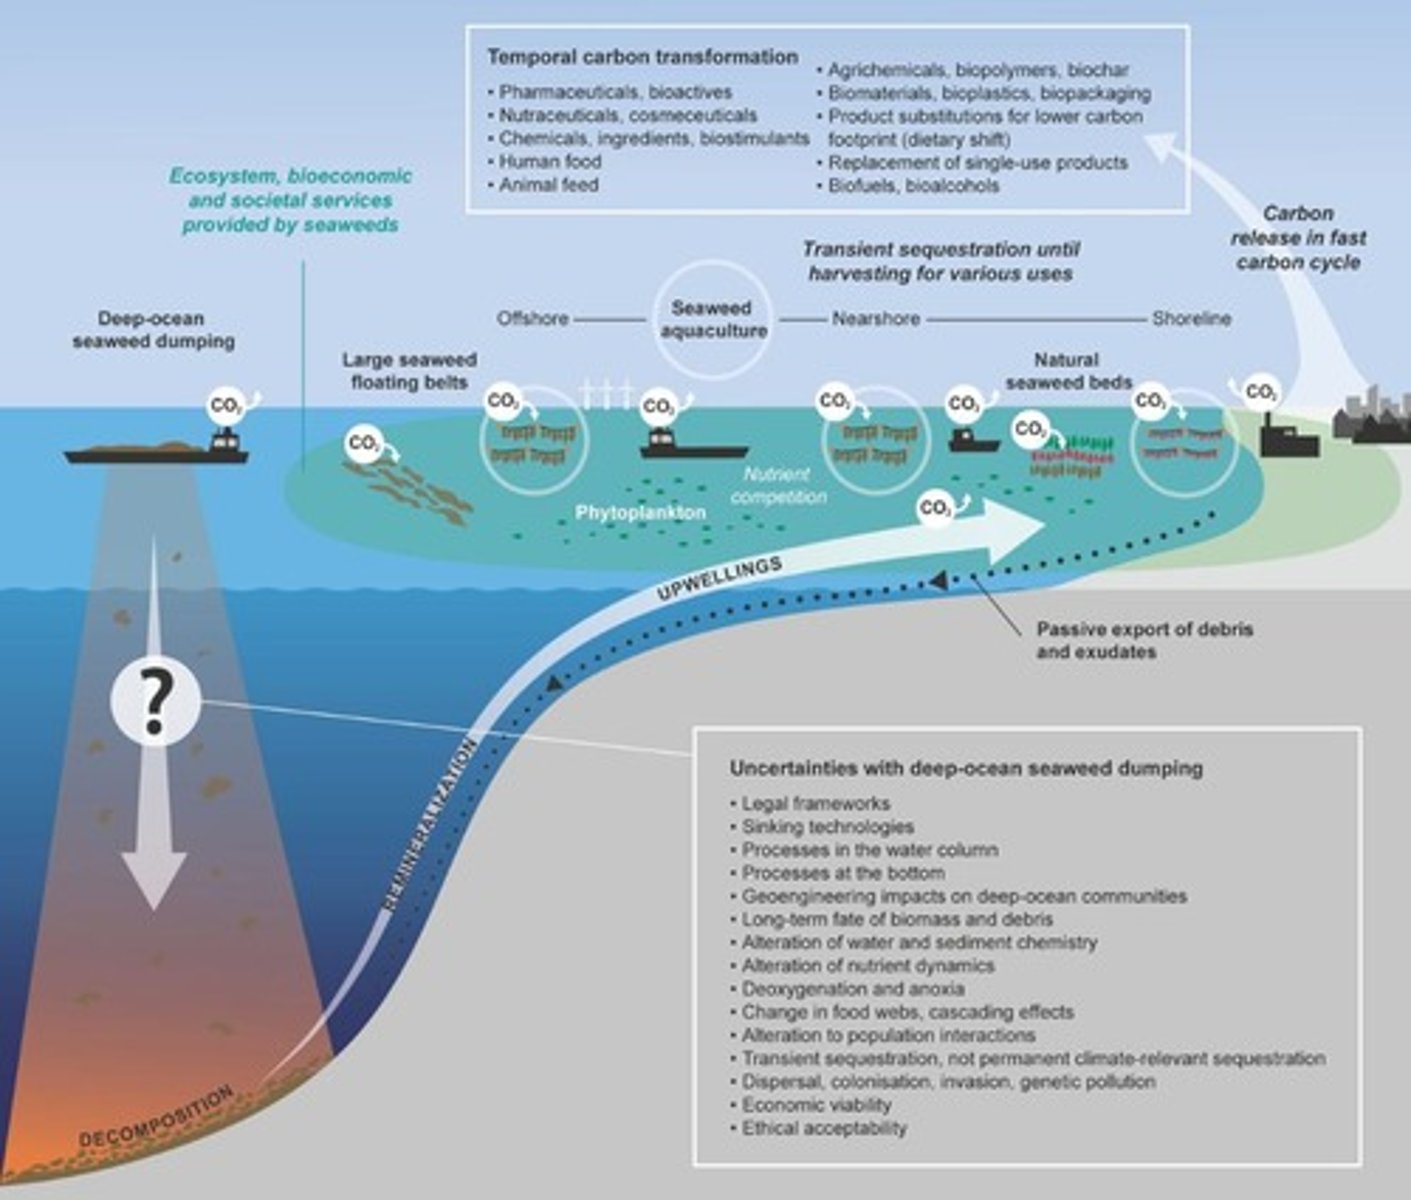
Seaweed Aquaculture
Growing seaweed to mitigate coastal eutrophication.
Gelatinous Zooplankton
Zooplankton increasing due to eutrophication effects.
Neurological Issues
Health problems caused by toxic algal consumption.
Economic Impact
Loss of valuable fish stocks due to eutrophication.
Water Transparency
Clarity of water affected by algal growth.
Water Retention Time
Duration water remains in an ecosystem.
Algal Toxins
Poisonous substances produced by harmful algal blooms.