ECON 1100 Exam 1
1/53
There's no tags or description
Looks like no tags are added yet.
Name | Mastery | Learn | Test | Matching | Spaced | Call with Kai |
|---|
No analytics yet
Send a link to your students to track their progress
54 Terms
Economics
the study of how individuals and societies choose to allocate scarce resources. “The Study of Choice”
Macroeconomics
Branch that examines the behavior of aggregates on a national scale
Microeconomics
Branch that deals with the functioning of households and businesses
Positive Economics
Scientific prediction about economic relationships and addresses WHAT IS (Statement of Fact)
Normative Economics
Focuses on value-based judgments and addresses WHAT SHOULD BE (Non-Factual, Opinion Based)
Opportunity Cost
The value of the next best alternative sacrificed when a choice is made
Fallacy of Composition
When it is incorrectly assumed that if something is true for a part, it must also be true for the whole.
Example: If one person saves more money by spending less money, then all of society must save more money by spending less money.
This is incorrect because if everybody spends less, the demand for goods and services throughout the economy decreases, business sales decline, production decreases, and income eventually decrease leading to less saving, not more saving,
Fallacy of Division
The mistaken idea that what is good or true for the whole must also be good for parts of the whole.
Example: If free trade with other countries leads to lower prices and stronger economic growth, the economy is better off.
Fallacy of False Cause (Post Hoc Fallacy)
After this therefore because of this. When someone incorrectly assumes that a causal relation exists between two things or events.
Classic Example: The rooster crows each morning, and then the sun rises. Therefore, the rooster’s crow causes the sun to rise.
EX: Trey’s assumption that his baseball team wins whenever he wears his lucky socks.
Sunk Cost Fallacy
The irrational belief that what has already disappeared can somehow be regained through further investment of money, time, or effort.
Sunk Cost: an expense already incurred that cannot be recovered.
Resources (factors,inputs)
Anything provided by nature or previous generations that can be used directly or indirectly to satisfy wants
Examples of Resources
Land
Labor
Capital (machines, equipment, buildings)
Entrepreneurship
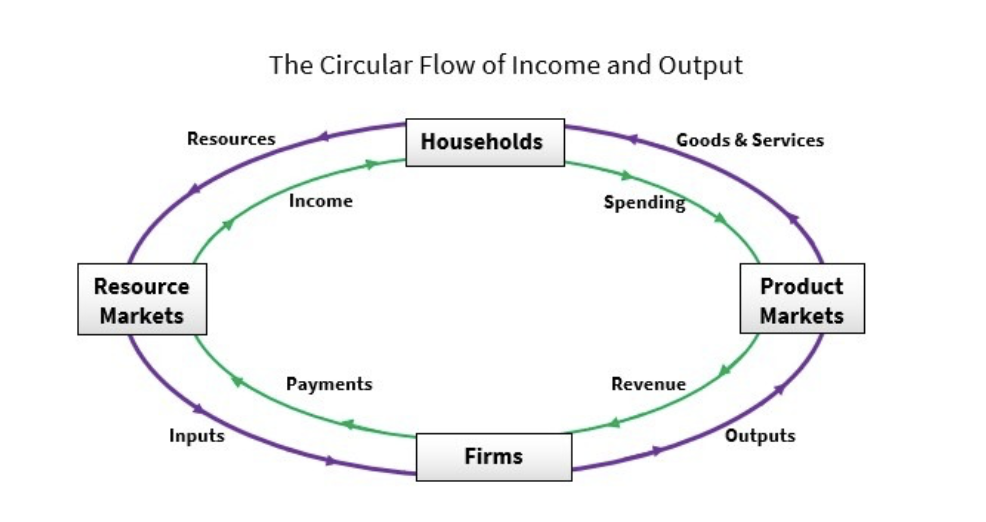
Circular Flow Model
Shows the interaction of households (CONSUMERS) and firms (BUSINESSES) in product markets (OUTPUT MARKETS) and resource markets (INPUT MARKETS)
Let things work on their own. The idea of letting markets work without guidance or intervention from the government.
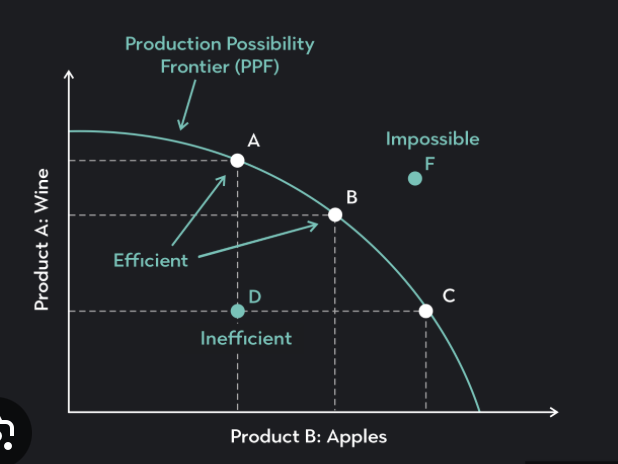
Production Possibilities Frontier (PPF)
A graph that shows the max combinations of 2 goods that can be produced in a given time period assuming 2 things:
Full and efficient usage of available resources
Using the current existing state of technology
Points on PPF (efficiency) Points inside PPF (inefficient) Points outside PPF (unattainable)
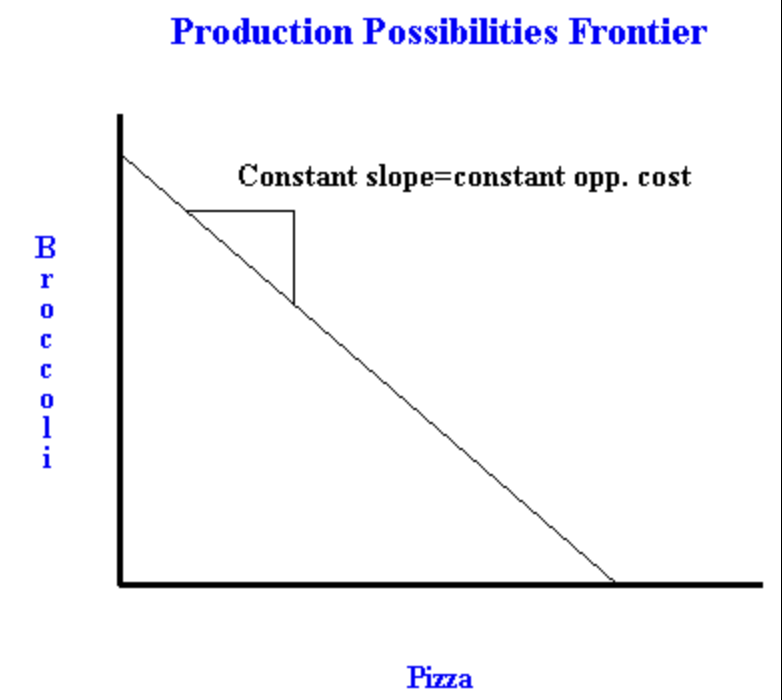
Linear PPF
ONLY when resources are equally well-suited
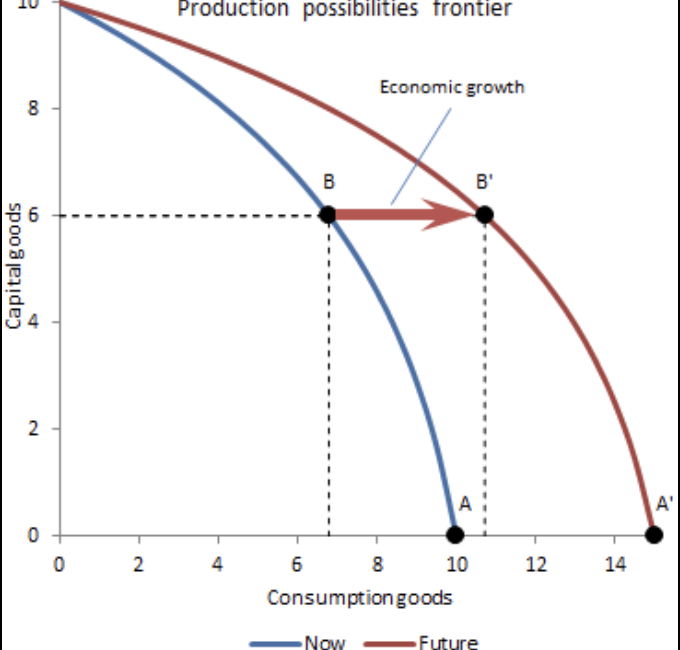
Economic Growth
An increase in the total output of an economy illustrated by a rightward shift in the PPF
Law of Increasing Opportunity Cost
To produce more of a good during a given time period, society must sacrifice increasing amounts of the other good because resources typically are not equally well suited to producing different goods.
What causes Economic Growth?
a. New and Advanced Technology
b. Increase in Resources (quatity or quality)
Capitalism (Market System)
Based on private ownership of the factors of production.
Private actors own and control property in accord with their interests, and demand and supply freely set prices in markets in a way that can serve the best interests of society. Guided by self-interest.
Examples: small businesses, stock markets, venture capital investments, and private ownership of assets and resources.
Socialism (Command/Planned System)
The state owns and controls most of the factors of production, including land and capital goods. The state also engages in central planning. Production of goods and services, as well as their prices and distribution, are centrally controlled by the state. Centralized Decision Making
Examples: North Korea, Cuba, and the former Soviet Union
Mixed Economy
Has elements of both a market economy and a planned economy. It is a synthesis of socialism and capitalism, which contains both private enterprises and public enterprises. Most modern economies implement a mixed economic system.
Examples: U.S., UK,
Absolute Advantage
The ability to produce more of a good using a given quantity of resources
Comparative Advantage
The ability to produce a good at a lower opportunity cost compared to other producers
(looking at the lower value)
Law of Demand
States there is a negative or inverse relationship between the price of a good and the quantity demanded of that good, ceteris parabus
As a price increases, quantity demanded decreases and vice versa.
Ceteris Parabus
All things held equal or constant
Non-Price Determinants of Demand - Taste/Preference
If taste/preference increases, demand increases
Non-Price Determinants of Demand - Consumer Income for Normal Goods
For normal goods, income and demand are positively related (Up, Up; Down, Down)
Non-Price Determinants of Demand - Consumer Income for Inferior Goods
For inferior goods, income and demand are negatively related (Up, Down; Down, Up)
Non-Price Determinants of Demand - Price of Related Goods - Substitutes
goods for which there is a POSITIVE RELATIONSHIP between PRICE OF GOOD and DEMAND for some RELATED GOOD
ex: different brands of things, gatorade/powerade, organic/inorganic
Non-Price Determinants of Demand - Price of Related Goods - Complements
goods for which there is a NEGATIVE RELATIONSHIP between PRICE OF GOOD and DEMAND for some RELATED GOOD
ex: ice cream/icecream cone, peanut butter/jelly
Non-Price Determinants of Demand - Number of Buyers
this is a direct relationship, number of buyers increases then demand increases
Movement on Demand Curve
This is because of PRICE.
- Change in the price of the good itself will cause movement along the demand curve
*change in quantity demanded
Shift on Demand Curve
This is because of something NONPRICE
- Change in any non-price determinant of demand
*change in demand
Law of Supply
POSITIVE OR DIRECT relationship between PRICE OF GOOD and QUANTITY SUPPLIED of that good
Non-Price Determinants of Supply - Technology
If there is a INCREASE in tech, then the supply for blank will INCREASE, vice versa
Non-Price Determinants of Supply - Resource Costs
INCREASE in resource cost, DECREASE in the supply of blank
Non-Price Determinants of Supply - Acts of Nature
*weather conditions
ex: Bad weather in Florida (INCREASE), Orange supply (DECREASE)
Non-Price Determinants of Supply - Number of Sellers
# of sellers/suppliers INCREASE, INCREASE in supply
Movement of Supply Curve
PRICE CHANGE
- change in price of good itself
-change in quantity supplied
Shift on Supply Curve
NON-PRICE CHANGE
- caused by change in any non-price determinant of supply
- change in supply
Equilibrium of Supply and Demand
Occurs at the price in which QUANTITY DEMANDED and QUANTITY SUPPLIED are EQUAL
Shortage
Price is BELOW the equilibrium price and as a result QUANTITY DEMANDED is GREATER than QUANTITY SUPPLIED
Surplus
Price is ABOVE the equilibrium price and as a result QUANTITY SUPPLIED is GREATER than QUANTITY DEMANDED
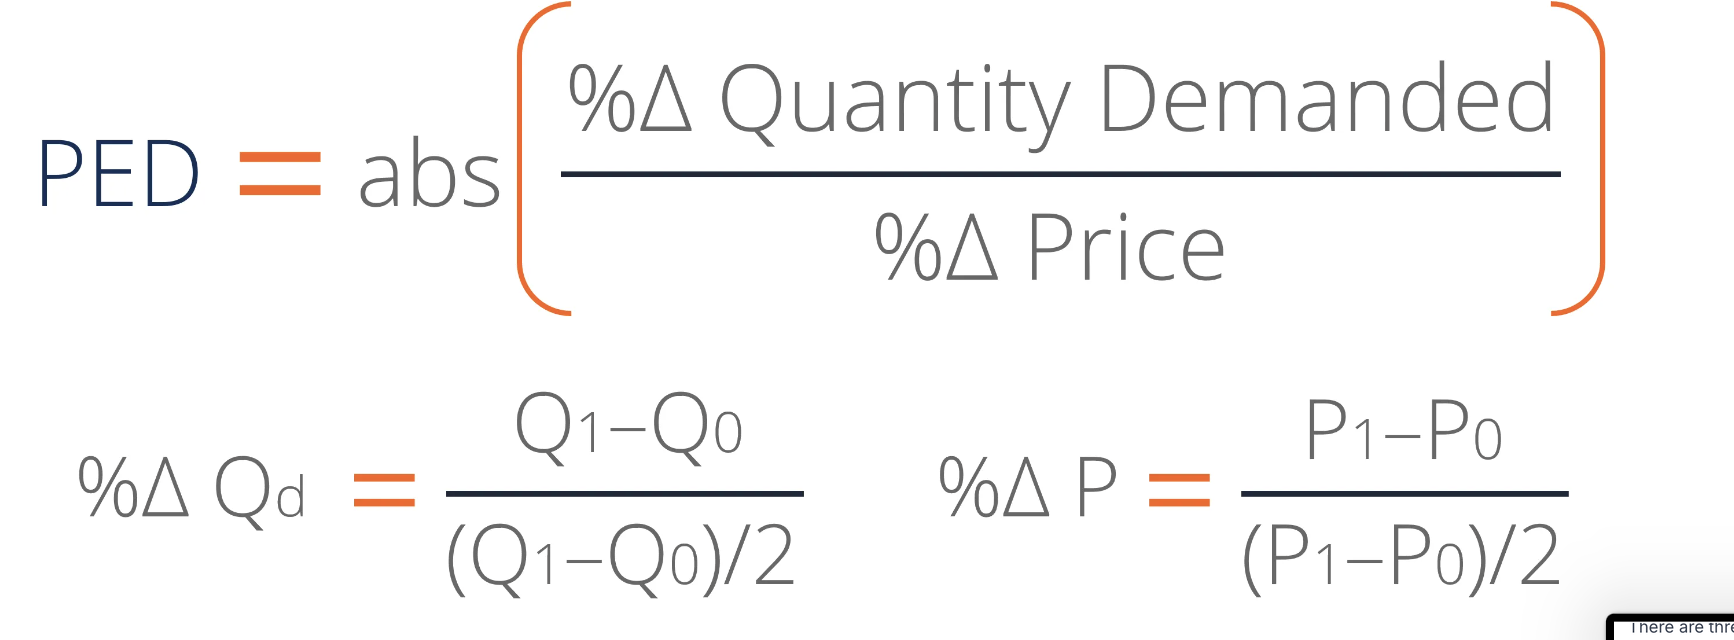
Price of Elasticity of Demand
Measures the responsiveness in the quantity demanded of a good due to some percentage change in price. The availability of substitutes determines it as well
Formula for Price Elasticity of Demand (midpoint formula)
Percentage change in Quantity Demanded by the Percentage change in Price
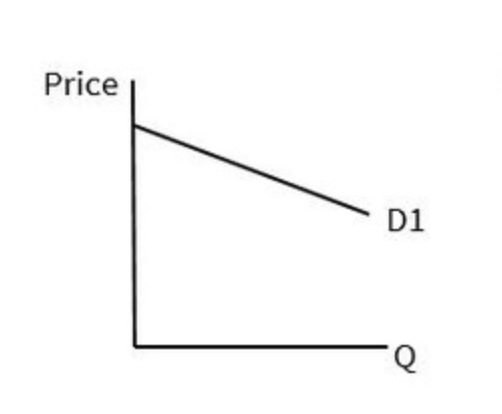
Elastic Demand
When Ed is greater than 1, demand is elastic
(much responsiveness, many substitutes)
When Price increases, Total Revenue decreases, vice versa (negatively related)
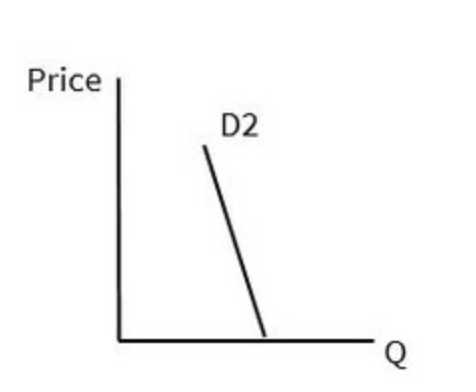
Inelastic Demand
When Ed is less than 1, demand is inelastic
(less response, few substitutes)
When Price increases, Total Revenue increases, vice versa (positively related)
Unit Elastic
When Ed equals 1, demand is unit elastic
When Price increases or decreases, Total Revenue does not change
Elastic Graph
Inelastic Graph
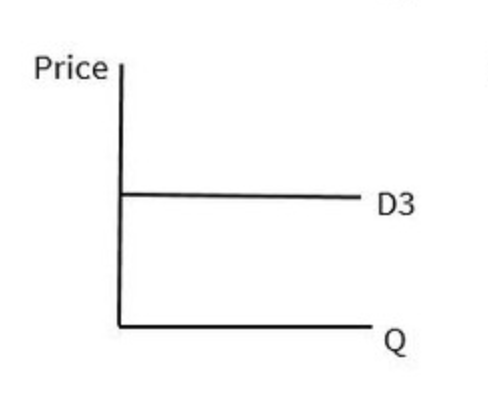
Perfectly Elastic Graph
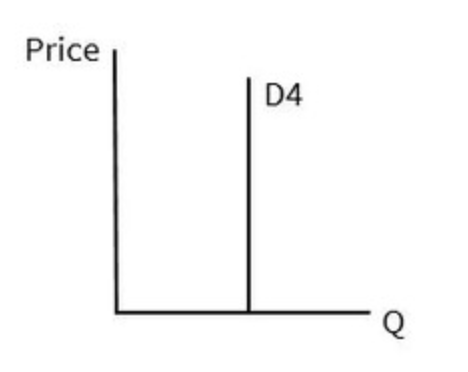
Perfectly Inelastic Graph
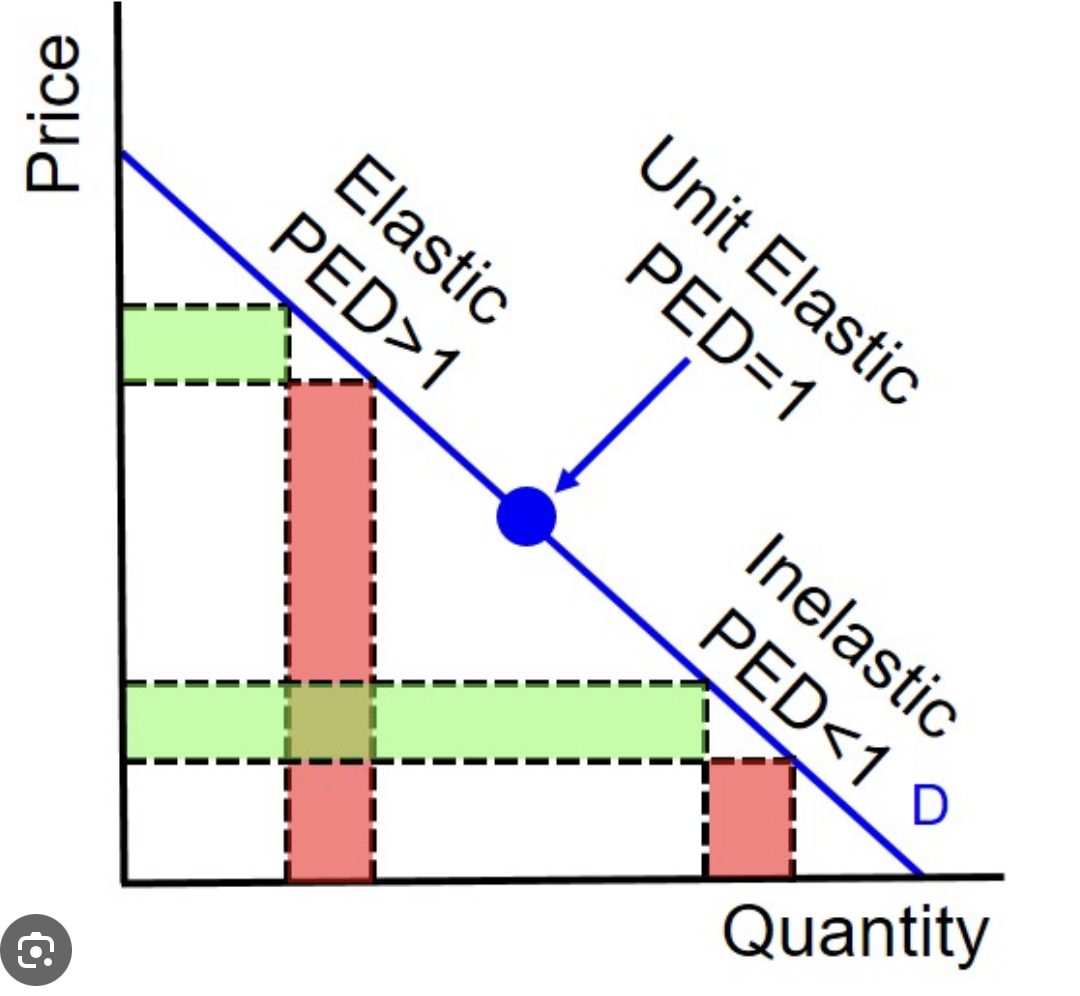
Elasticity along a Linear Demand Curve
As we move down a linear demand curve, the price/# goes down
Total Revenue Formua
TR= P x Qd