3.3 Marketing
1/69
There's no tags or description
Looks like no tags are added yet.
Name | Mastery | Learn | Test | Matching | Spaced | Call with Kai | Chat |
|---|
No analytics yet
Send a link to your students to track their progress
70 Terms
Sampling
Selecting a group of people to represent a target population
Extrapolation
Predicting future trends from past data
Primary Research
Data you collect first hand
Advantages of Primary Research
Specific to the business
Up to date
Reliable
Diadvantages of Primary Research
Time consuming
Costly
Hard to get large sample sizes
Examples of Primary Research
Questionnaires, interviews, focus groups, customer observations
Secondary Research
Research that already exists done by someone else
Advantages of Secondary Research
Fast
Better if you want quantitative data
Easily accessible
Disadvantages of Secondary Research
Some data you might need to pay for
Not always up to date
Not specific for the business
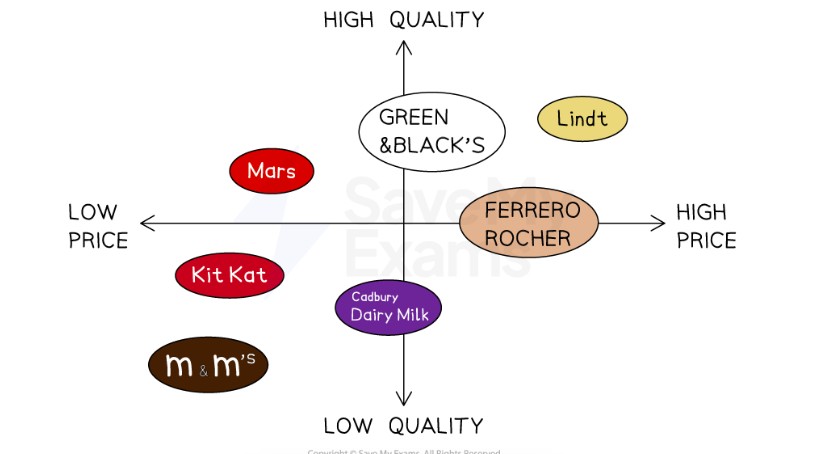
Market Mapping
Shows how products/businesses are viewed to competitors on 2 characteristics
Benefit of Market Mapping
Helps understand their competition
Helps to see if they should set up in a market
Drawback of Market Mapping
Only considers 2 variables
Correlation
Helps a business understand the relationship between 2 factors
Advantages of Sampiling
Quicker and easier than trying to collect research from everyone
Bigger sample size, will be more representitive
Confidence Levels
Shows how accurate the research findings are
Confidence Interval
Possible range for outcomes for a given confidence
Price Elasiticity of Demand (PED)
Effect on customer demand when changing the price of a product
Price Elastic
Demand decreases when prices increases
Price Inelastic
Demand Increases when price increases
Example of Inelastic Products
water, clothes, glasses, sanitary products, toothpaste
Example of Elastic Products
Cars, Phones, Ice cream
Income elasticity of Demand (YED)
Measures the quantity of a product demanded is affected by a change in income
Price Elastic Number
More than 1
Price Inelastic Number
Less than 1
YED between 0 and 1
Normal essential goods: Demands stays the same. E.g. water
YED smaller than 0
Inferior good: Income increases and demand decreases. E.g. Transport, Low priced clothing/ Food Products
YED more than 1
Luxury goods: Electronics
Market Capitalisation
Share price X Number of Outstanding shares
Outstanding shares
Number of shares all shareholders own
Market Share
Total sales / Total Market Sales x100
Sales Growth
(New Sales - Old Sales) / Old Sales x100
Market Growth
(New Market - Old Market) / Old Market x100
Market Segmentation
Dividing a market into different parts based on different customer needs and wants
What are demographic segments?
Characteristics: age, gender, religion, ethnicity
What are Income segments?
Income, occupation, social class
What are Behavioural segments?
How customers respond to a product (Loyalty, when/why people buy products)
What are Geographical segments?
Physical Location
Benefits of Market Segmentation
Matching customer needs = increase customer loyalty
Identify the needs of specific customers
Drawbacks of Market Segmentation
Expensive to research
Constantly changing behaviour
Positioning
Process a business goes through when launching a new product/service. It decides price, quality, branding, customer perception
Market Mapping
“position” the product in a market based on two dimensions
Benefits of Market Mapping
Helps businesses come up with new ideas for new products
Make comparisons between rivals products
Drawbacks of Market Mapping
Mapping a market may require primary research, which can be expensive
Only two criteria can be chosen
Niche Marketing
A business targets a smaller segment of a larger market, selling products to customers who have specific needs and wants
Benefits of Niche Marketing
Stronger customer loyalty
Less competition
Clear focus
Drawbacks of Niche Marketing
Vulnerable to market changes
Attract competition if successful
Mass Market
Where a business sells into the largest part of the market, where there are many similar products on offer
Benefits of Mass Market
More customers/sales
Brand recognition
Drawbacks of Mass Market
More competition
More advertising needed
STP Process
Segmentation - Identify target market based on business strengths/competition
Targeting - Categorise customers based on their characteristics/needs
Positioning - Position competitiors in order to meet customer needs that aren’t yet satisfied
Promotion
How the customer is found & persuaded to buy
Price
How much the customer pays for the product
People
The stakeholder who makes contact with customer
Physical Environment
The elements of the physical environment the customer experiences
Product
The product or service customer buys
Process
The processes that deliver a product to a customer
Place
How the product is distributed to the customer
Brand Loyalty
Customers consistently choosing a business over others
Boston Matrix : Dog
Low market growth
Low market share
Boston Matrix : Cash Cow
Low market growth
High market share
Boston Matrix : Question Marks
Low market share
High market growth
Boston Matrix : Stars
High market share
High market growth
Development Stage
A new product is researched and tested before it is introduced into the market
Introduction Stage
New product is launched into the market
Lots spent on marketing
Low sales
Growth Stage
The product experiences a rapid increase in sales
Economies of scales
Competition intensifies
Maturity Stage
The product reaches its peak level of sales
Sales growth slows down
Compeitionhighest
Cash flow highest
Decline Stage
Decrease in sales
Decrease in profit
Decrease in cash flow
Extension strategies for Decline Stage
Prolong the life of a product and increase sales
Pricing strategies
Factors influencing pricing
Branding - Luxury/necessity/affordable brand
Supply/Demand
Cost of suppliers
Competitors pricings
Product Life Cycle
Price Elasticity of demand
Penetration Pricing