Class 10 (Unit 4)
1/50
There's no tags or description
Looks like no tags are added yet.
Name | Mastery | Learn | Test | Matching | Spaced | Call with Kai |
|---|
No analytics yet
Send a link to your students to track their progress
51 Terms
What are we learning?
Continuous variables, density curves
Continuous uniform distribution
Normal distributions
68-95-99.7 rule
Standardizing observations (z-scores)
Normal distribution calculations
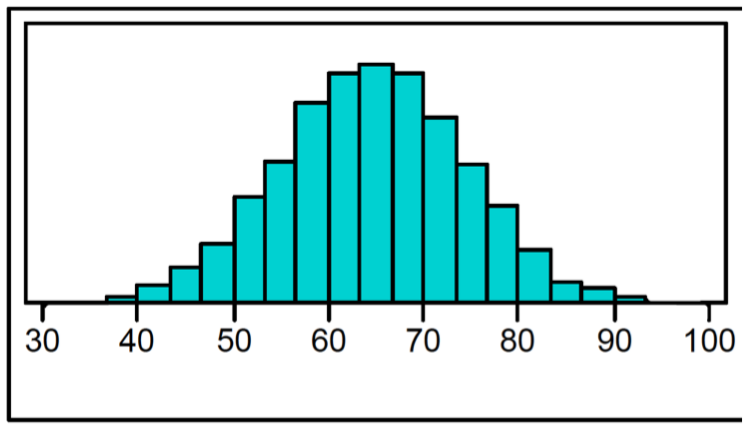
Histogram
x = intervals, y = frequency
Density curves
A graphical representation used to show the probability distribution of a continuous random variable, where the area under the curve represents probabilities of outcomes.
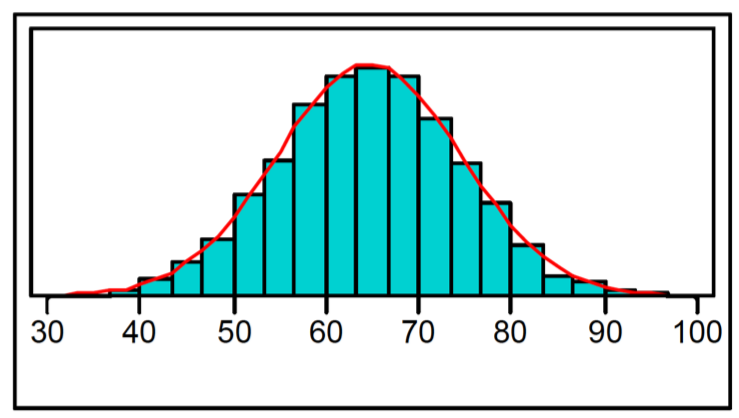
How can we approximate the distribution in a histogram
We can fit a smooth curve through the tops of the bars in the histogram to get an approximation of the distribution:

What are the attributes of this histogram
Notice that this distribution has quite a nice shape: it’s symmetric, with a fairly smooth pattern descending from the center on each side. There are no gaps or outliers.
This is common when we have a large sample size

What is a curve
is a mathematical model for the distribution
It is an idealized description of the data. It offers an overall picture of the distribution, without considering small irregularities or outliers
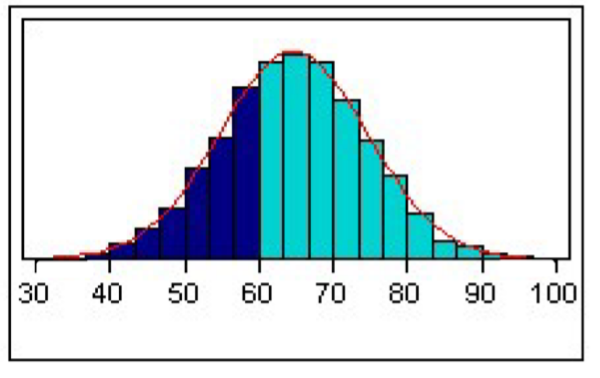
How did we solve how to calculate the proportion of students with scores less than 60? Unit 1
we can find this proportion by adding up the heights of all of the dark blue bars.

Why cant we just add up all the bars like in unit 1
You can’t calculate this proportion with the picture I’ve given you, since the y -axis is not labelled

What do we do to solve for the proportion instead unit 4?
We’d need to find the area to the left of 60 under the curve
Density curve (class)
The curve describing the overall shape of a distribution
proportion of observations falling within that interval
The area underneath the curve (and above the x - axis) covering an interval
What are the three properties of density curves?
The curve lies strictly on or above the x - axis
The total area underneath the curve and above the x - axis is equal to 1
The curve is a function
What is the total area underneath the curve and above the x axis?
The total area is equal to 1
why is the total area under the curve equal to 1?
This is because the area underneath the curve represents proportions: 100% of our observations lie underneath the curve, and so the total area under the curve is 1
how can you test if a curve is a function?
it passes the vertical line test.
What is the vertical line test?
any vertical line will cross/ touch the curve at most once
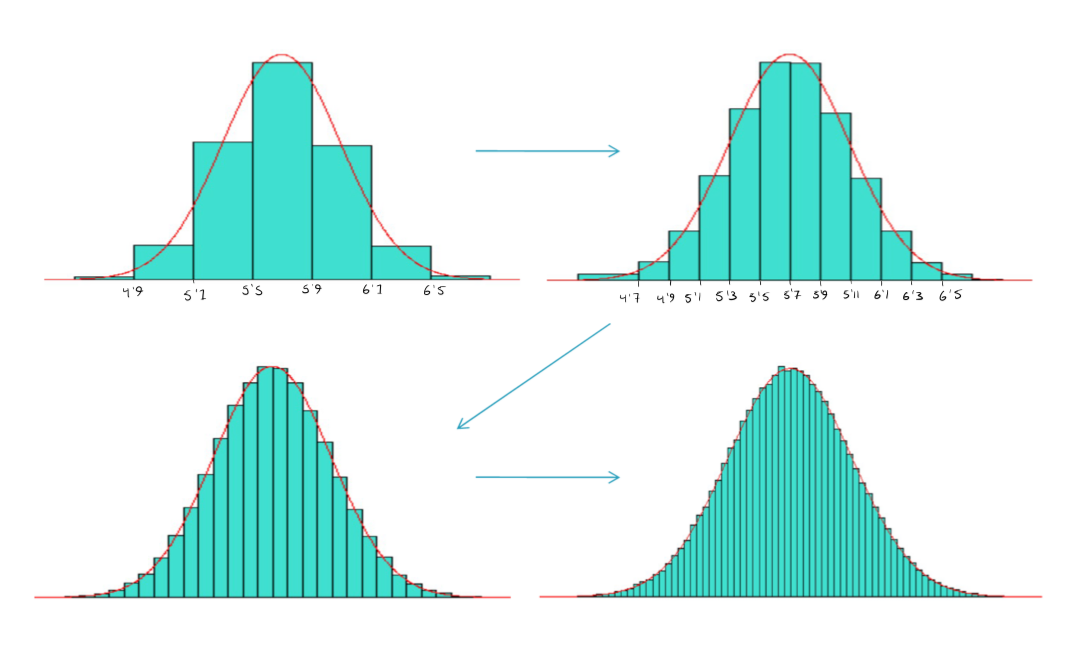
Is it better to have a larger population with a density curve?
yes
why is it better to have a larger population with density curves?
we can construct a histogram with as many intervals as we want: i.e. we can make the intervals very narrow
Each interval will still be “filled-out”:
allowing for a more accurate representation of the data.
What are histograms used for?
applicable to samples, or finite populations
What are density curves used for?
The distributions of continuous variables for “infinite” (i.e. very large) populations
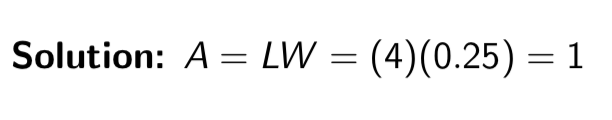
Uniform distribution
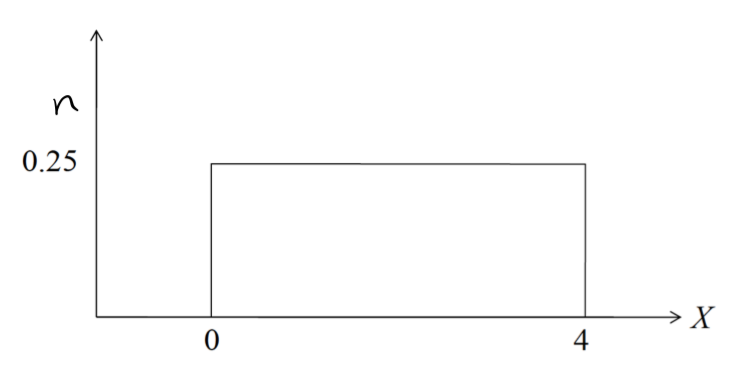

Verify that the area = 1
A= LW = (4)(0.25) = 1
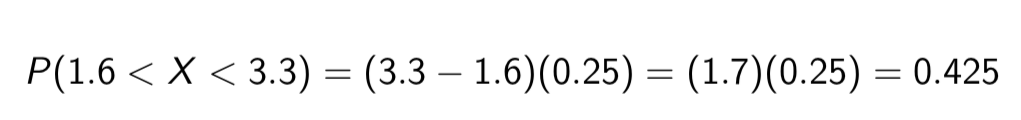
Proportion of vaues of X falling between two values (denoted)
(1.6 < x < 3.3)
between 1.6 and 3.3
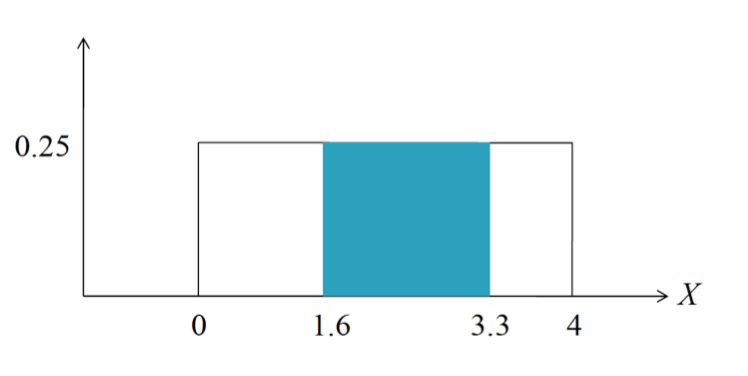
Find the proportion of values of X falling between 1.6 and 3.3 for the following distribution (Uniform distribution)
P(1.6 < X < 3.3) = (3.3 — 1.6)(0.25) = (1.7)(0.25) = 0.425
What is the formula for area of a rectangle / square
A = LxW, where L is the length and W is the width.
What does the area of every rectangle/ square equal in a density curve?
The area under the density curve equals 1
Triangular distribution


What is the formula for area of a triangle?
area = ½ (base x height)
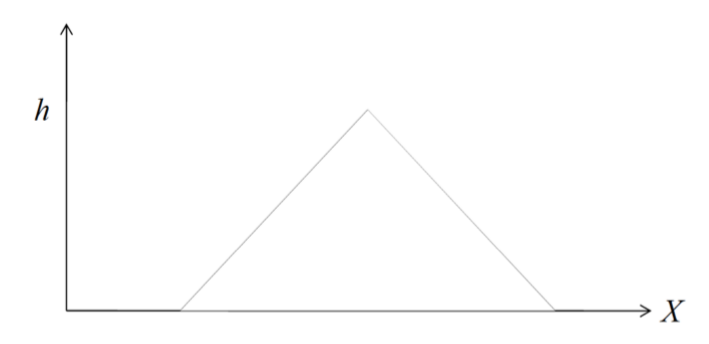
What must the value of the maximum height h be in order for this to be a valid density curve? (Triangular distribution)
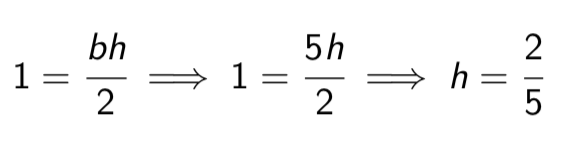
What does every area of a triangle equal
to 1 in a valid density curve, including a triangular distribution.
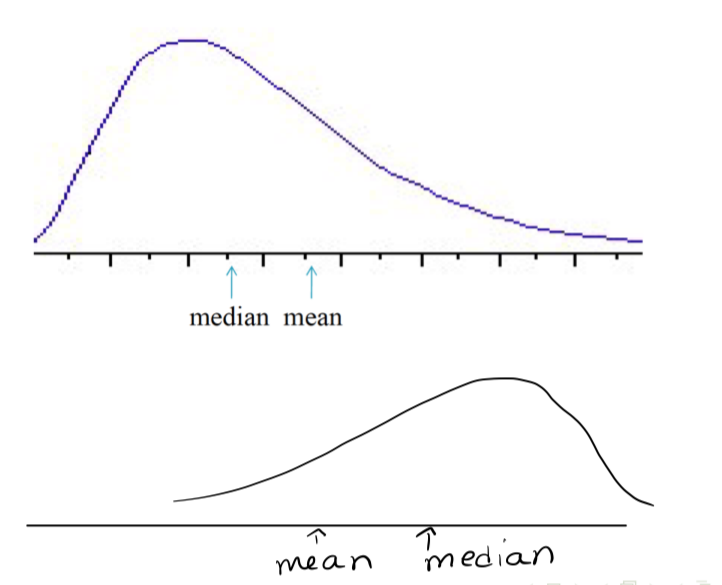
What else can we do with a density curve?
We can visually find/approximate the median and mean of the corresponding distribution:
Median of distribution (density curves)
point on the x-axis with area 0.5 under the curve to each side
Mean of distribution (density curves)
“balance point” along the x-axis.
This is the point at which the distribution would exactly balance if it were made of some solid material
Mean and median (Unit 1)
The mean and median for a symmetric distribution are equal. For a skewed distribution, the mean is closer to the tail
Sample mean
Is the average value of some variable for all units in a sample of the population
What is sample mean denoted as?
X~ ( \bar{x} )
Population mean
is the average value of some variable for all units in the entire population.
What is population mean denoted as?
μ (mu).
Can x~ and μ take any value?
They can take any values at all positive or negative
sample standard deviation denoted as
s
measures the dispersion of sample data.
Population standard deviation denoted as
σ (sigma)
what is population standard deviation?
The population standard deviation is a measure of the dispersion of a set of values in a whole population
quantifies how much the individual data points deviate from the population mean.
Sample variance denoted as?
s²
measures the dispersion of sample data.
what is population variance denoted as?
σ² (sigma squared)
what is population variance? (Easy)
It provides a mathematical representation of the overall spread of a data set, helping to understand the variability within the population.
what is population variance? (Harder)
measures the average of the squared deviations from the population mean, indicating the degree to which values in the population vary.
Can s, s², σ, σ² be negative?
No, all must be non-negative (i.e. greater than or equal to 0)
What is a parameter?
number that describes an entire population.
very large populations, the values of parameters are usually unknown
What are examples of parameters?
μ, σ², σ
Statistic / estimatior
number computed from sample data.
estimate the values of parameters
What are examples of statistics / estimators?
Sample mean (x~) , sample variance (s)